| Param | Original file | Final file |
|---|---|---|
| Filename | modeM0/AS1A05_175T01_9000003004_20264cztM0_level2.evt | modeM0/AS1A05_175T01_9000003004_20264cztM0_level2_quad_clean.evt |
| Size (bytes) | 643,749,120 | 67,409,280 |
| Size | 613.9 MB | 64.3 MB |
| Events in quadrant A | 8,319,785 | 364,921 |
| Events in quadrant B | 3,517,364 | 430,757 |
| Events in quadrant C | 3,367,764 | 404,764 |
| Events in quadrant D | 3,859,131 | 394,742 |
| Mode M0 | |||
|---|---|---|---|
| Quadrant | BADHDUFLAG | Total packets | Discarded packets |
| A | 0 | 28999 | 2 |
| B | 0 | 14180 | 2 |
| C | 0 | 13636 | 2 |
| D | 0 | 15394 | 2 |
| Mode SS | |||
|---|---|---|---|
| Quadrant | BADHDUFLAG | Total packets | Discarded packets |
| A | 0 | 130 | 0 |
| B | 0 | 130 | 0 |
| C | 0 | 130 | 0 |
| D | 0 | 130 | 0 |
| Mode M9 | |||
|---|---|---|---|
| Quadrant | BADHDUFLAG | Total packets | Discarded packets |
| A | 0 | 20 | 0 |
| B | 0 | 21 | 0 |
| C | 0 | 21 | 0 |
| D | 0 | 21 | 0 |
| Quadrant | Total seconds | Saturated seconds | Saturation percentage |
|---|---|---|---|
| A | 6383 | 1816 | 28.450572% |
| B | 6383 | 53 | 0.830331% |
| C | 6383 | 57 | 0.892997% |
| D | 6383 | 104 | 1.629328% |
Noise dominated data is calculated using 1-second bins in cleaned event files. If a bin has >2000 counts, and if more than 50% of those come from <1% of pixels, then it is considered to be noise-dominated and hence unusable.
| Quadrant | # 1 sec bins | Bins with >0 counts | Bins with >2000 counts | High rate bins dominated by noise | Noise dominated (total time) | Noise dominated (detector-on time) | Marked lightcurve |
|---|---|---|---|---|---|---|---|
| A | 7753 | 6384 | 1265 | 1265 | 16.32% | 19.82% | 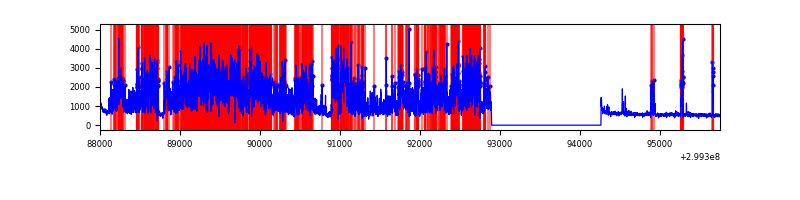 |
| B | 7753 | 6384 | 6 | 6 | 0.08% | 0.09% | 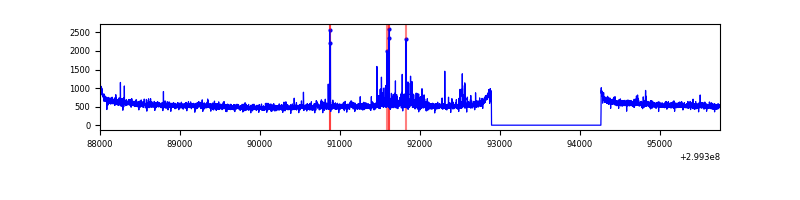 |
| C | 7753 | 6384 | 0 | 0 | 0.00% | 0.00% | 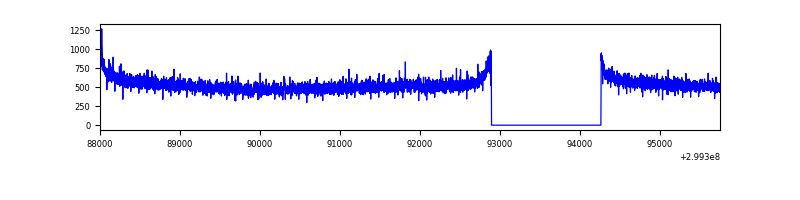 |
| D | 7753 | 6384 | 89 | 89 | 1.15% | 1.39% | 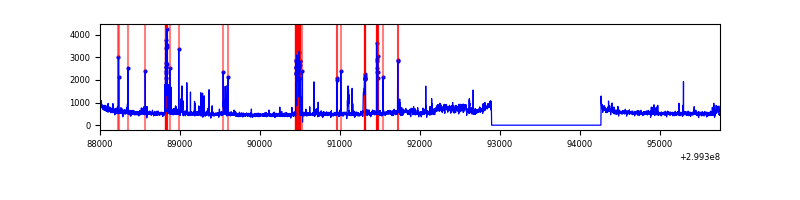 |
Top three noisy pixels from each quadrant. If the there are fewer than three noisy pixels in the level2.evt file, extra rows are filled as -1
| Pixel properties | Quadrant properties | ||||||
|---|---|---|---|---|---|---|---|
| Quadrant | DetID | PixID | Counts | Sigma | Mean | Median | Sigma |
| A | 14 | 238 | 5198335 | 33552.38 | 780 | 766 | 154.9 |
| A | 4 | 2 | 91509 | 585.78 | 780 | 766 | 154.9 |
| A | 8 | 205 | 17425 | 107.54 | 780 | 766 | 154.9 |
| B | 7 | 220 | 72495 | 447.53 | 864 | 845 | 160.1 |
| B | 12 | 111 | 18620 | 111.02 | 864 | 845 | 160.1 |
| B | 11 | 111 | 16654 | 98.74 | 864 | 845 | 160.1 |
| C | 14 | 238 | 134725 | 708.26 | 820 | 828 | 189.0 |
| C | 0 | 207 | 26501 | 135.8 | 820 | 828 | 189.0 |
| C | 3 | 233 | 6734 | 31.24 | 820 | 828 | 189.0 |
| D | 1 | 52 | 408405 | 2039.6 | 828 | 808 | 199.8 |
| D | 11 | 176 | 144596 | 719.51 | 828 | 808 | 199.8 |
| D | 7 | 238 | 77074 | 381.63 | 828 | 808 | 199.8 |
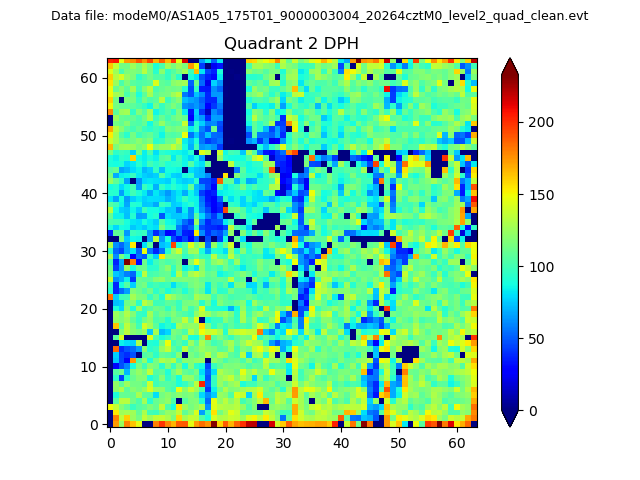
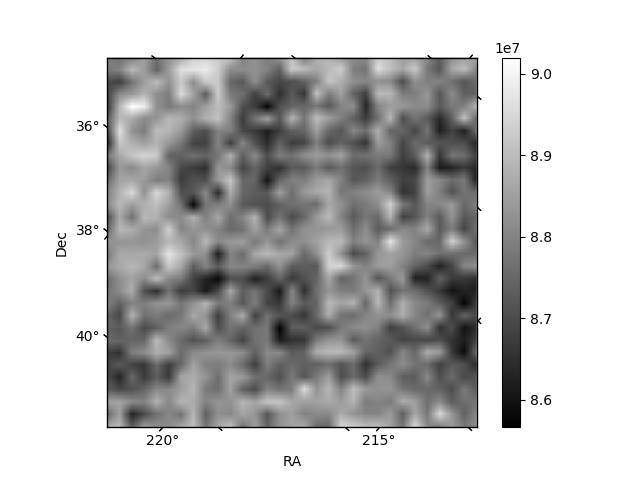
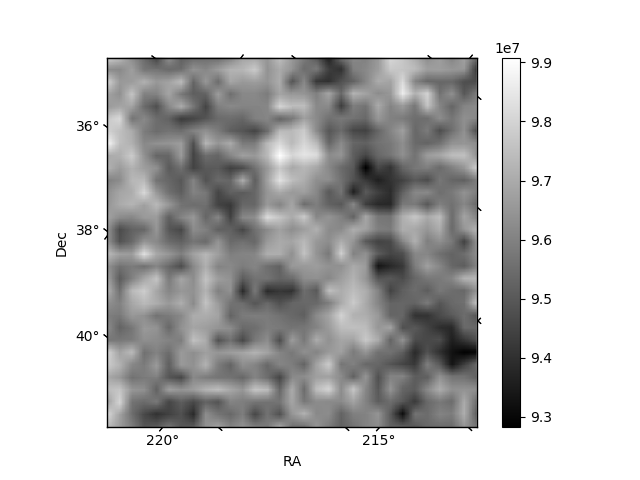
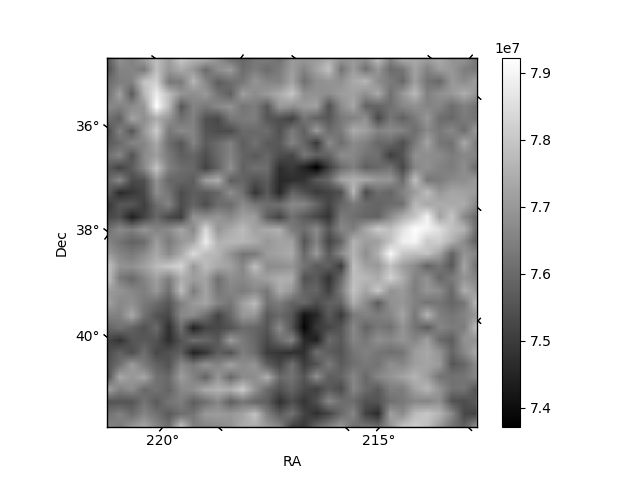
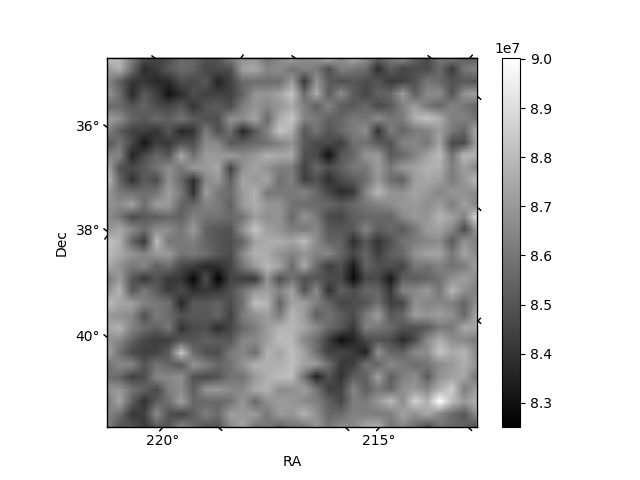
Histogram calculated using DETX and DETY for each event in the final _common_clean file
| Quadrant A |  |
 |
Quadrant B |
|---|---|---|---|
| Quadrant D |  |
 |
Quadrant C |
| Plot type | Count rate plots | Images |
|---|---|---|
| Comparison with Poisson distribution Blue bars denote a histogram of data divided into 1 sec bins. Red curve is a Poisson curve with rate = median count rate of data. |
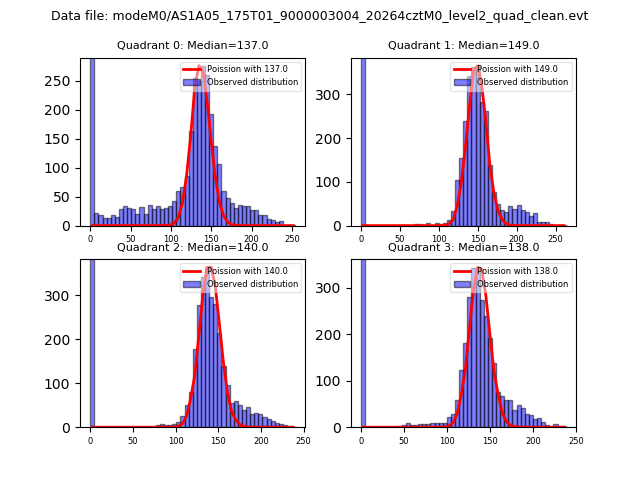 |
 |
| Quadrant-wise count rates Data is divided into 100 sec bins |
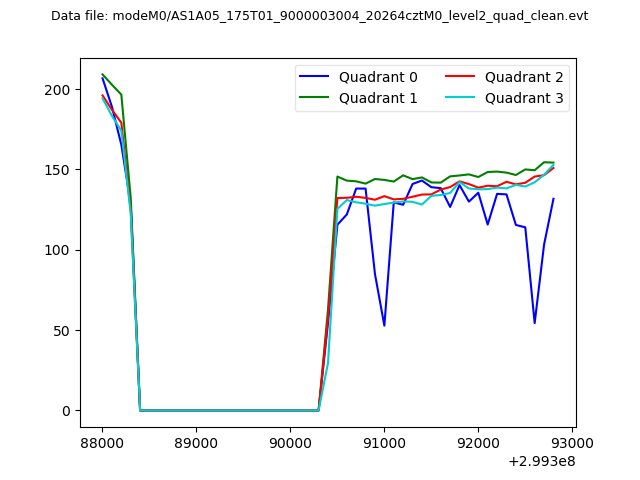 |
|
| Module-wise count rates for Quadrant A Data is divided into 100 sec bins |
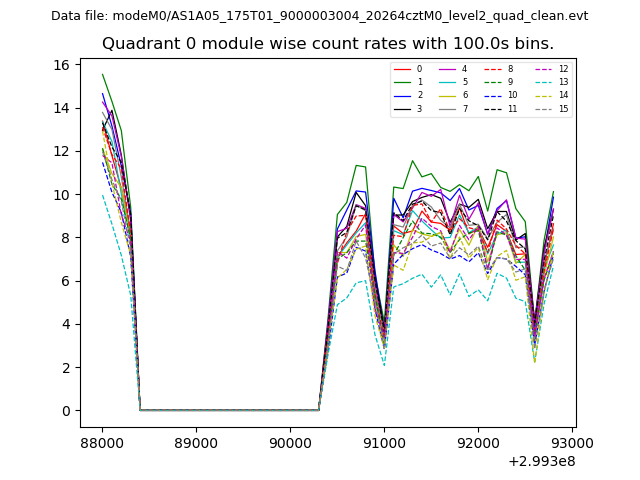 |
 |
| Module-wise count rates for Quadrant B Data is divided into 100 sec bins |
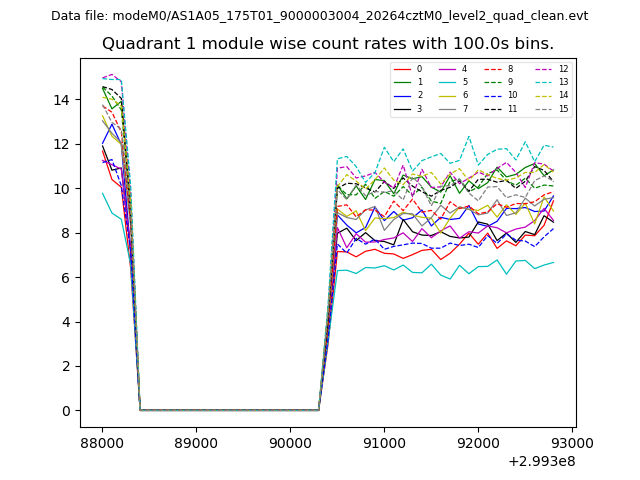 |
 |
| Module-wise count rates for Quadrant C Data is divided into 100 sec bins |
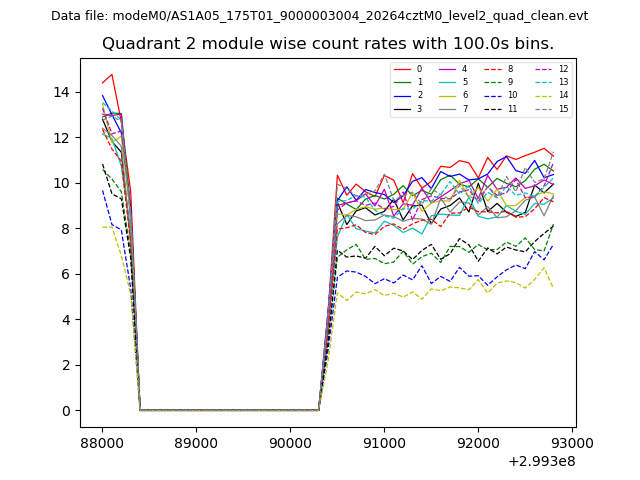 |
 |
| Module-wise count rates for Quadrant D Data is divided into 100 sec bins |
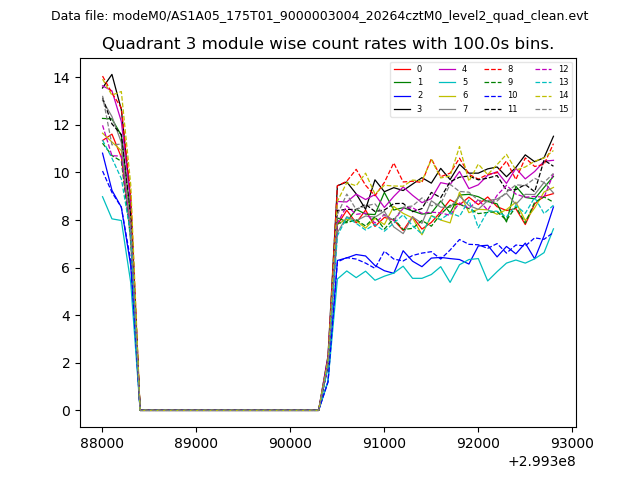 |
 |
| Parameter | Plot |
|---|---|
| CZT HV Monitor | 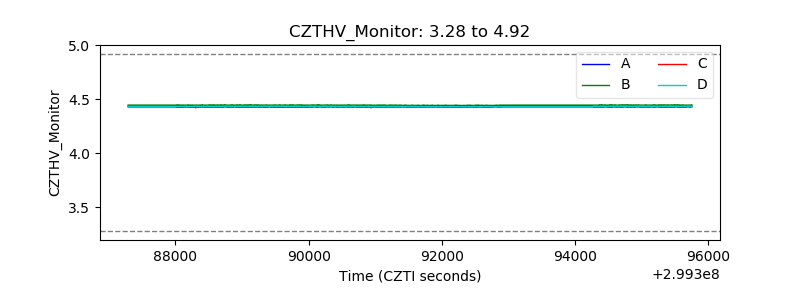 |
| D_VDD | 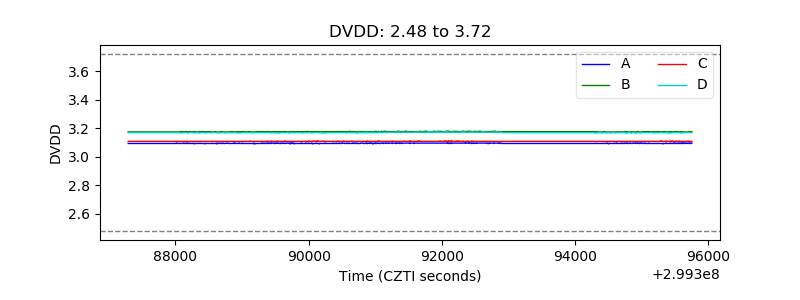 |
| Temperature 1 | 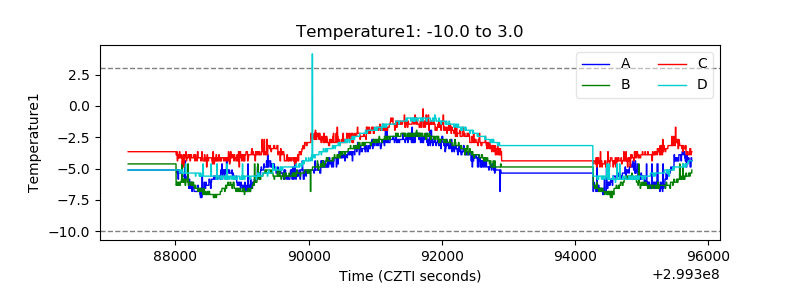 |
| Veto HV Monitor | 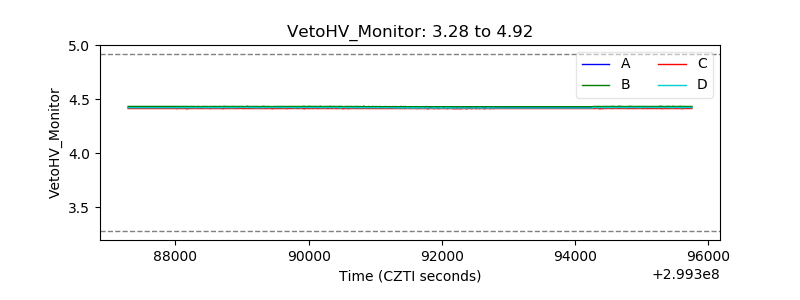 |
| Veto LLD | 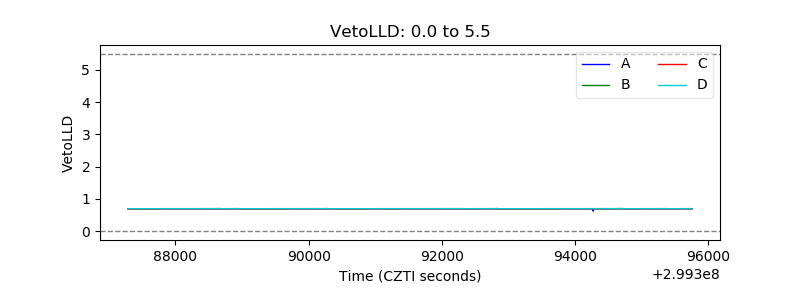 |
| Alpha Counter | 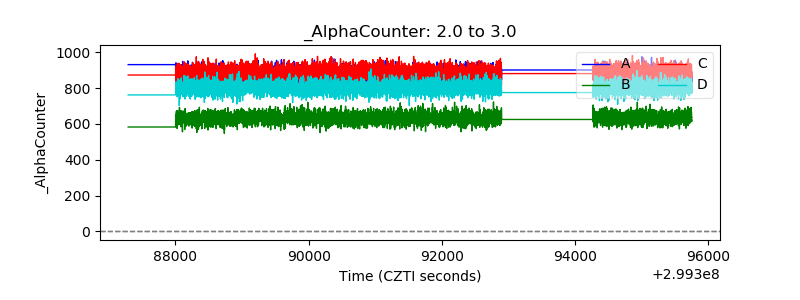 |
| _CPM_Rate | 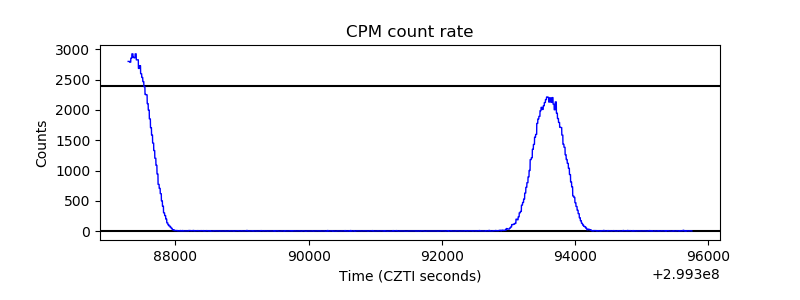 |
| CZT Counter | 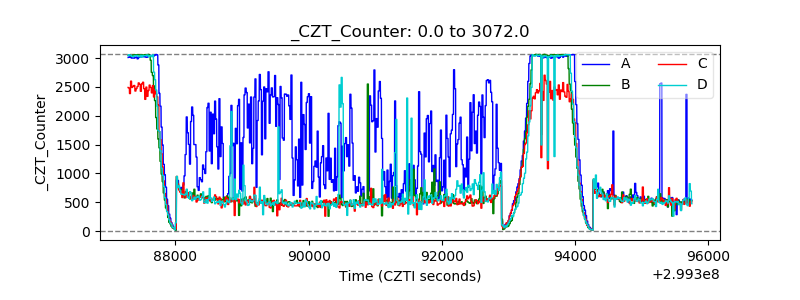 |
| +2.5 Volts monitor |  |
| +5 Volts monitor |  |
| _ROLL_ROT | 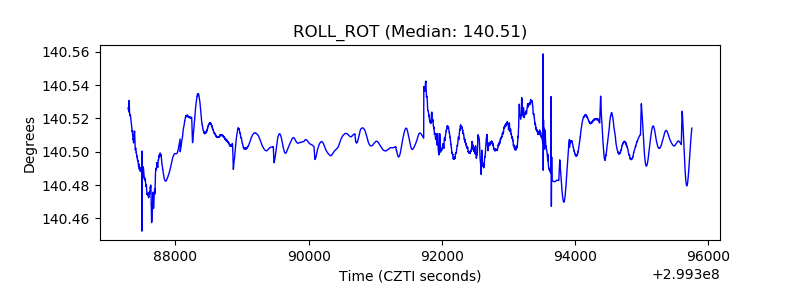 |
| _Roll_DEC | 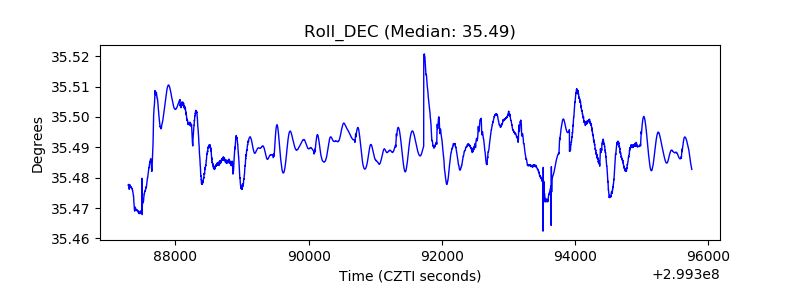 |
| _Roll_RA | 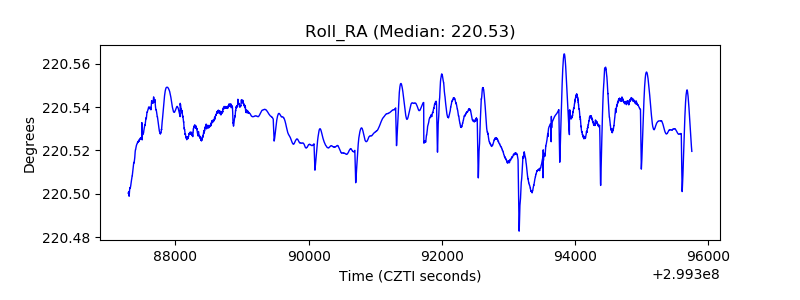 |
| Veto Counter | 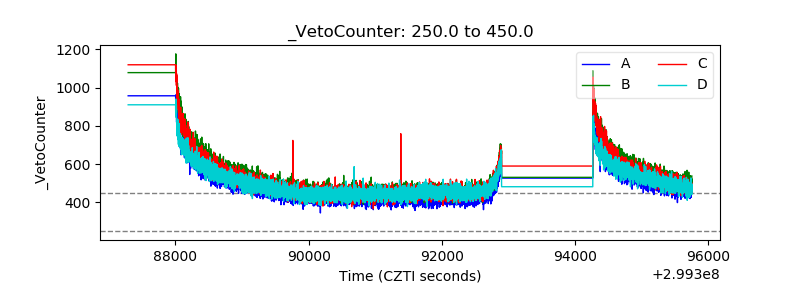 |