| Param | Original file | Final file |
|---|---|---|
| Filename | modeM0/AS1A05_175T01_9000003004_20265cztM0_level2.evt | modeM0/AS1A05_175T01_9000003004_20265cztM0_level2_quad_clean.evt |
| Size (bytes) | 487,575,360 | 68,307,840 |
| Size | 465.0 MB | 65.1 MB |
| Events in quadrant A | 3,648,130 | 417,027 |
| Events in quadrant B | 3,430,713 | 421,291 |
| Events in quadrant C | 3,315,021 | 398,974 |
| Events in quadrant D | 3,946,087 | 392,472 |
| Mode M0 | |||
|---|---|---|---|
| Quadrant | BADHDUFLAG | Total packets | Discarded packets |
| A | 0 | 14425 | 2 |
| B | 0 | 13796 | 2 |
| C | 0 | 13404 | 2 |
| D | 0 | 15435 | 2 |
| Mode SS | |||
|---|---|---|---|
| Quadrant | BADHDUFLAG | Total packets | Discarded packets |
| A | 0 | 128 | 0 |
| B | 0 | 128 | 0 |
| C | 0 | 128 | 0 |
| D | 0 | 128 | 0 |
| Mode M9 | |||
|---|---|---|---|
| Quadrant | BADHDUFLAG | Total packets | Discarded packets |
| A | 0 | 16 | 0 |
| B | 0 | 17 | 0 |
| C | 0 | 17 | 0 |
| D | 0 | 17 | 0 |
| Quadrant | Total seconds | Saturated seconds | Saturation percentage |
|---|---|---|---|
| A | 6279 | 153 | 2.436694% |
| B | 6279 | 117 | 1.863354% |
| C | 6279 | 103 | 1.640389% |
| D | 6279 | 191 | 3.041886% |
Noise dominated data is calculated using 1-second bins in cleaned event files. If a bin has >2000 counts, and if more than 50% of those come from <1% of pixels, then it is considered to be noise-dominated and hence unusable.
| Quadrant | # 1 sec bins | Bins with >0 counts | Bins with >2000 counts | High rate bins dominated by noise | Noise dominated (total time) | Noise dominated (detector-on time) | Marked lightcurve |
|---|---|---|---|---|---|---|---|
| A | 7574 | 6280 | 44 | 44 | 0.58% | 0.70% | 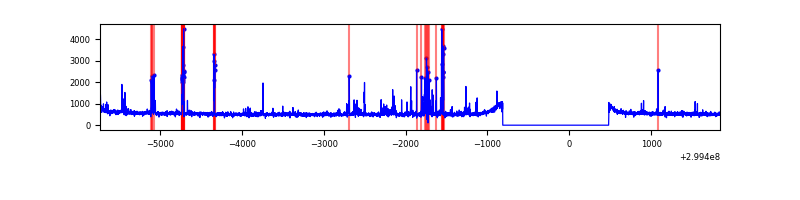 |
| B | 7574 | 6280 | 6 | 6 | 0.08% | 0.10% | 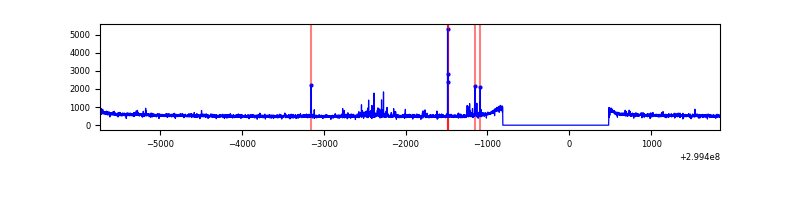 |
| C | 7574 | 6280 | 0 | 0 | 0.00% | 0.00% | 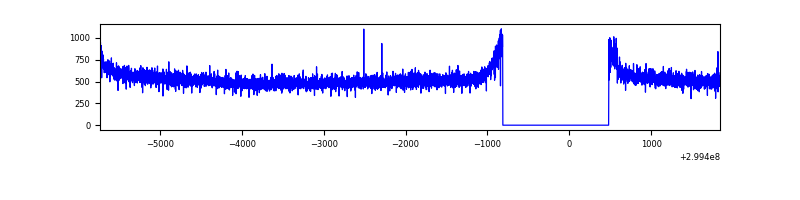 |
| D | 7574 | 6280 | 134 | 134 | 1.77% | 2.13% | 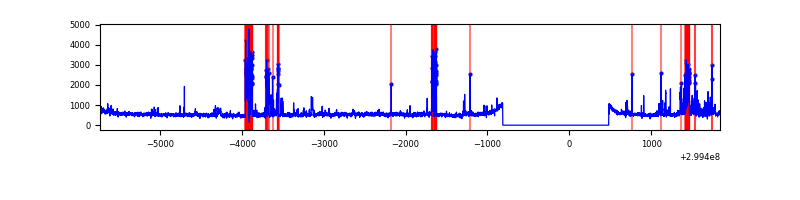 |
Top three noisy pixels from each quadrant. If the there are fewer than three noisy pixels in the level2.evt file, extra rows are filled as -1
| Pixel properties | Quadrant properties | ||||||
|---|---|---|---|---|---|---|---|
| Quadrant | DetID | PixID | Counts | Sigma | Mean | Median | Sigma |
| A | 14 | 238 | 152130 | 888.54 | 851 | 837 | 170.3 |
| A | 4 | 2 | 126478 | 737.89 | 851 | 837 | 170.3 |
| A | 8 | 205 | 40045 | 230.27 | 851 | 837 | 170.3 |
| B | 7 | 220 | 40672 | 251.59 | 849 | 831 | 158.4 |
| B | 3 | 64 | 21541 | 130.78 | 849 | 831 | 158.4 |
| B | 12 | 111 | 18774 | 113.31 | 849 | 831 | 158.4 |
| C | 14 | 238 | 130689 | 701.48 | 805 | 814 | 185.1 |
| C | 0 | 207 | 28545 | 149.78 | 805 | 814 | 185.1 |
| C | 1 | 16 | 9111 | 44.81 | 805 | 814 | 185.1 |
| D | 11 | 176 | 322843 | 1660.52 | 814 | 792 | 193.9 |
| D | 7 | 238 | 239368 | 1230.12 | 814 | 792 | 193.9 |
| D | 1 | 52 | 197258 | 1012.99 | 814 | 792 | 193.9 |
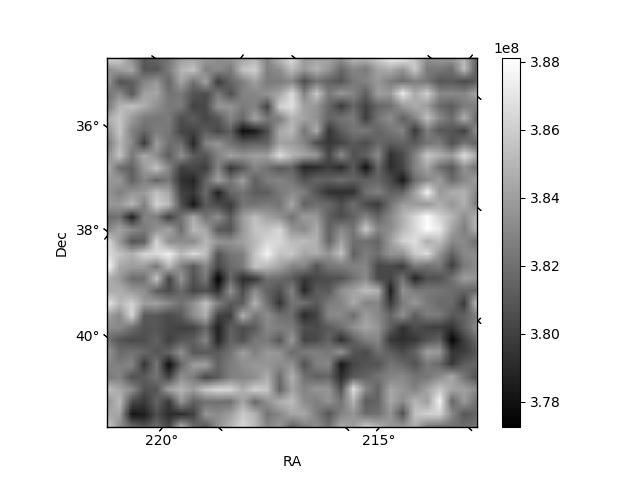
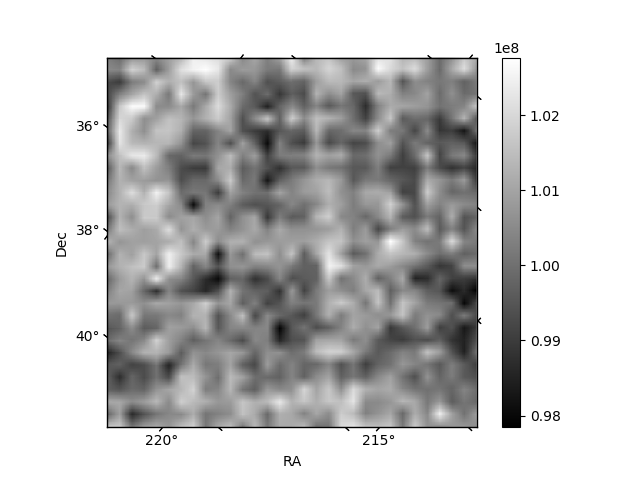
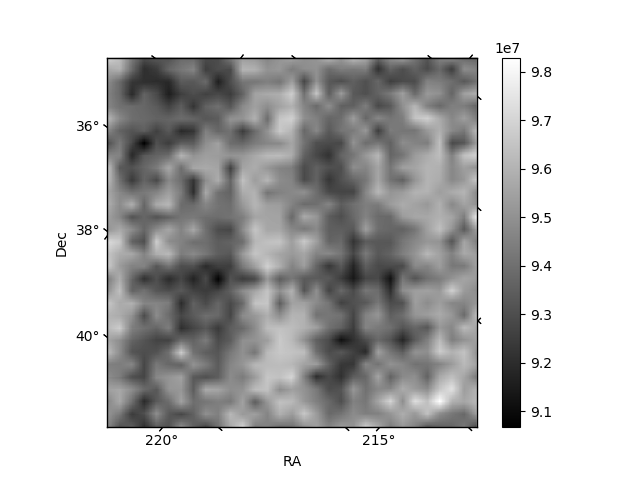
Histogram calculated using DETX and DETY for each event in the final _common_clean file
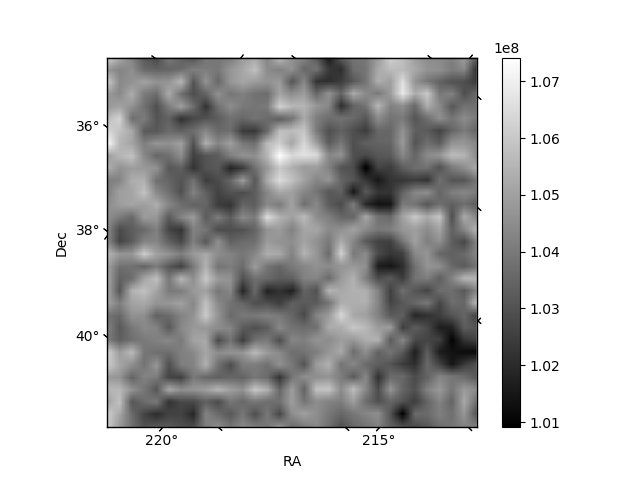
| Quadrant A | 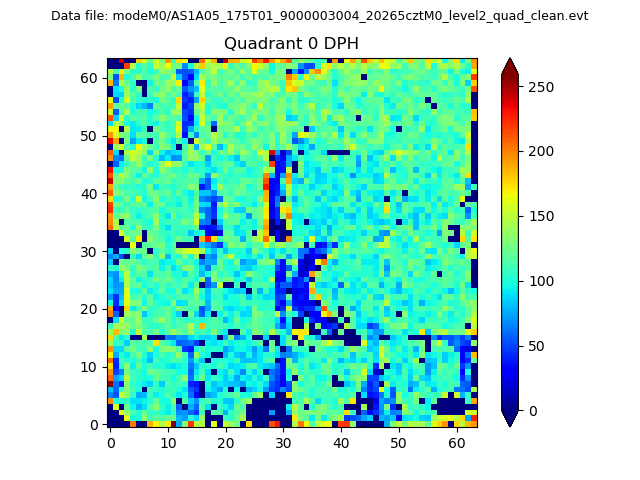 |
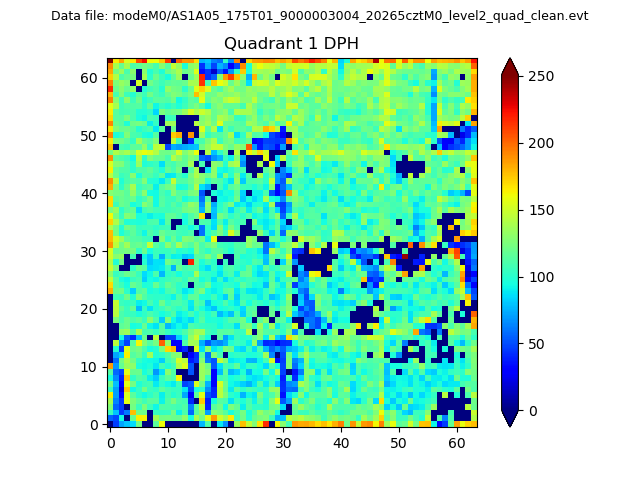 |
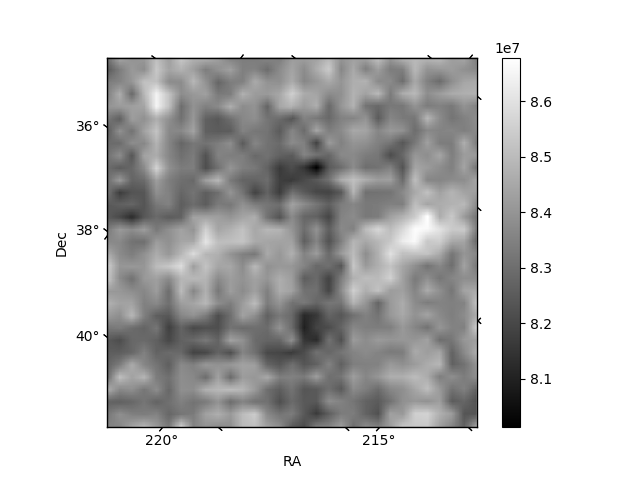
Quadrant B |
|---|---|---|---|
| Quadrant D | 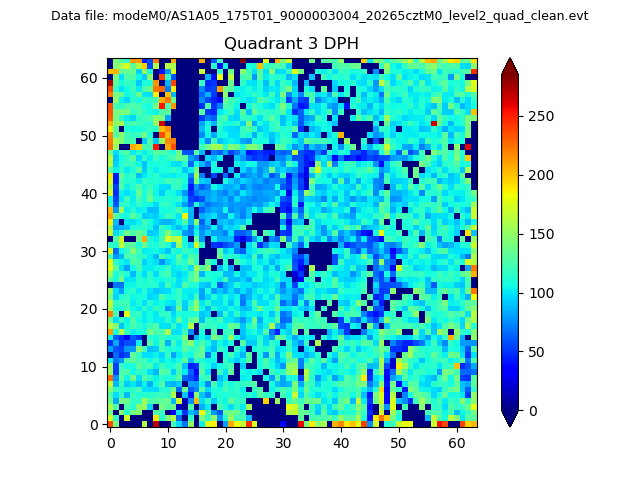 |
 |
Quadrant C |
| Plot type | Count rate plots | Images |
|---|---|---|
| Comparison with Poisson distribution Blue bars denote a histogram of data divided into 1 sec bins. Red curve is a Poisson curve with rate = median count rate of data. |
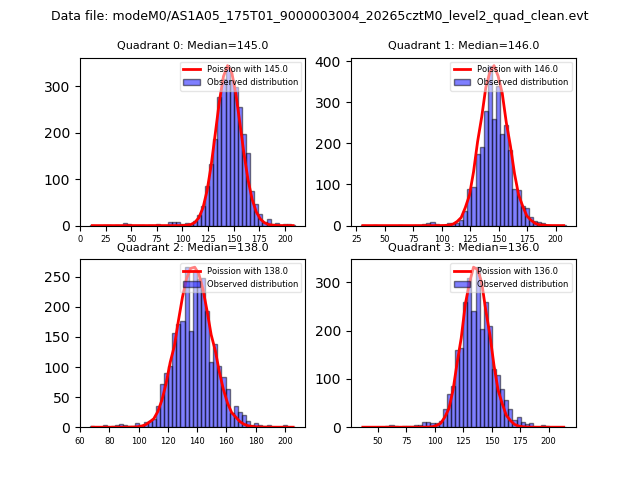 |
 |
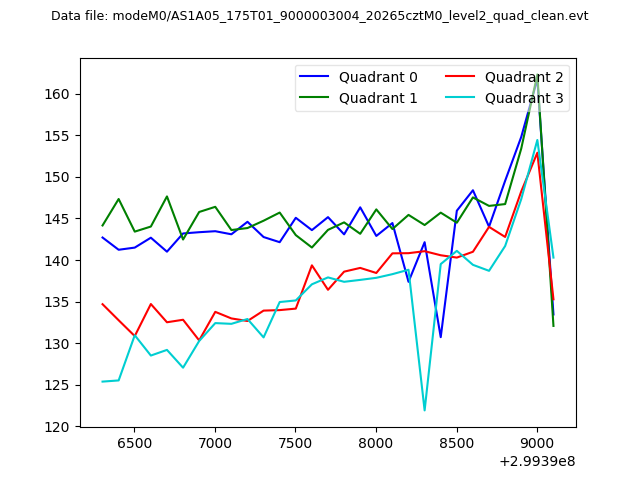
| Quadrant-wise count rates Data is divided into 100 sec bins |
 |
|
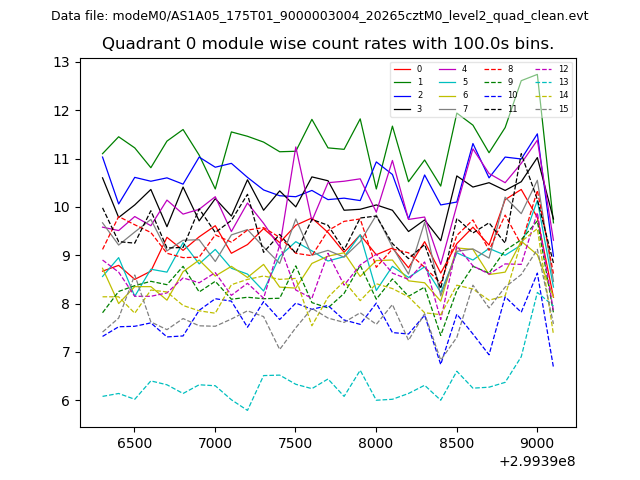
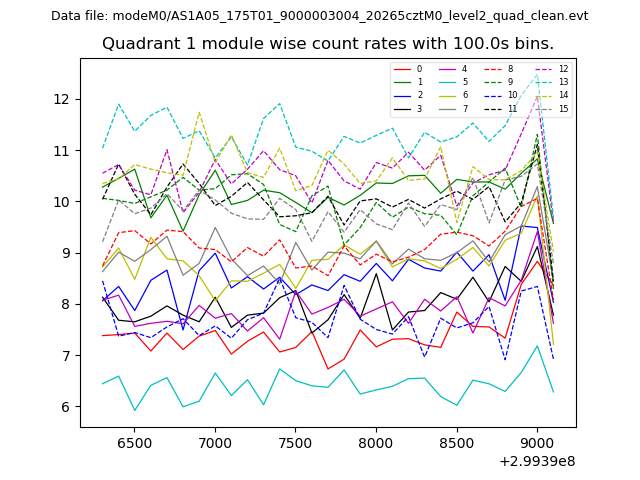
| Module-wise count rates for Quadrant A Data is divided into 100 sec bins |
 |
 |
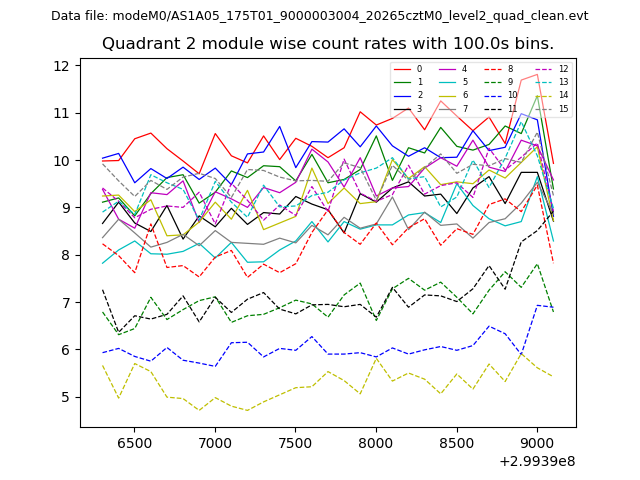
| Module-wise count rates for Quadrant B Data is divided into 100 sec bins |
 |
 |
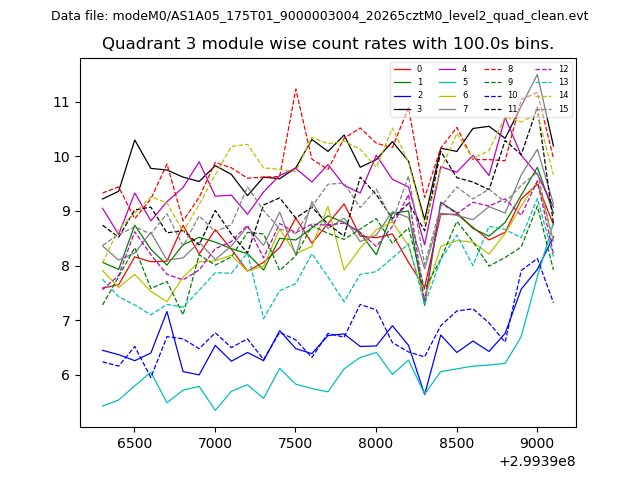
| Module-wise count rates for Quadrant C Data is divided into 100 sec bins |
 |
 |
| Module-wise count rates for Quadrant D Data is divided into 100 sec bins |
 |
 |
| Parameter | Plot |
|---|---|
| CZT HV Monitor | 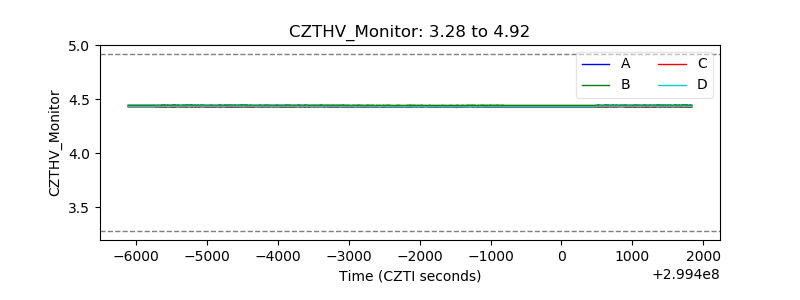 |
| D_VDD | 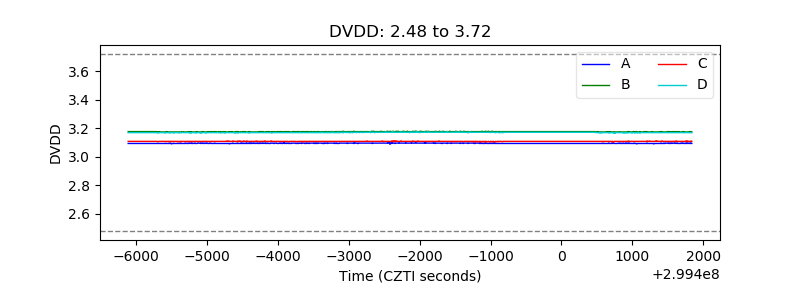 |
| Temperature 1 | 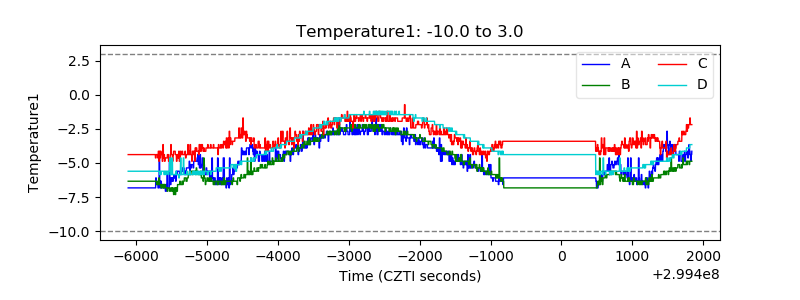 |
| Veto HV Monitor | 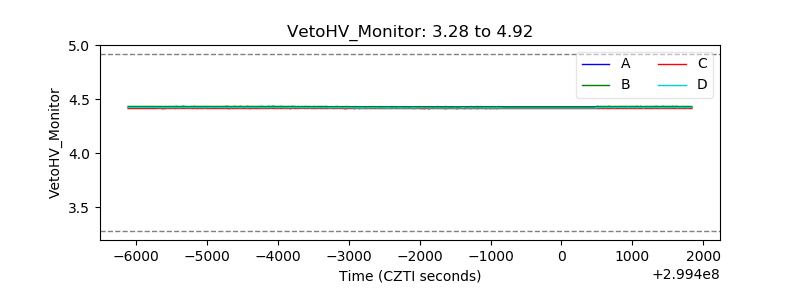 |
| Veto LLD | 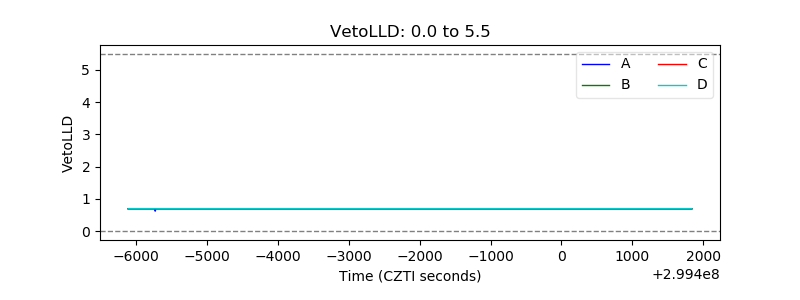 |
| Alpha Counter | 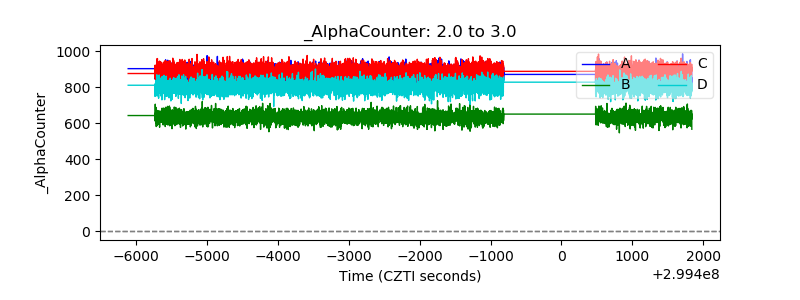 |
| _CPM_Rate | 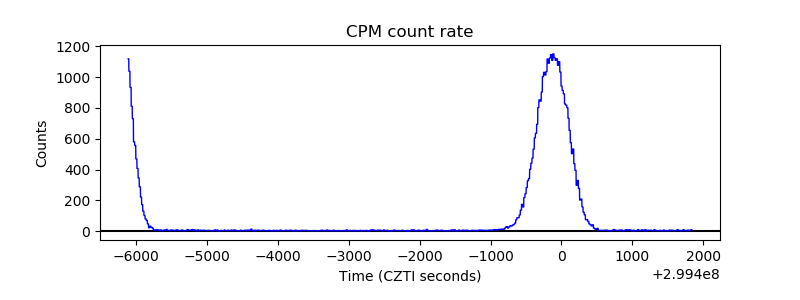 |
| CZT Counter | 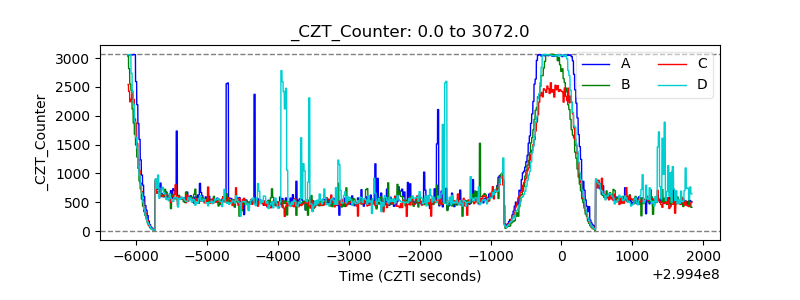 |
| +2.5 Volts monitor |  |
| +5 Volts monitor | 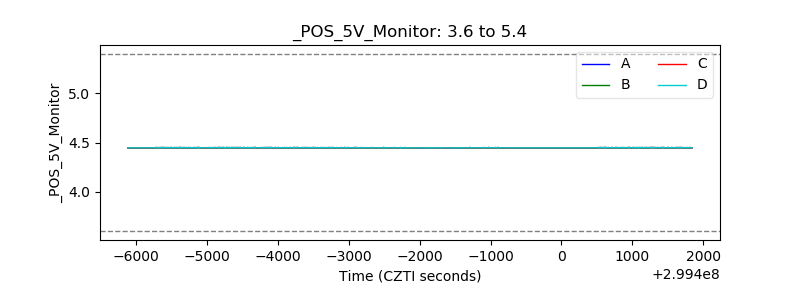 |
| _ROLL_ROT | 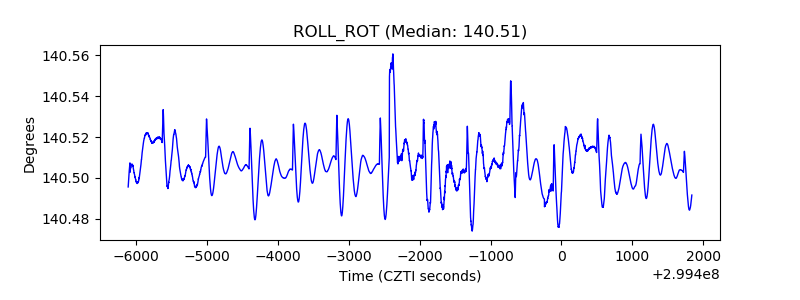 |
| _Roll_DEC | 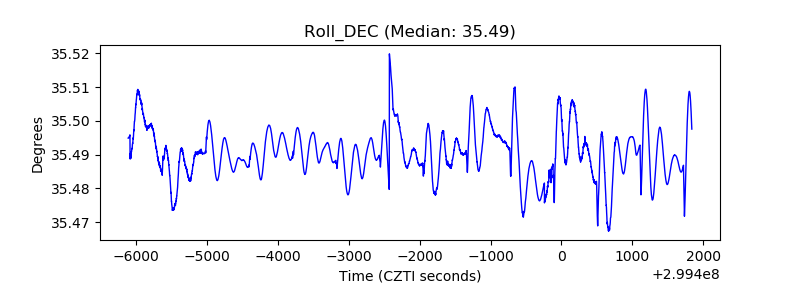 |
| _Roll_RA | 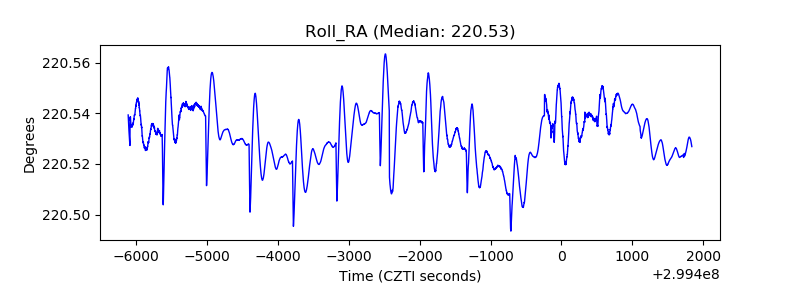 |
| Veto Counter | 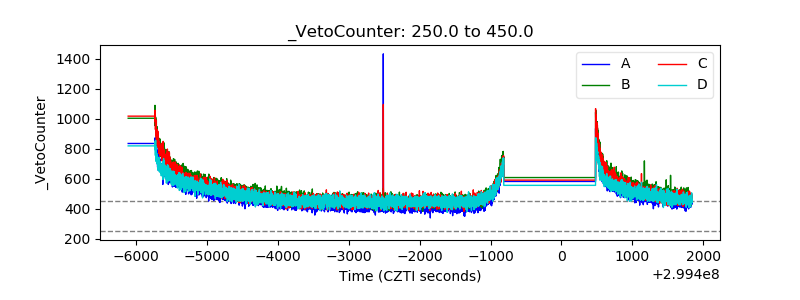 |