| Param | Original file | Final file |
|---|---|---|
| Filename | modeM0/AS1A05_175T01_9000003004_20266cztM0_level2.evt | modeM0/AS1A05_175T01_9000003004_20266cztM0_level2_quad_clean.evt |
| Size (bytes) | 489,222,720 | 80,867,520 |
| Size | 466.6 MB | 77.1 MB |
| Events in quadrant A | 3,692,246 | 510,286 |
| Events in quadrant B | 3,600,322 | 513,046 |
| Events in quadrant C | 3,341,785 | 486,653 |
| Events in quadrant D | 3,737,057 | 482,060 |
| Mode M0 | |||
|---|---|---|---|
| Quadrant | BADHDUFLAG | Total packets | Discarded packets |
| A | 0 | 14754 | 2 |
| B | 0 | 14464 | 2 |
| C | 0 | 13739 | 2 |
| D | 0 | 15228 | 2 |
| Mode SS | |||
|---|---|---|---|
| Quadrant | BADHDUFLAG | Total packets | Discarded packets |
| A | 0 | 134 | 0 |
| B | 0 | 134 | 0 |
| C | 0 | 134 | 0 |
| D | 0 | 134 | 0 |
| Mode M9 | |||
|---|---|---|---|
| Quadrant | BADHDUFLAG | Total packets | Discarded packets |
| A | 0 | 15 | 0 |
| B | 0 | 16 | 0 |
| C | 0 | 16 | 0 |
| D | 0 | 16 | 0 |
| Quadrant | Total seconds | Saturated seconds | Saturation percentage |
|---|---|---|---|
| A | 6544 | 190 | 2.903423% |
| B | 6544 | 181 | 2.765892% |
| C | 6544 | 141 | 2.154645% |
| D | 6544 | 141 | 2.154645% |
Noise dominated data is calculated using 1-second bins in cleaned event files. If a bin has >2000 counts, and if more than 50% of those come from <1% of pixels, then it is considered to be noise-dominated and hence unusable.
| Quadrant | # 1 sec bins | Bins with >0 counts | Bins with >2000 counts | High rate bins dominated by noise | Noise dominated (total time) | Noise dominated (detector-on time) | Marked lightcurve |
|---|---|---|---|---|---|---|---|
| A | 7654 | 6545 | 39 | 39 | 0.51% | 0.60% | 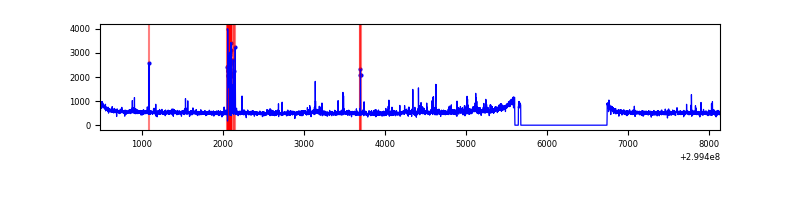 |
| B | 7654 | 6545 | 19 | 19 | 0.25% | 0.29% | 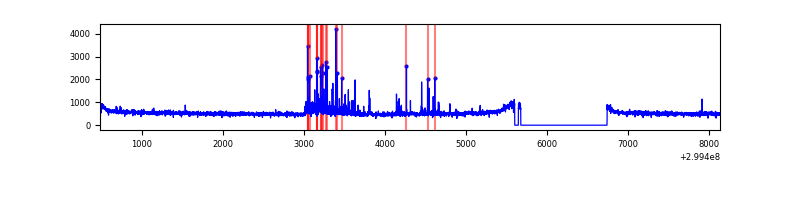 |
| C | 7654 | 6546 | 0 | 0 | 0.00% | 0.00% | 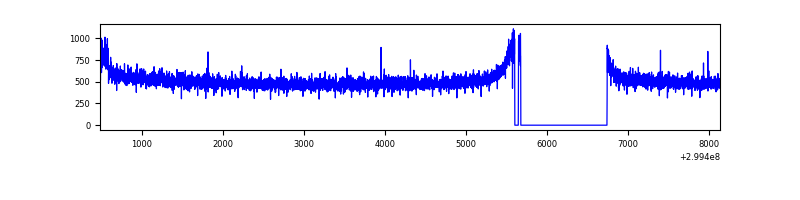 |
| D | 7654 | 6546 | 57 | 57 | 0.74% | 0.87% | 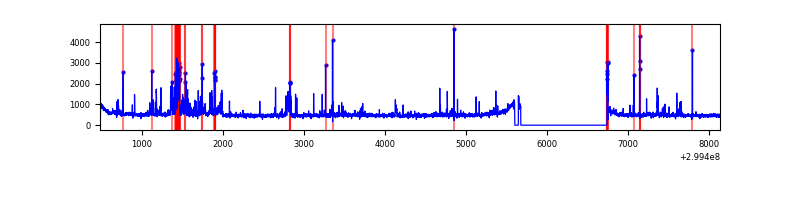 |
Top three noisy pixels from each quadrant. If the there are fewer than three noisy pixels in the level2.evt file, extra rows are filled as -1
| Pixel properties | Quadrant properties | ||||||
|---|---|---|---|---|---|---|---|
| Quadrant | DetID | PixID | Counts | Sigma | Mean | Median | Sigma |
| A | 14 | 238 | 170940 | 988.76 | 862 | 845 | 172.0 |
| A | 10 | 253 | 142679 | 824.48 | 862 | 845 | 172.0 |
| A | 8 | 205 | 22810 | 127.68 | 862 | 845 | 172.0 |
| B | 7 | 220 | 137562 | 848.61 | 857 | 837 | 161.1 |
| B | 4 | 142 | 39247 | 238.4 | 857 | 837 | 161.1 |
| B | 0 | 197 | 27531 | 165.68 | 857 | 837 | 161.1 |
| C | 14 | 238 | 130783 | 689.43 | 816 | 825 | 188.5 |
| C | 0 | 207 | 16947 | 85.53 | 816 | 825 | 188.5 |
| C | 13 | 61 | 5653 | 25.61 | 816 | 825 | 188.5 |
| D | 7 | 238 | 289468 | 1450.66 | 834 | 812 | 199.0 |
| D | 11 | 176 | 164934 | 824.81 | 834 | 812 | 199.0 |
| D | 1 | 52 | 72685 | 361.2 | 834 | 812 | 199.0 |
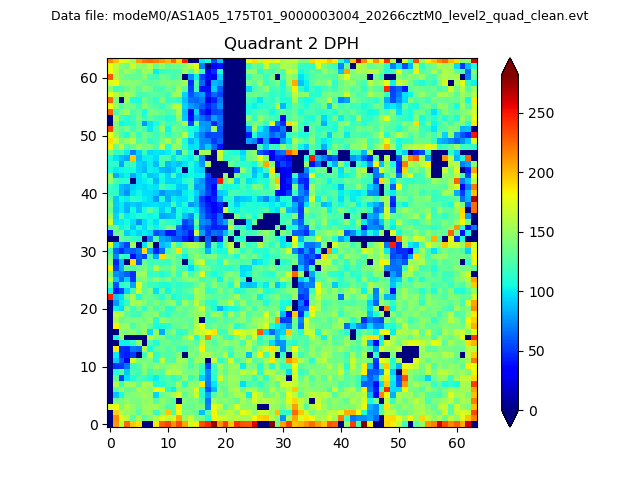
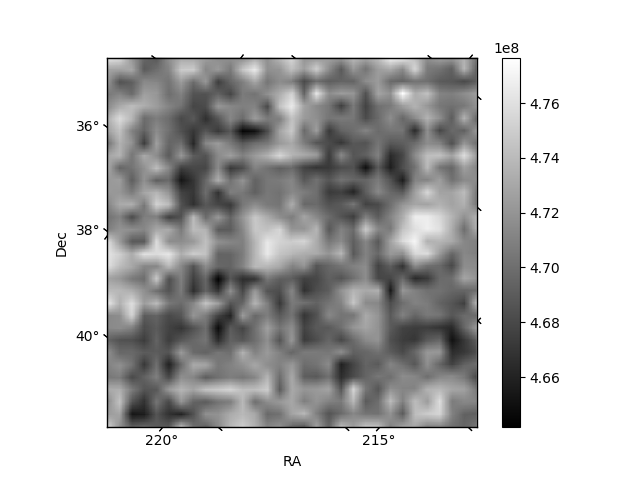
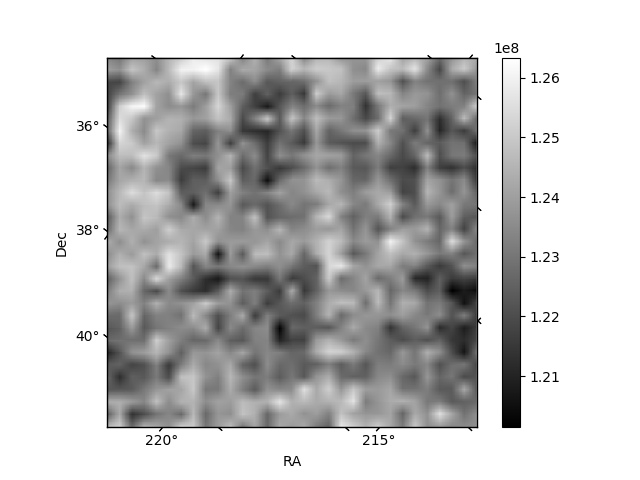
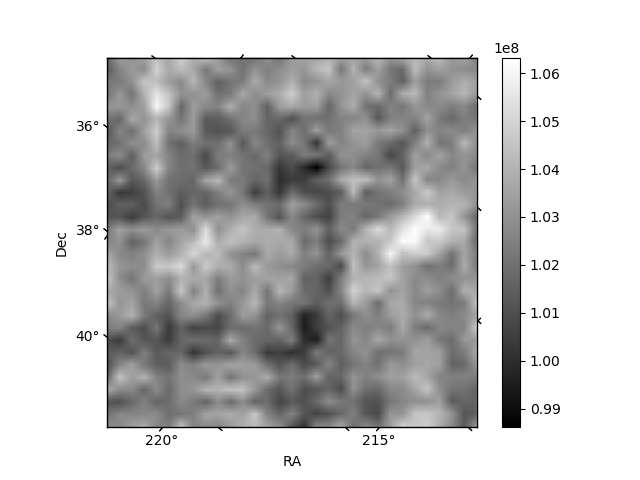
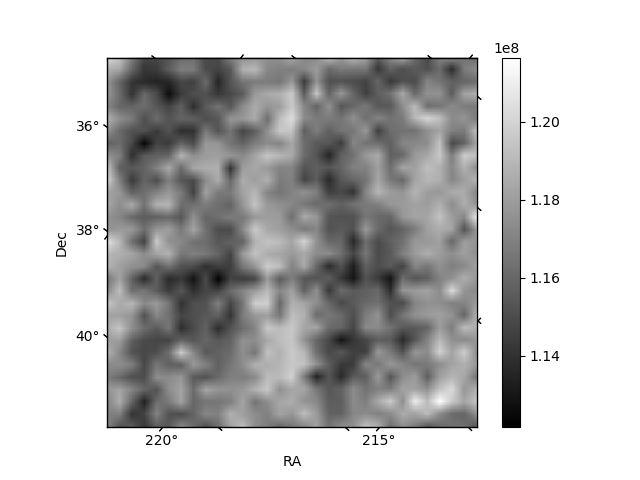
Histogram calculated using DETX and DETY for each event in the final _common_clean file
| Quadrant A | 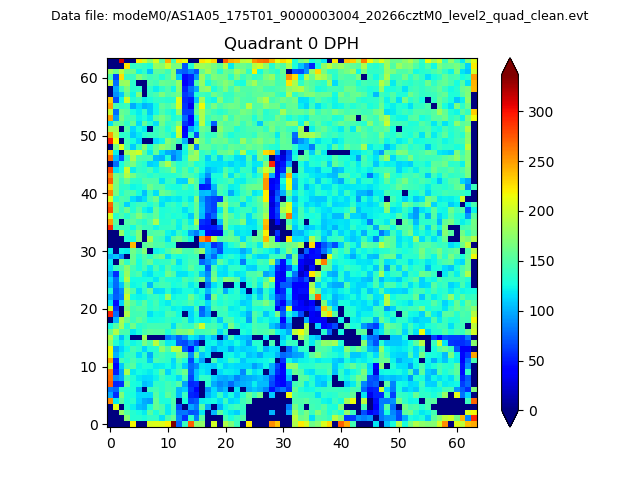 |
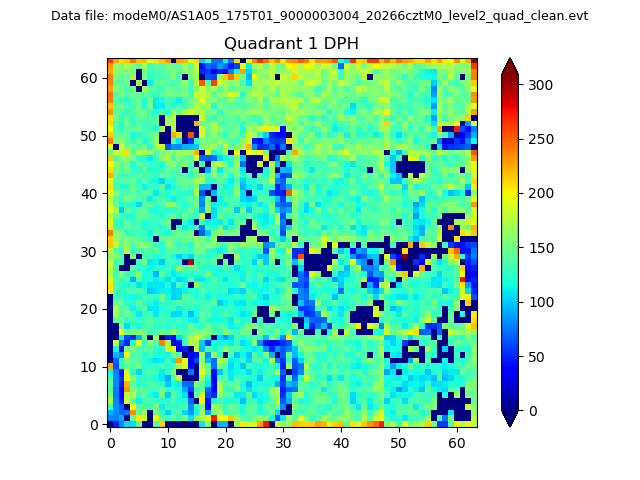 |
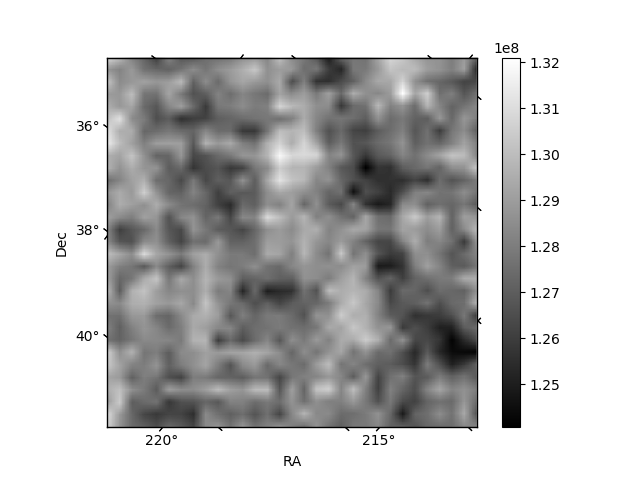
Quadrant B |
|---|---|---|---|
| Quadrant D | 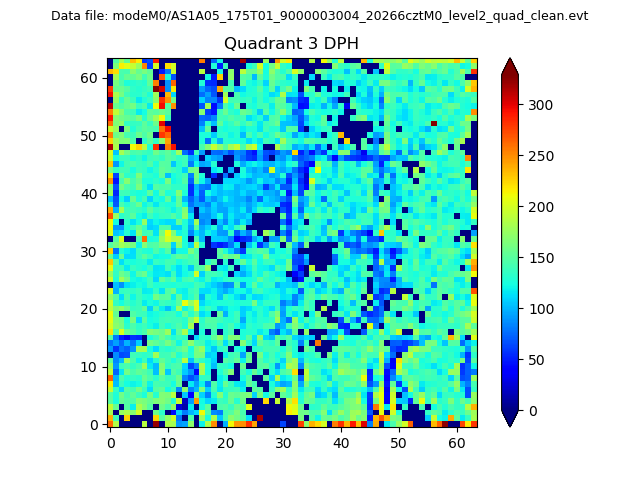 |
 |
Quadrant C |
| Plot type | Count rate plots | Images |
|---|---|---|
| Comparison with Poisson distribution Blue bars denote a histogram of data divided into 1 sec bins. Red curve is a Poisson curve with rate = median count rate of data. |
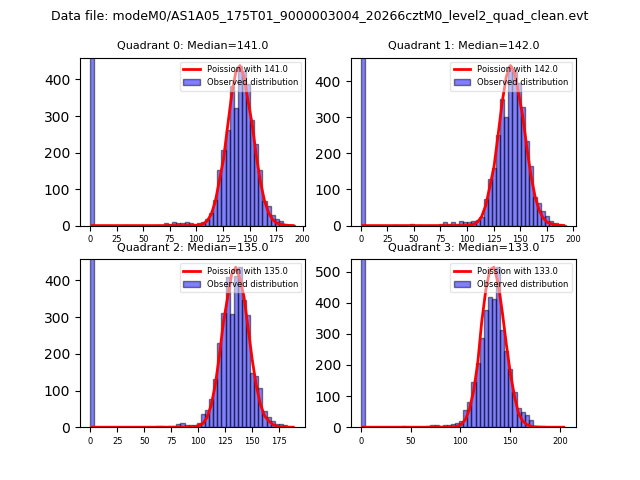 |
 |
| Quadrant-wise count rates Data is divided into 100 sec bins |
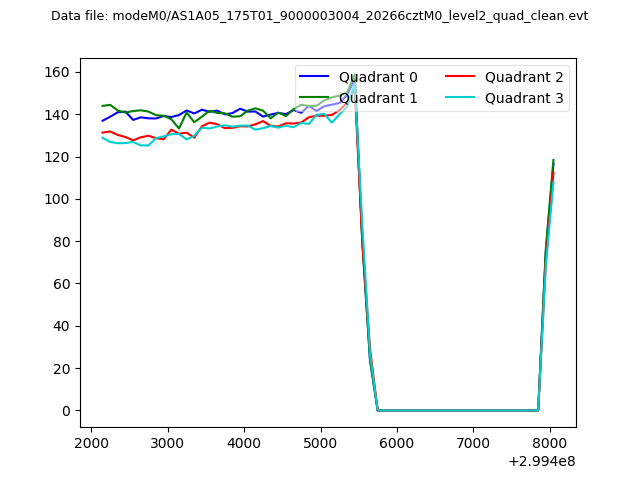 |
|
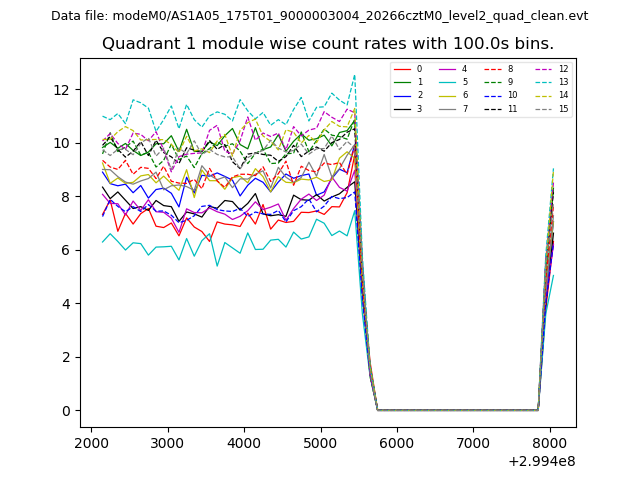
| Module-wise count rates for Quadrant A Data is divided into 100 sec bins |
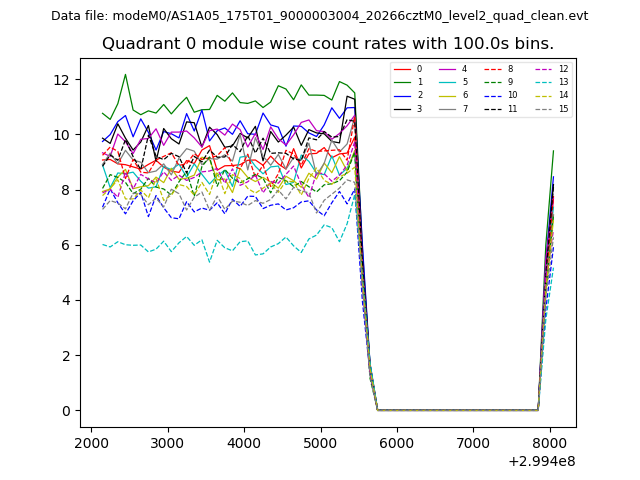 |
 |
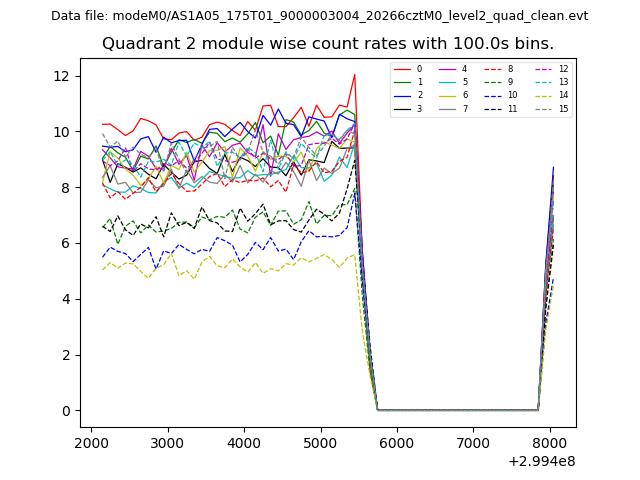
| Module-wise count rates for Quadrant B Data is divided into 100 sec bins |
 |
 |
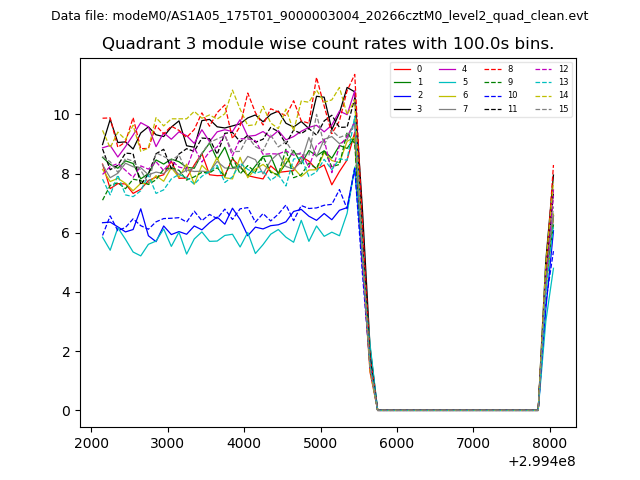
| Module-wise count rates for Quadrant C Data is divided into 100 sec bins |
 |
 |
| Module-wise count rates for Quadrant D Data is divided into 100 sec bins |
 |
 |
| Parameter | Plot |
|---|---|
| CZT HV Monitor | 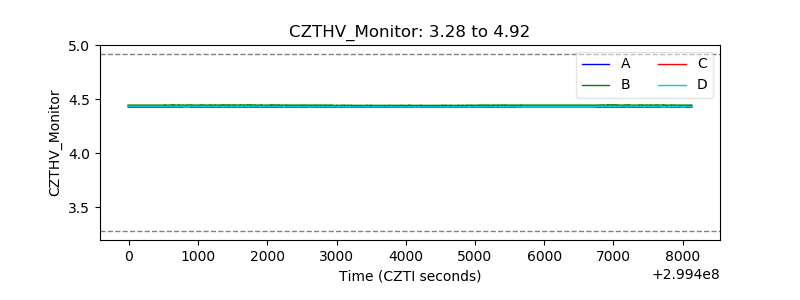 |
| D_VDD | 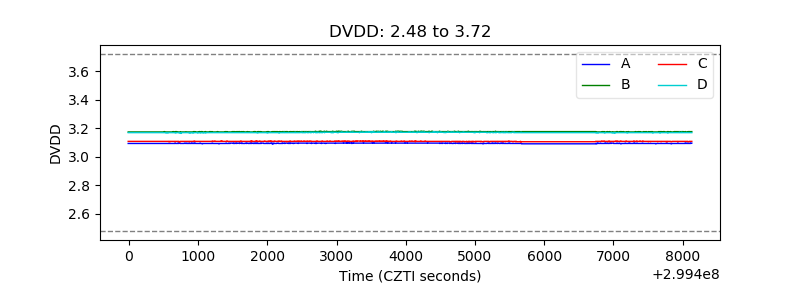 |
| Temperature 1 | 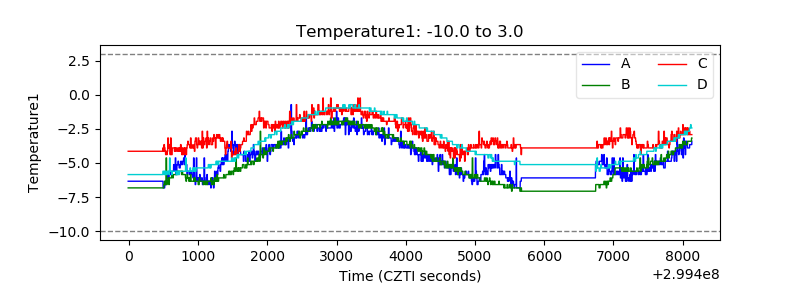 |
| Veto HV Monitor | 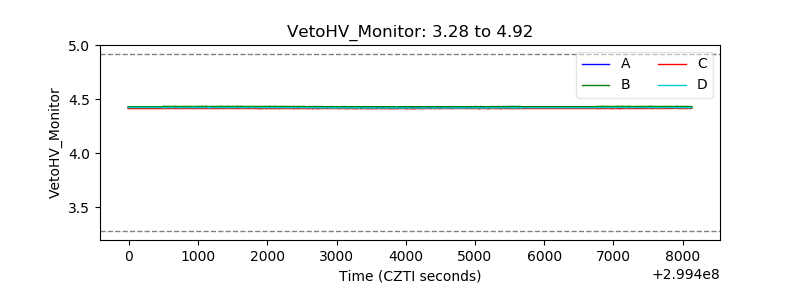 |
| Veto LLD | 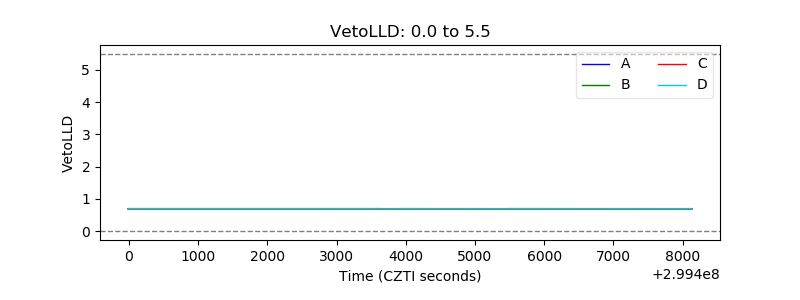 |
| Alpha Counter | 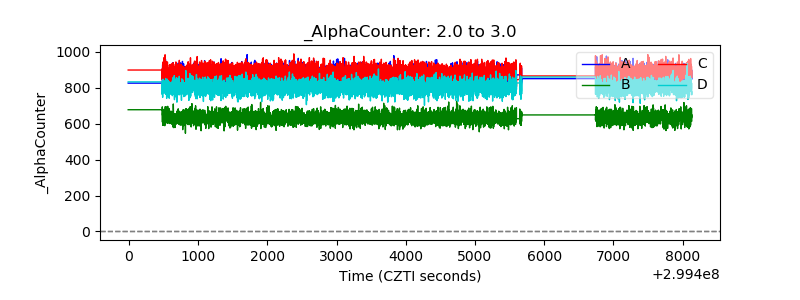 |
| _CPM_Rate | 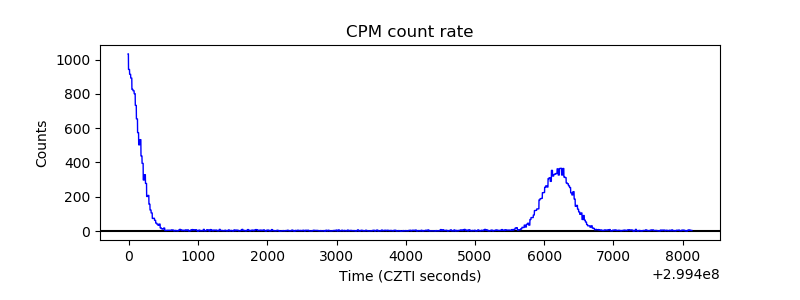 |
| CZT Counter | 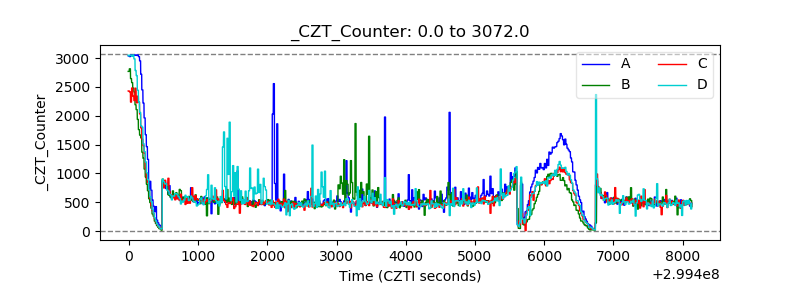 |
| +2.5 Volts monitor |  |
| +5 Volts monitor |  |
| _ROLL_ROT | 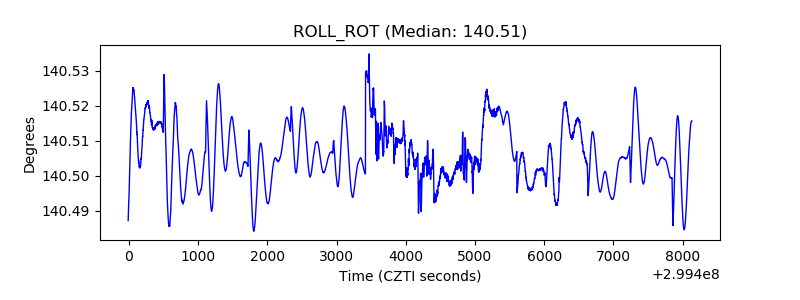 |
| _Roll_DEC | 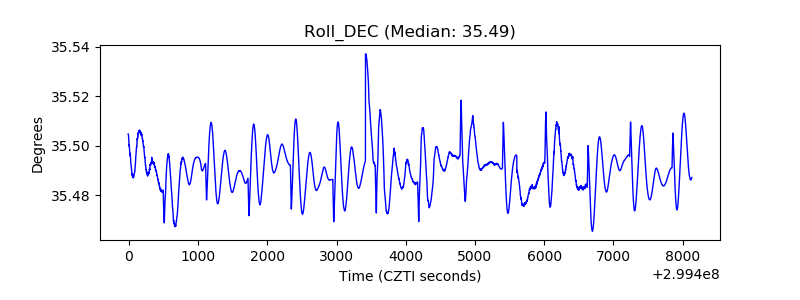 |
| _Roll_RA | 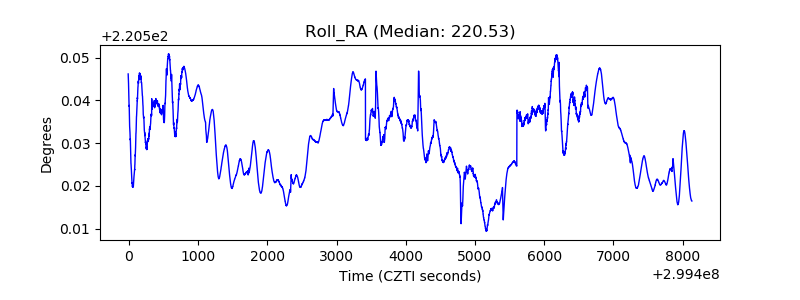 |
| Veto Counter | 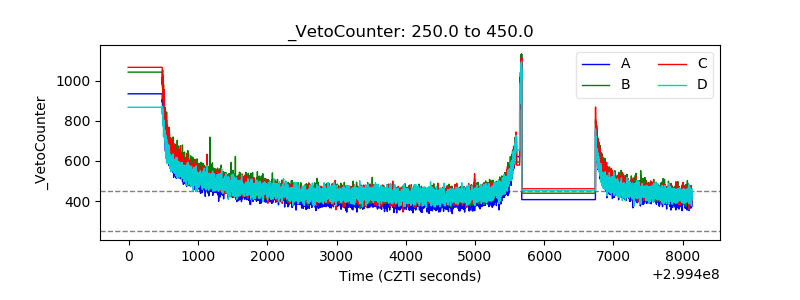 |