| Param | Original file | Final file |
|---|---|---|
| Filename | modeM0/AS1A05_175T01_9000003004_20267cztM0_level2.evt | modeM0/AS1A05_175T01_9000003004_20267cztM0_level2_quad_clean.evt |
| Size (bytes) | 523,604,160 | 95,022,720 |
| Size | 499.3 MB | 90.6 MB |
| Events in quadrant A | 4,275,210 | 604,462 |
| Events in quadrant B | 3,896,684 | 611,486 |
| Events in quadrant C | 3,451,513 | 585,982 |
| Events in quadrant D | 3,751,029 | 580,029 |
| Mode M0 | |||
|---|---|---|---|
| Quadrant | BADHDUFLAG | Total packets | Discarded packets |
| A | 0 | 17024 | 2 |
| B | 0 | 15869 | 2 |
| C | 0 | 14647 | 2 |
| D | 0 | 15757 | 2 |
| Mode SS | |||
|---|---|---|---|
| Quadrant | BADHDUFLAG | Total packets | Discarded packets |
| A | 0 | 144 | 0 |
| B | 0 | 144 | 0 |
| C | 0 | 144 | 0 |
| D | 0 | 144 | 0 |
| Mode M9 | |||
|---|---|---|---|
| Quadrant | BADHDUFLAG | Total packets | Discarded packets |
| A | 0 | 14 | 0 |
| B | 0 | 15 | 0 |
| C | 0 | 15 | 0 |
| D | 0 | 15 | 0 |
| Quadrant | Total seconds | Saturated seconds | Saturation percentage |
|---|---|---|---|
| A | 7117 | 251 | 3.526767% |
| B | 7117 | 175 | 2.458901% |
| C | 7117 | 115 | 1.615849% |
| D | 7117 | 108 | 1.517493% |
Noise dominated data is calculated using 1-second bins in cleaned event files. If a bin has >2000 counts, and if more than 50% of those come from <1% of pixels, then it is considered to be noise-dominated and hence unusable.
| Quadrant | # 1 sec bins | Bins with >0 counts | Bins with >2000 counts | High rate bins dominated by noise | Noise dominated (total time) | Noise dominated (detector-on time) | Marked lightcurve |
|---|---|---|---|---|---|---|---|
| A | 7932 | 7118 | 70 | 70 | 0.88% | 0.98% | 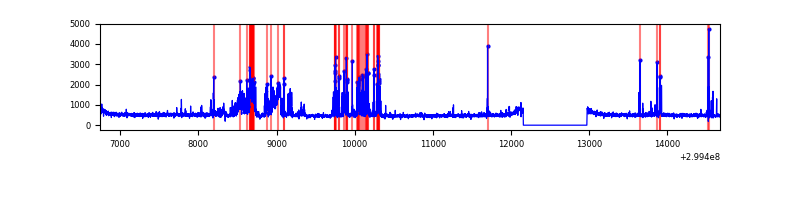 |
| B | 7932 | 7118 | 54 | 54 | 0.68% | 0.76% | 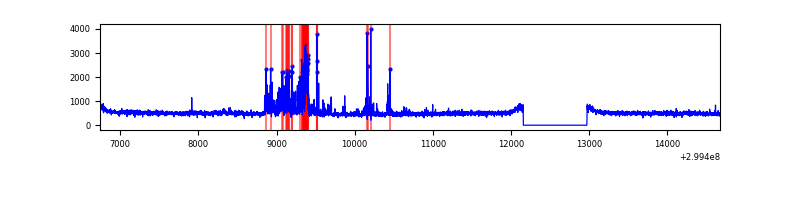 |
| C | 7932 | 7118 | 0 | 0 | 0.00% | 0.00% | 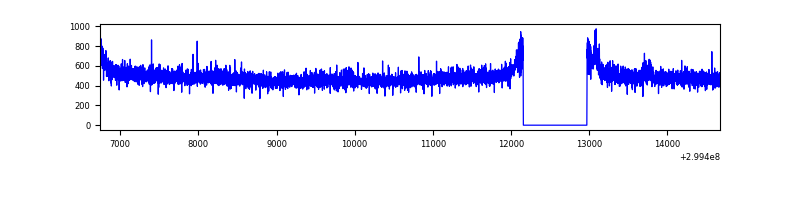 |
| D | 7932 | 7118 | 41 | 41 | 0.52% | 0.58% | 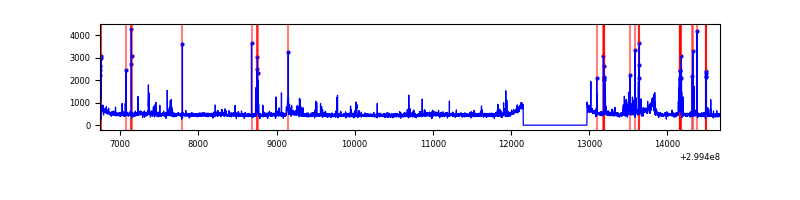 |
Top three noisy pixels from each quadrant. If the there are fewer than three noisy pixels in the level2.evt file, extra rows are filled as -1
| Pixel properties | Quadrant properties | ||||||
|---|---|---|---|---|---|---|---|
| Quadrant | DetID | PixID | Counts | Sigma | Mean | Median | Sigma |
| A | 14 | 238 | 735188 | 4119.14 | 885 | 866 | 178.3 |
| A | 14 | 254 | 55342 | 305.58 | 885 | 866 | 178.3 |
| A | 8 | 205 | 32639 | 178.23 | 885 | 866 | 178.3 |
| B | 4 | 142 | 229900 | 1365.8 | 882 | 859 | 167.7 |
| B | 7 | 220 | 154542 | 916.43 | 882 | 859 | 167.7 |
| B | 12 | 111 | 20465 | 116.91 | 882 | 859 | 167.7 |
| C | 14 | 238 | 134840 | 679.65 | 844 | 848 | 197.1 |
| C | 3 | 9 | 10297 | 47.93 | 844 | 848 | 197.1 |
| C | 0 | 207 | 10024 | 46.54 | 844 | 848 | 197.1 |
| D | 11 | 176 | 230067 | 1093.1 | 863 | 838 | 209.7 |
| D | 7 | 238 | 96701 | 457.13 | 863 | 838 | 209.7 |
| D | 1 | 52 | 85636 | 404.37 | 863 | 838 | 209.7 |
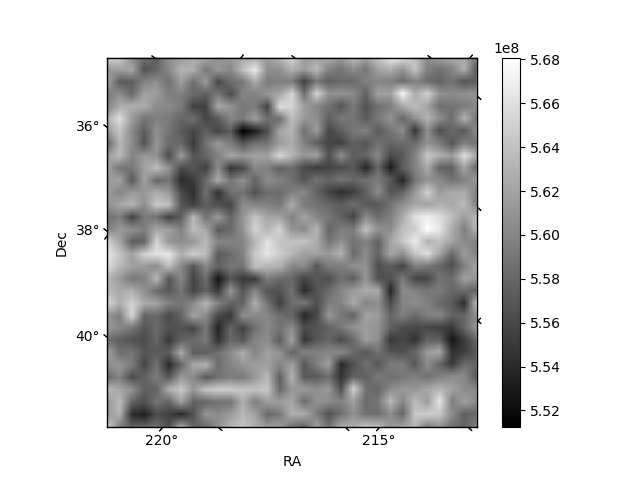
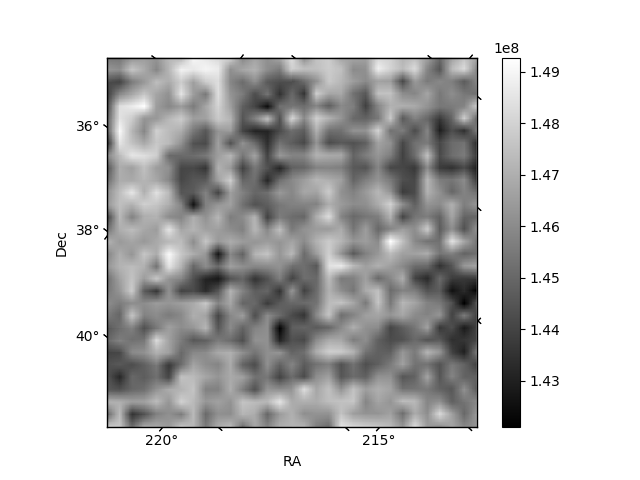
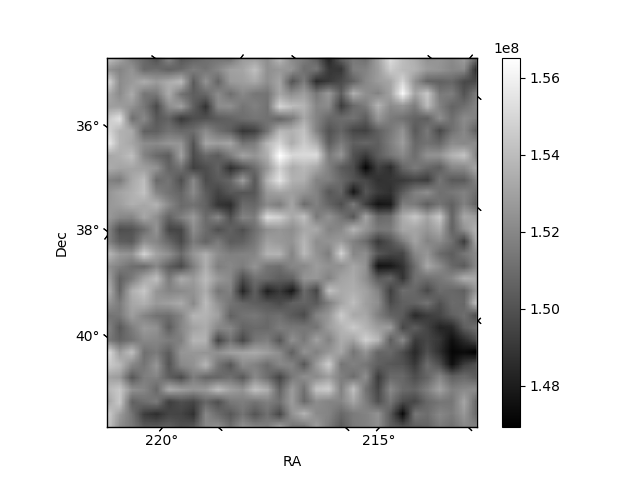
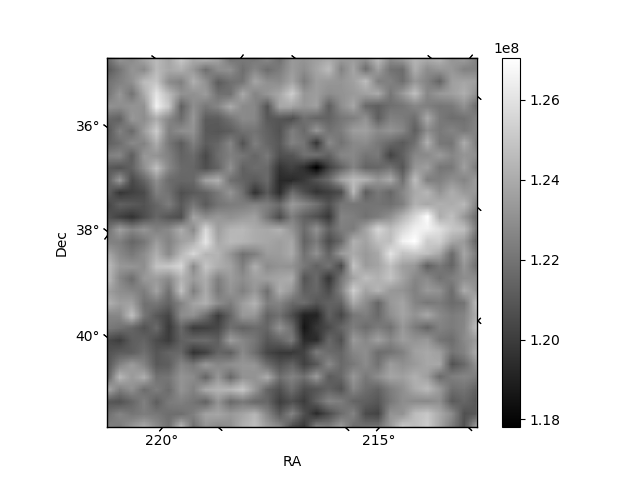
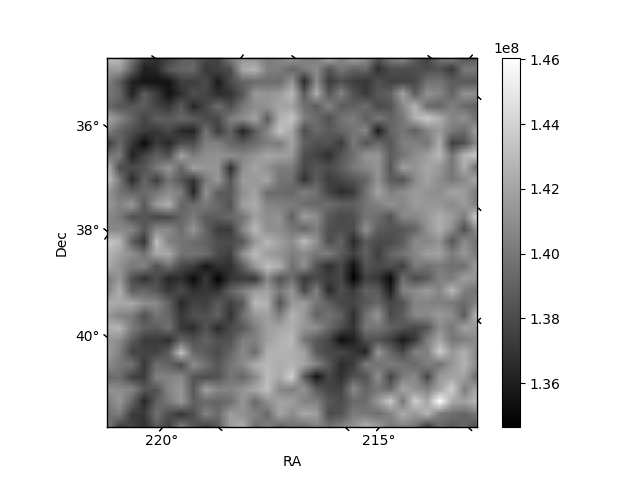
Histogram calculated using DETX and DETY for each event in the final _common_clean file
| Quadrant A | 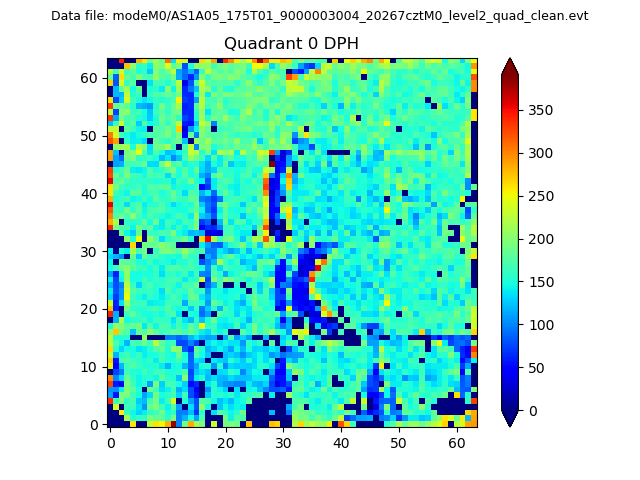 |
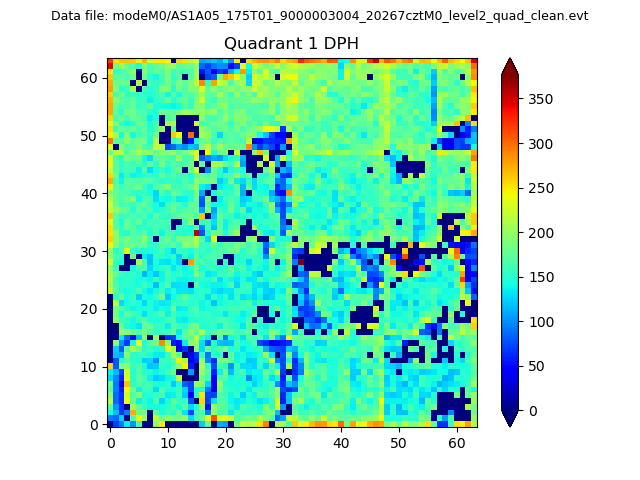 |
Quadrant B |
|---|---|---|---|
| Quadrant D | 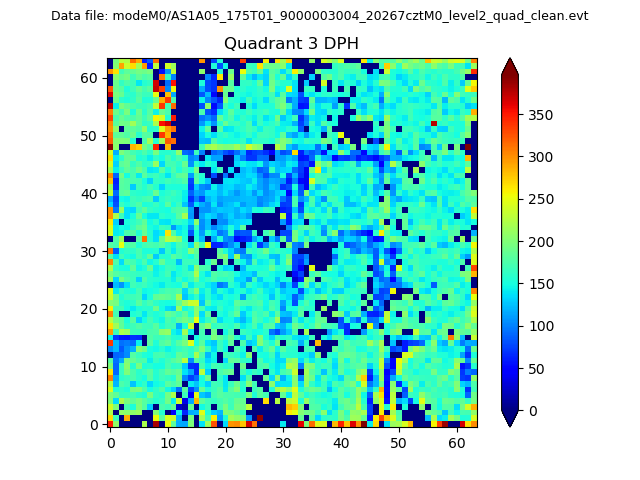 |
 |
Quadrant C |
| Plot type | Count rate plots | Images |
|---|---|---|
| Comparison with Poisson distribution Blue bars denote a histogram of data divided into 1 sec bins. Red curve is a Poisson curve with rate = median count rate of data. |
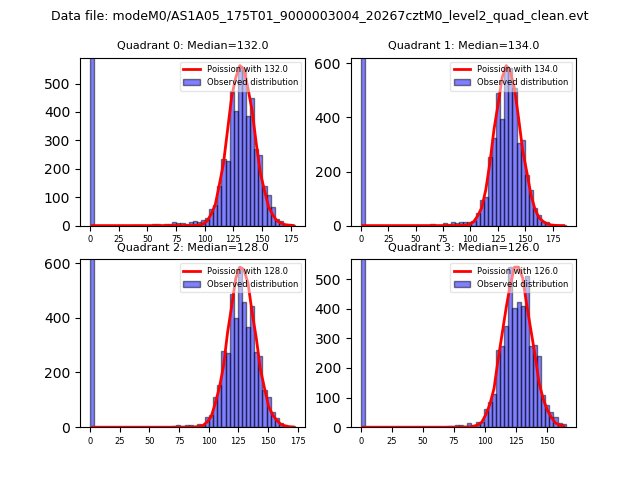 |
 |
| Quadrant-wise count rates Data is divided into 100 sec bins |
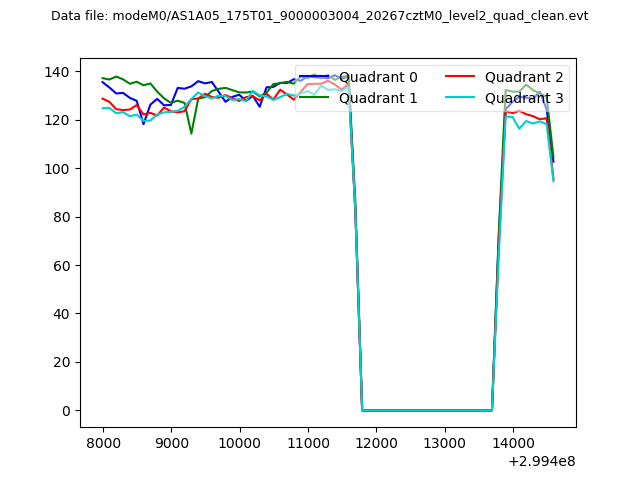 |
|
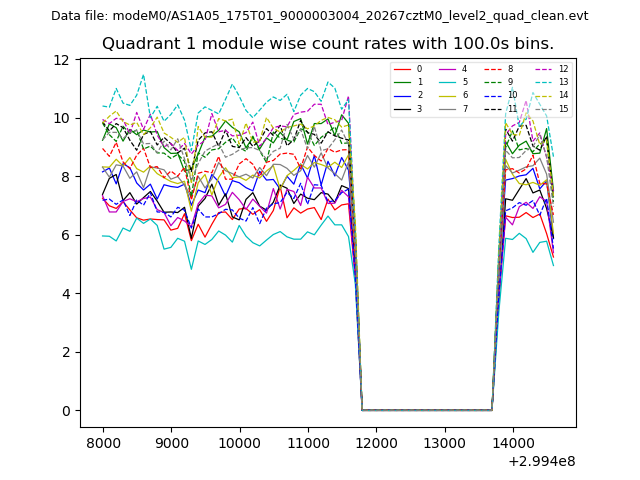
| Module-wise count rates for Quadrant A Data is divided into 100 sec bins |
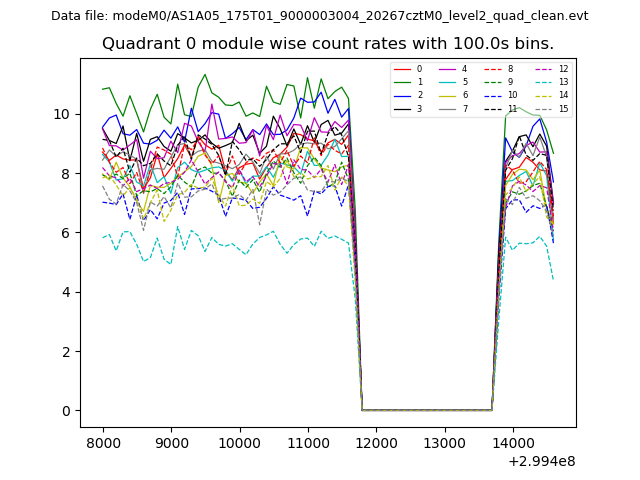 |
 |
| Module-wise count rates for Quadrant B Data is divided into 100 sec bins |
 |
 |
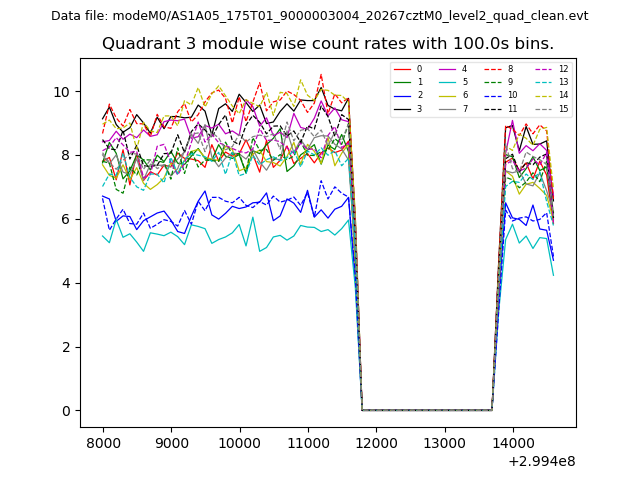
| Module-wise count rates for Quadrant C Data is divided into 100 sec bins |
 |
 |
| Module-wise count rates for Quadrant D Data is divided into 100 sec bins |
 |
 |
| Parameter | Plot |
|---|---|
| CZT HV Monitor | 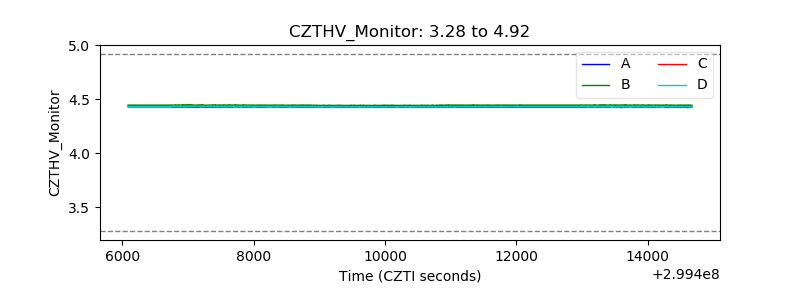 |
| D_VDD | 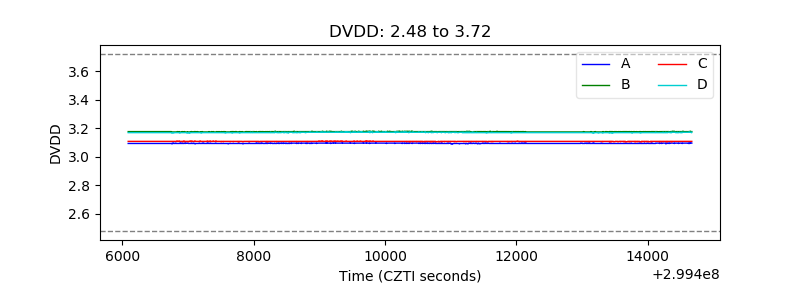 |
| Temperature 1 | 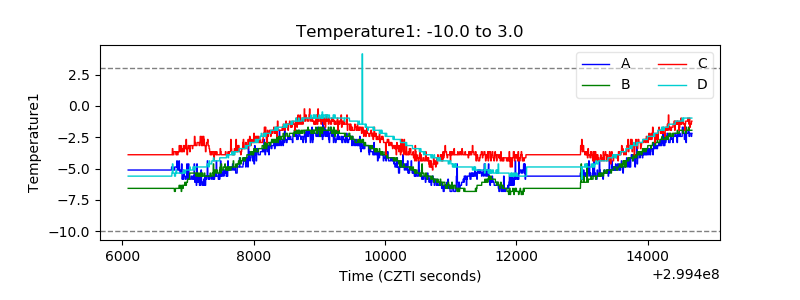 |
| Veto HV Monitor | 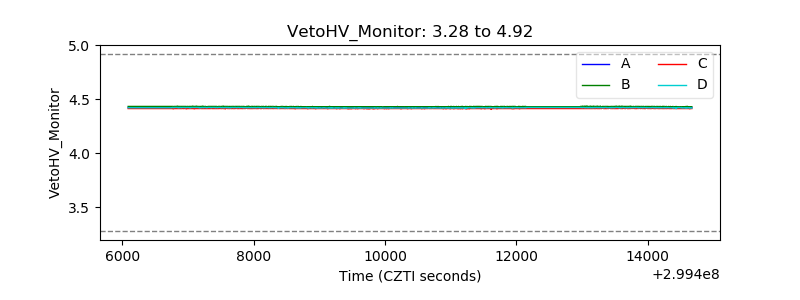 |
| Veto LLD | 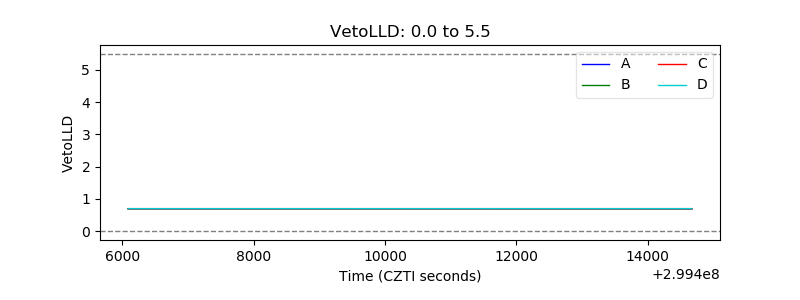 |
| Alpha Counter | 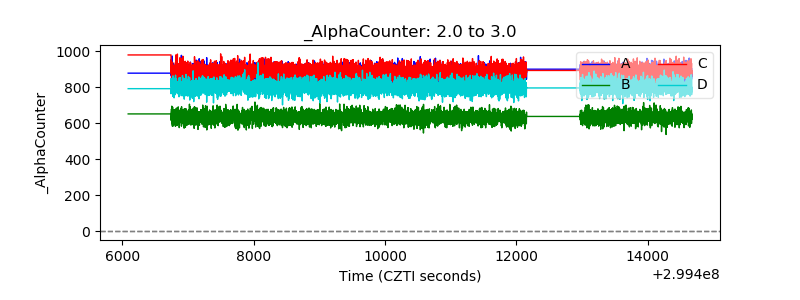 |
| _CPM_Rate | 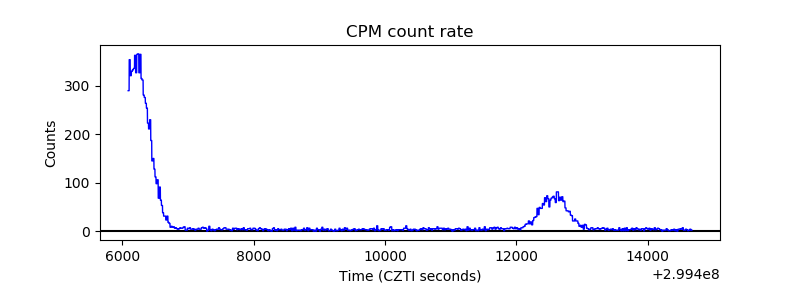 |
| CZT Counter |  |
| +2.5 Volts monitor |  |
| +5 Volts monitor |  |
| _ROLL_ROT | 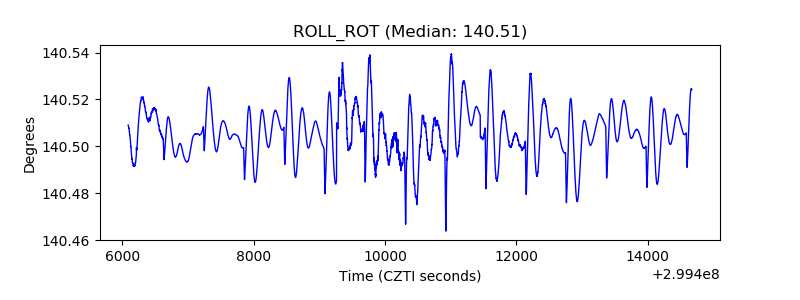 |
| _Roll_DEC | 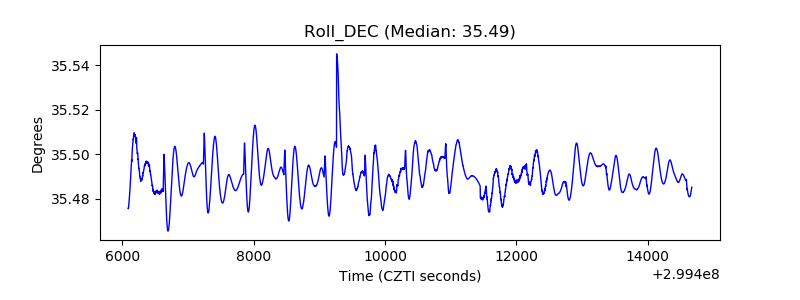 |
| _Roll_RA | 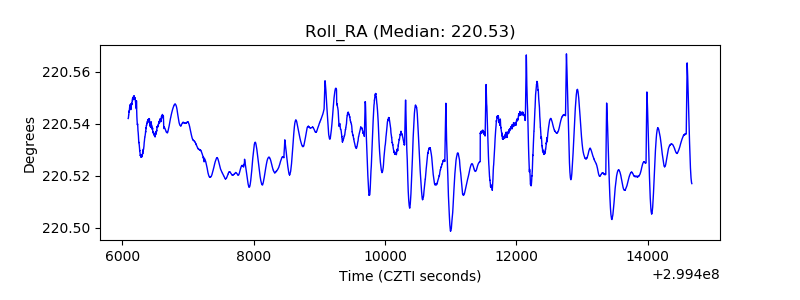 |
| Veto Counter | 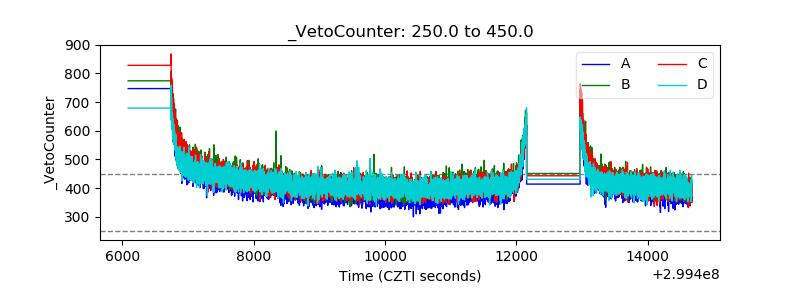 |