| Param | Original file | Final file |
|---|---|---|
| Filename | modeM0/AS1A05_175T01_9000003004_20268cztM0_level2.evt | modeM0/AS1A05_175T01_9000003004_20268cztM0_level2_quad_clean.evt |
| Size (bytes) | 537,416,640 | 98,700,480 |
| Size | 512.5 MB | 94.1 MB |
| Events in quadrant A | 4,161,006 | 626,503 |
| Events in quadrant B | 4,121,186 | 633,460 |
| Events in quadrant C | 3,569,814 | 608,471 |
| Events in quadrant D | 3,917,335 | 601,660 |
| Mode M0 | |||
|---|---|---|---|
| Quadrant | BADHDUFLAG | Total packets | Discarded packets |
| A | 0 | 17046 | 2 |
| B | 0 | 16893 | 2 |
| C | 0 | 15346 | 3 |
| D | 0 | 16580 | 2 |
| Mode SS | |||
|---|---|---|---|
| Quadrant | BADHDUFLAG | Total packets | Discarded packets |
| A | 0 | 150 | 0 |
| B | 0 | 150 | 0 |
| C | 0 | 150 | 0 |
| D | 0 | 150 | 0 |
| Mode M9 | |||
|---|---|---|---|
| Quadrant | BADHDUFLAG | Total packets | Discarded packets |
| A | 0 | 11 | 0 |
| B | 0 | 12 | 0 |
| C | 0 | 12 | 0 |
| D | 0 | 12 | 0 |
| Quadrant | Total seconds | Saturated seconds | Saturation percentage |
|---|---|---|---|
| A | 7461 | 259 | 3.471385% |
| B | 7461 | 218 | 2.921860% |
| C | 7460 | 130 | 1.742627% |
| D | 7460 | 127 | 1.702413% |
Noise dominated data is calculated using 1-second bins in cleaned event files. If a bin has >2000 counts, and if more than 50% of those come from <1% of pixels, then it is considered to be noise-dominated and hence unusable.
| Quadrant | # 1 sec bins | Bins with >0 counts | Bins with >2000 counts | High rate bins dominated by noise | Noise dominated (total time) | Noise dominated (detector-on time) | Marked lightcurve |
|---|---|---|---|---|---|---|---|
| A | 7891 | 7462 | 97 | 97 | 1.23% | 1.30% | 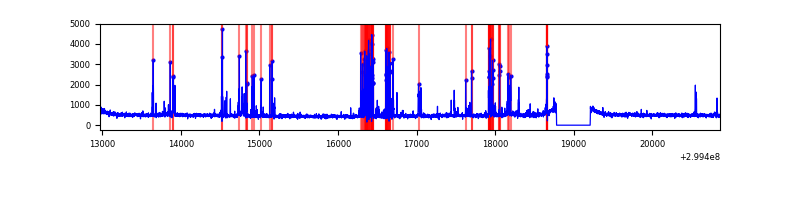 |
| B | 7891 | 7462 | 77 | 77 | 0.98% | 1.03% | 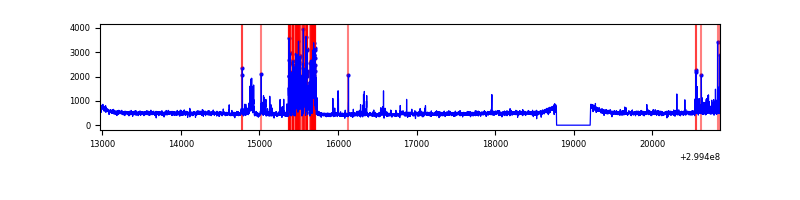 |
| C | 7890 | 7461 | 0 | 0 | 0.00% | 0.00% | 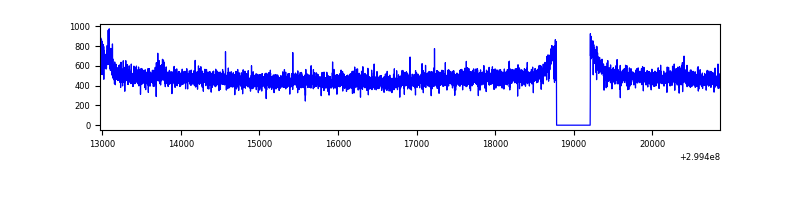 |
| D | 7890 | 7461 | 32 | 32 | 0.41% | 0.43% | 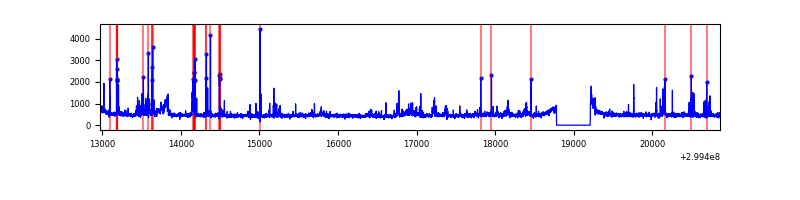 |
Top three noisy pixels from each quadrant. If the there are fewer than three noisy pixels in the level2.evt file, extra rows are filled as -1
| Pixel properties | Quadrant properties | ||||||
|---|---|---|---|---|---|---|---|
| Quadrant | DetID | PixID | Counts | Sigma | Mean | Median | Sigma |
| A | 14 | 238 | 433362 | 2350.78 | 908 | 887 | 184.0 |
| A | 4 | 2 | 125185 | 675.64 | 908 | 887 | 184.0 |
| A | 14 | 254 | 34502 | 182.72 | 908 | 887 | 184.0 |
| B | 4 | 142 | 354140 | 2065.54 | 906 | 883 | 171.0 |
| B | 7 | 220 | 134185 | 779.44 | 906 | 883 | 171.0 |
| B | 12 | 111 | 21319 | 119.49 | 906 | 883 | 171.0 |
| C | 14 | 238 | 136903 | 665.43 | 873 | 876 | 204.4 |
| C | 0 | 207 | 10870 | 48.89 | 873 | 876 | 204.4 |
| C | 3 | 9 | 10099 | 45.12 | 873 | 876 | 204.4 |
| D | 1 | 52 | 214512 | 980.68 | 890 | 863 | 217.9 |
| D | 11 | 176 | 147606 | 673.57 | 890 | 863 | 217.9 |
| D | 7 | 238 | 96669 | 439.76 | 890 | 863 | 217.9 |
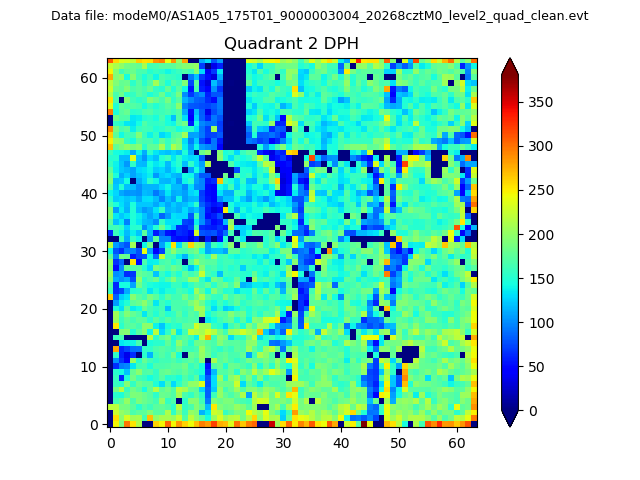
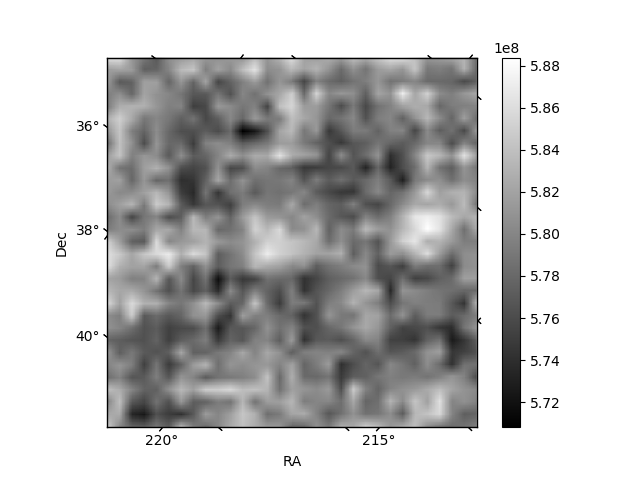
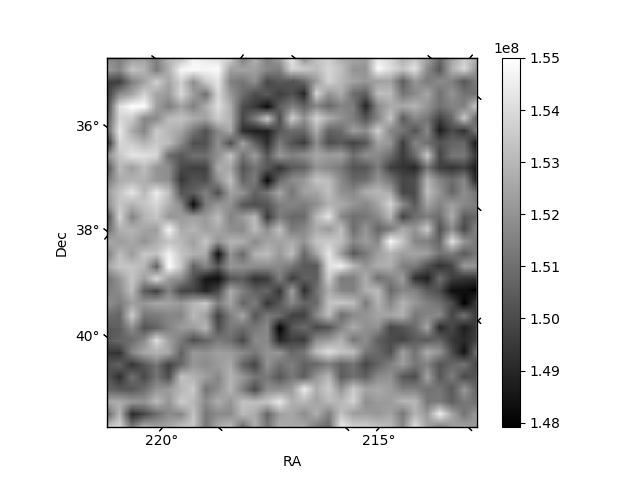
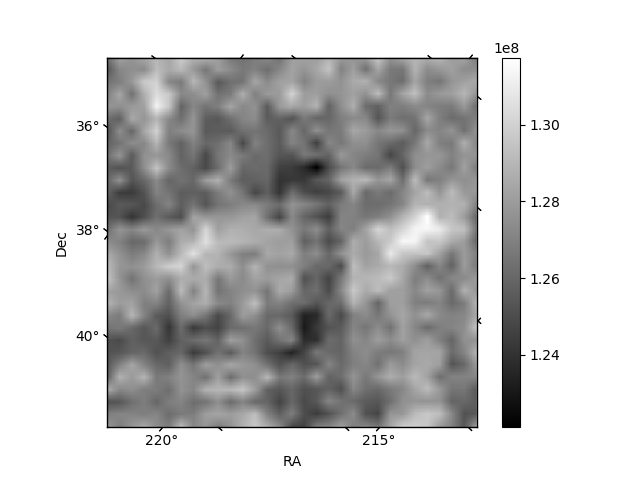
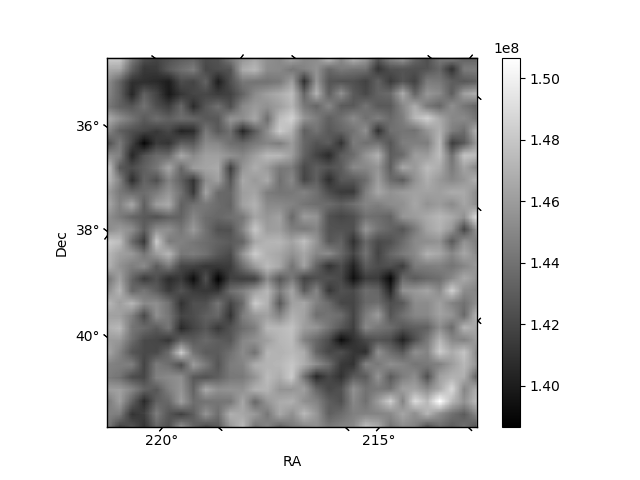
Histogram calculated using DETX and DETY for each event in the final _common_clean file
| Quadrant A | 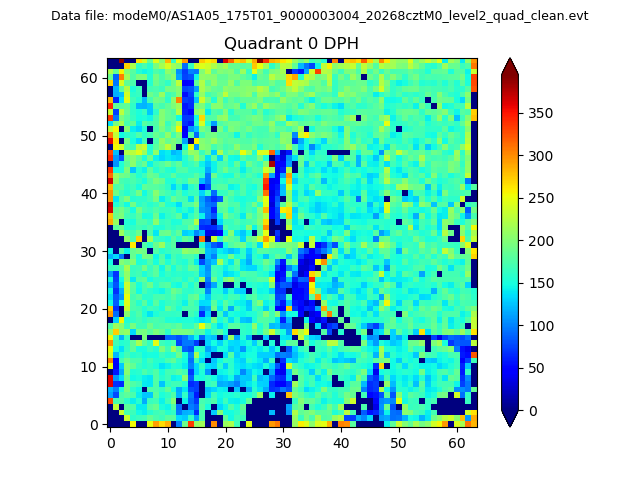 |
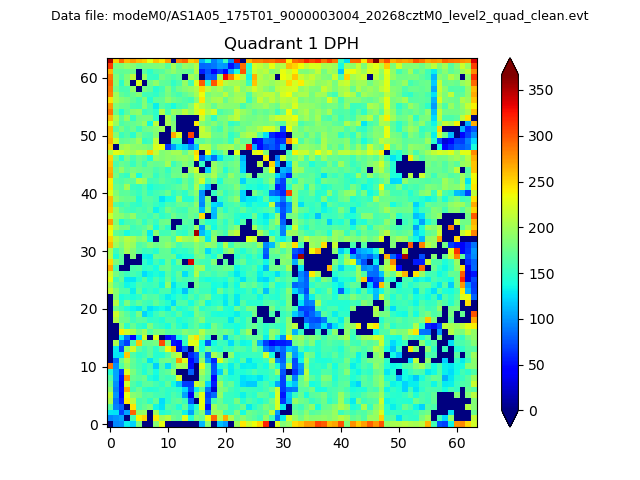 |
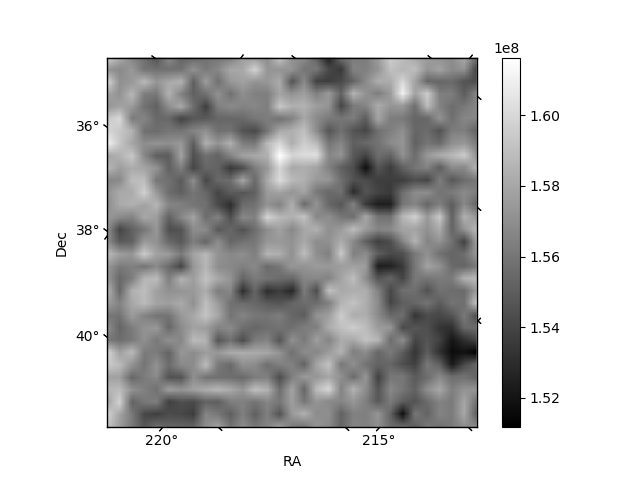
Quadrant B |
|---|---|---|---|
| Quadrant D | 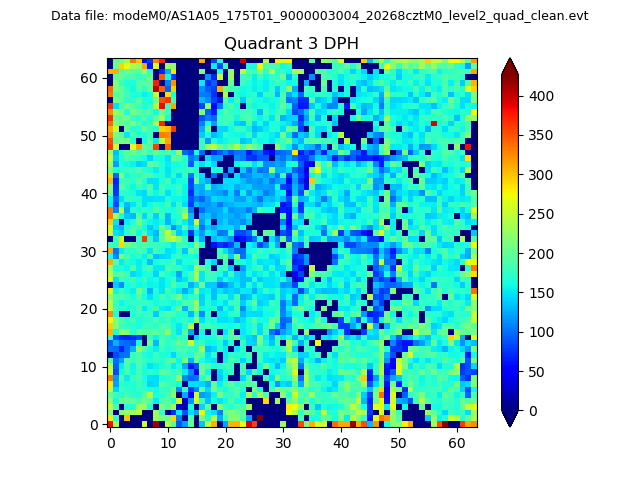 |
 |
Quadrant C |
| Plot type | Count rate plots | Images |
|---|---|---|
| Comparison with Poisson distribution Blue bars denote a histogram of data divided into 1 sec bins. Red curve is a Poisson curve with rate = median count rate of data. |
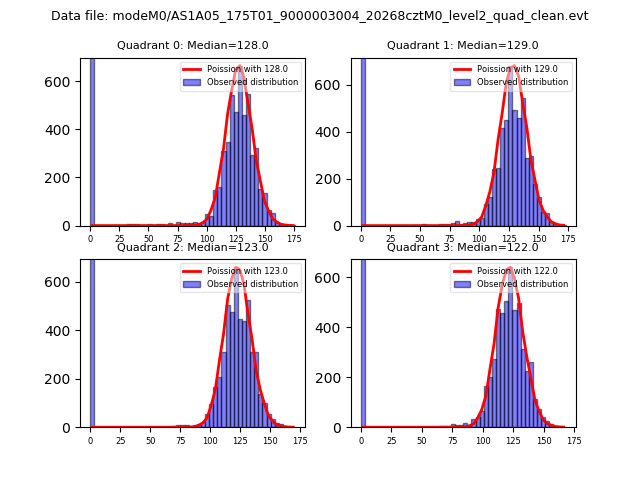 |
 |
| Quadrant-wise count rates Data is divided into 100 sec bins |
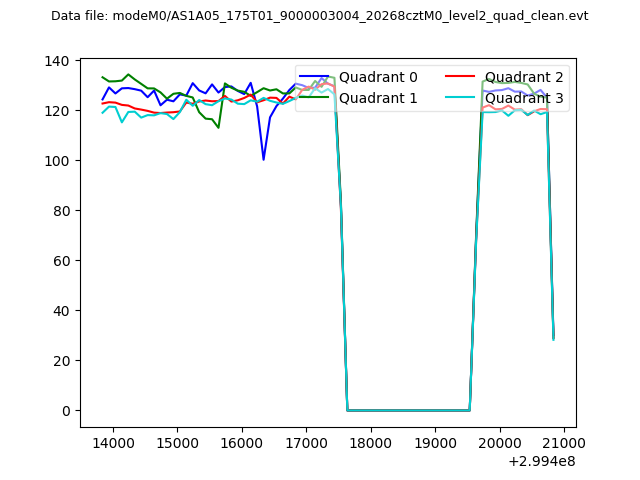 |
|
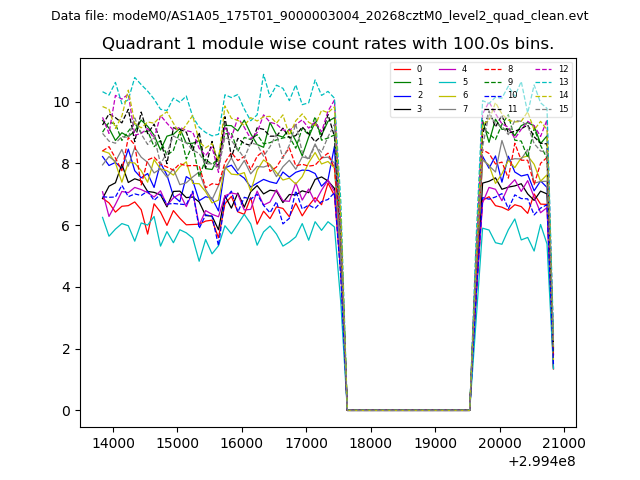
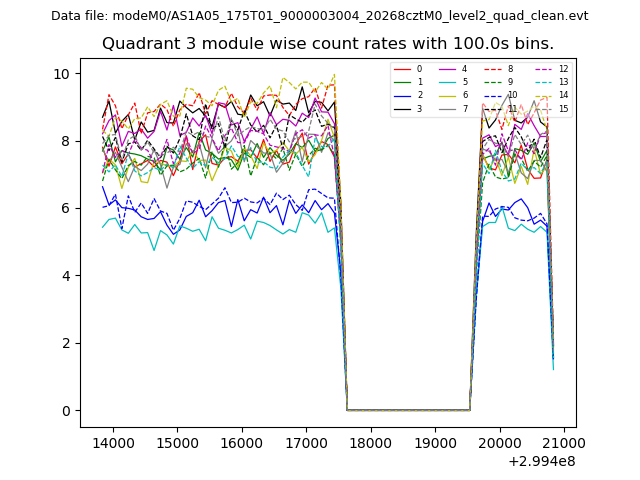
| Module-wise count rates for Quadrant A Data is divided into 100 sec bins |
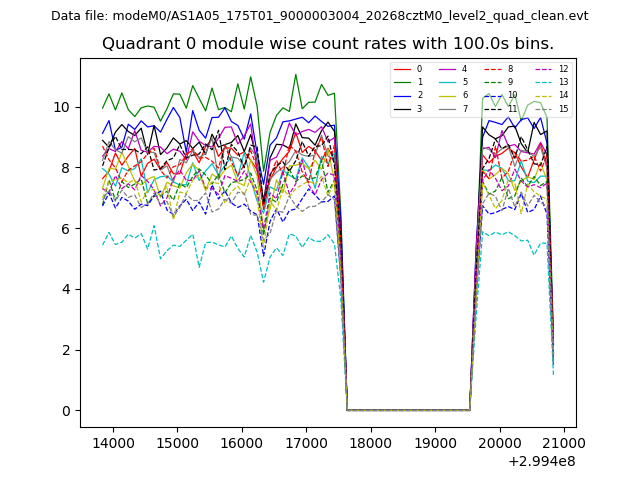 |
 |
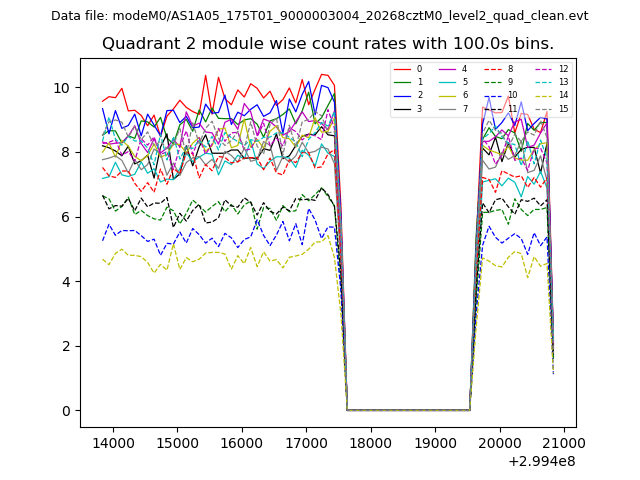
| Module-wise count rates for Quadrant B Data is divided into 100 sec bins |
 |
 |
| Module-wise count rates for Quadrant C Data is divided into 100 sec bins |
 |
 |
| Module-wise count rates for Quadrant D Data is divided into 100 sec bins |
 |
 |
| Parameter | Plot |
|---|---|
| CZT HV Monitor | 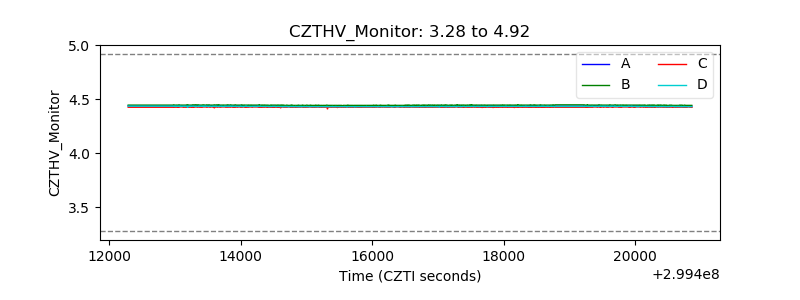 |
| D_VDD | 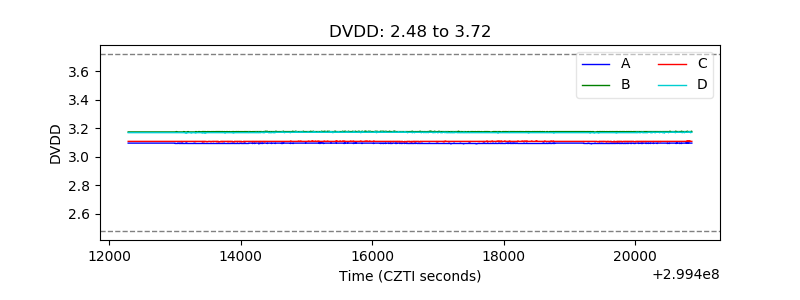 |
| Temperature 1 | 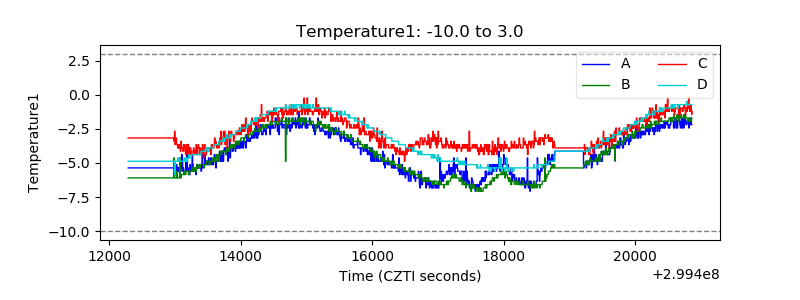 |
| Veto HV Monitor | 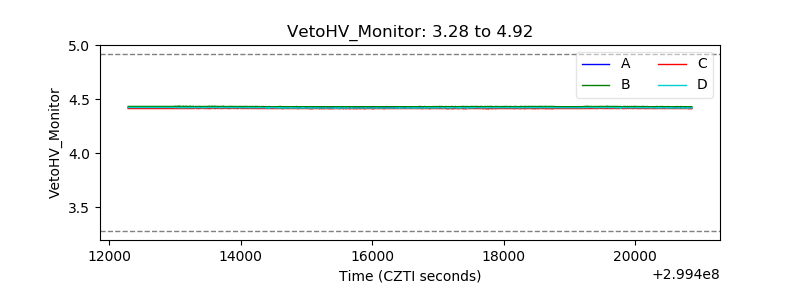 |
| Veto LLD | 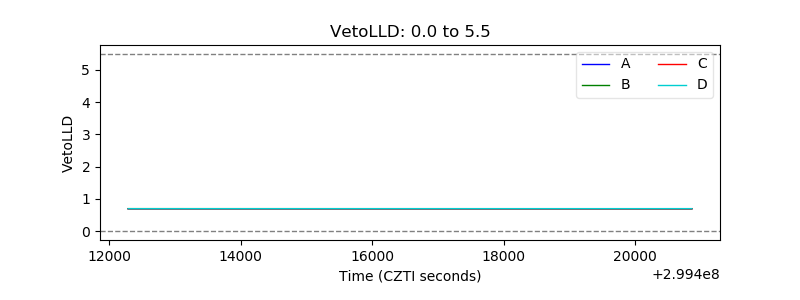 |
| Alpha Counter | 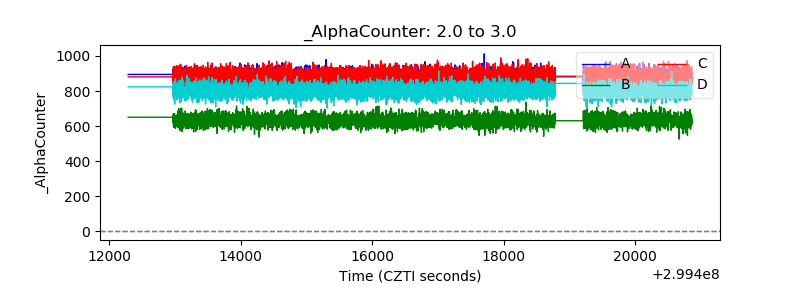 |
| _CPM_Rate | 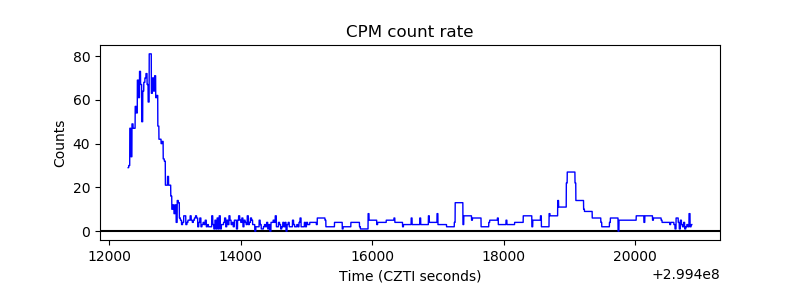 |
| CZT Counter | 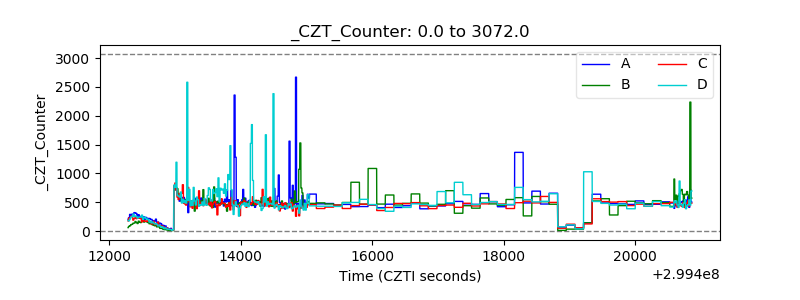 |
| +2.5 Volts monitor |  |
| +5 Volts monitor |  |
| _ROLL_ROT | 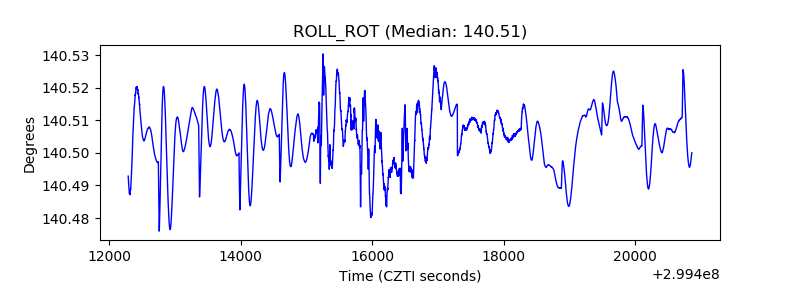 |
| _Roll_DEC | 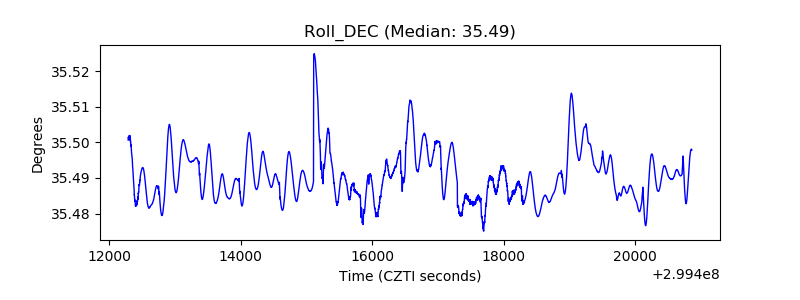 |
| _Roll_RA | 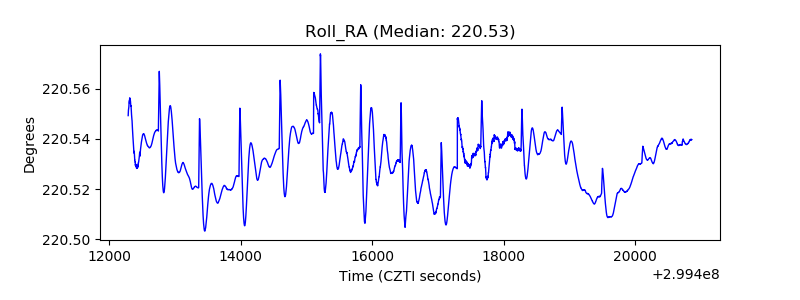 |
| Veto Counter | 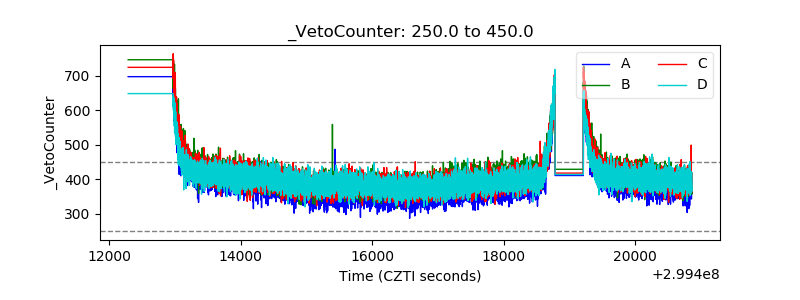 |