| Param | Original file | Final file |
|---|---|---|
| Filename | modeM0/AS1A05_175T01_9000003004_20269cztM0_level2.evt | modeM0/AS1A05_175T01_9000003004_20269cztM0_level2_quad_clean.evt |
| Size (bytes) | 1,711,454,400 | 329,351,040 |
| Size | 1.6 GB | 314.1 MB |
| Events in quadrant A | 13,060,512 | 2,136,589 |
| Events in quadrant B | 13,687,429 | 2,133,186 |
| Events in quadrant C | 11,264,190 | 2,063,671 |
| Events in quadrant D | 12,249,789 | 2,042,806 |
| Mode M0 | |||
|---|---|---|---|
| Quadrant | BADHDUFLAG | Total packets | Discarded packets |
| A | 0 | 53275 | 4 |
| B | 0 | 55046 | 4 |
| C | 0 | 48039 | 4 |
| D | 0 | 51679 | 5 |
| Mode SS | |||
|---|---|---|---|
| Quadrant | BADHDUFLAG | Total packets | Discarded packets |
| A | 0 | 470 | 0 |
| B | 0 | 470 | 0 |
| C | 0 | 470 | 0 |
| D | 0 | 470 | 0 |
| Mode M9 | |||
|---|---|---|---|
| Quadrant | BADHDUFLAG | Total packets | Discarded packets |
| A | 0 | 27 | 0 |
| B | 0 | 27 | 0 |
| C | 0 | 27 | 0 |
| D | 0 | 27 | 0 |
| Quadrant | Total seconds | Saturated seconds | Saturation percentage |
|---|---|---|---|
| A | 23252 | 758 | 3.259935% |
| B | 23253 | 959 | 4.124199% |
| C | 23253 | 463 | 1.991141% |
| D | 23252 | 439 | 1.888010% |
Noise dominated data is calculated using 1-second bins in cleaned event files. If a bin has >2000 counts, and if more than 50% of those come from <1% of pixels, then it is considered to be noise-dominated and hence unusable.
| Quadrant | # 1 sec bins | Bins with >0 counts | Bins with >2000 counts | High rate bins dominated by noise | Noise dominated (total time) | Noise dominated (detector-on time) | Marked lightcurve |
|---|---|---|---|---|---|---|---|
| A | 25877 | 23256 | 223 | 223 | 0.86% | 0.96% | 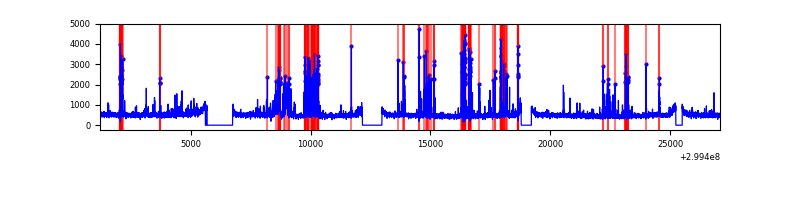 |
| B | 25878 | 23257 | 425 | 425 | 1.64% | 1.83% | 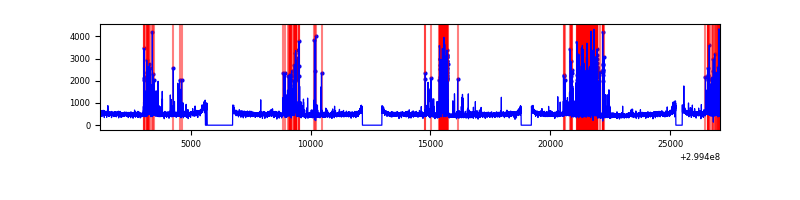 |
| C | 25878 | 23258 | 0 | 0 | 0.00% | 0.00% | 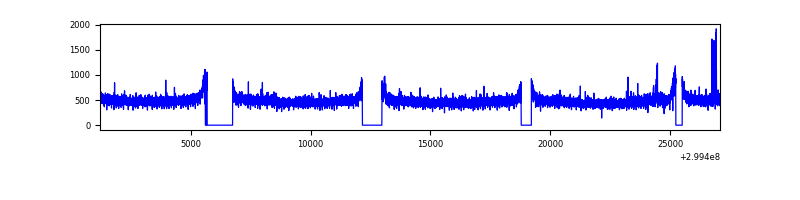 |
| D | 25877 | 23257 | 131 | 131 | 0.51% | 0.56% | 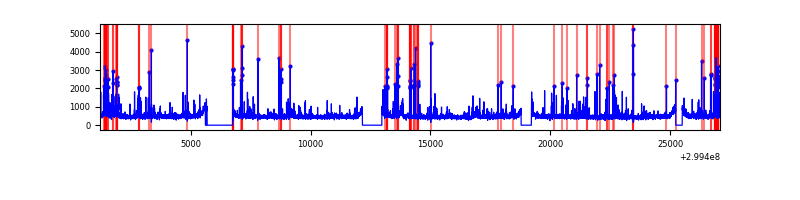 |
Top three noisy pixels from each quadrant. If the there are fewer than three noisy pixels in the level2.evt file, extra rows are filled as -1
| Pixel properties | Quadrant properties | ||||||
|---|---|---|---|---|---|---|---|
| Quadrant | DetID | PixID | Counts | Sigma | Mean | Median | Sigma |
| A | 14 | 238 | 1409669 | 2453.82 | 2863 | 2801 | 573.3 |
| A | 4 | 2 | 170609 | 292.69 | 2863 | 2801 | 573.3 |
| A | 10 | 253 | 163996 | 281.15 | 2863 | 2801 | 573.3 |
| B | 4 | 142 | 1597420 | 2993.31 | 2841 | 2767 | 532.7 |
| B | 7 | 220 | 629053 | 1175.6 | 2841 | 2767 | 532.7 |
| B | 0 | 244 | 84284 | 153.01 | 2841 | 2767 | 532.7 |
| C | 14 | 238 | 431200 | 672.61 | 2748 | 2768 | 637.0 |
| C | 9 | 221 | 65072 | 97.81 | 2748 | 2768 | 637.0 |
| C | 3 | 233 | 23950 | 33.25 | 2748 | 2768 | 637.0 |
| D | 1 | 52 | 521682 | 769.27 | 2807 | 2733 | 674.6 |
| D | 11 | 176 | 452471 | 666.67 | 2807 | 2733 | 674.6 |
| D | 7 | 238 | 372073 | 547.49 | 2807 | 2733 | 674.6 |
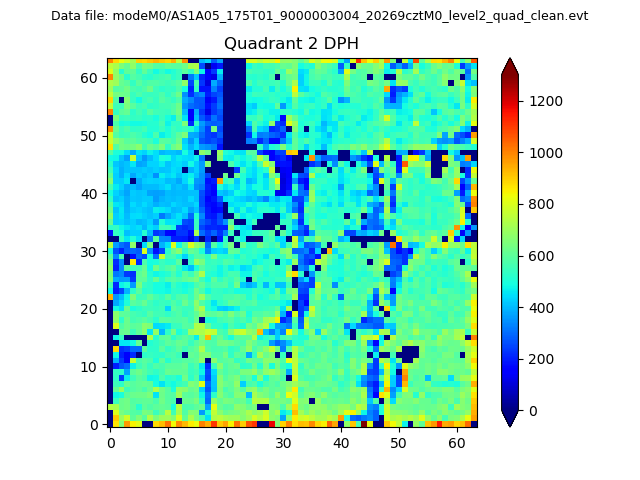
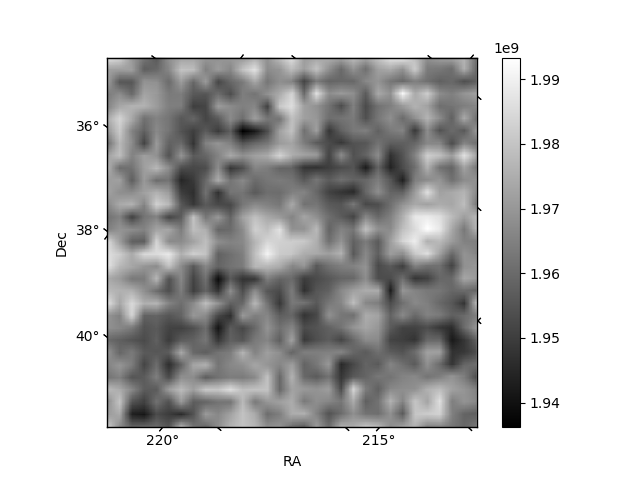
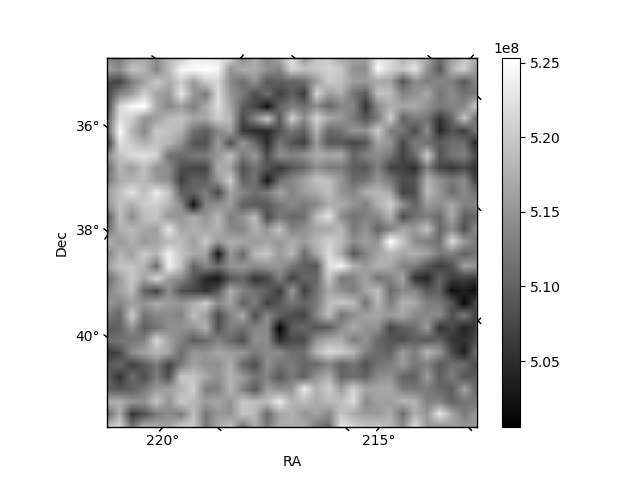
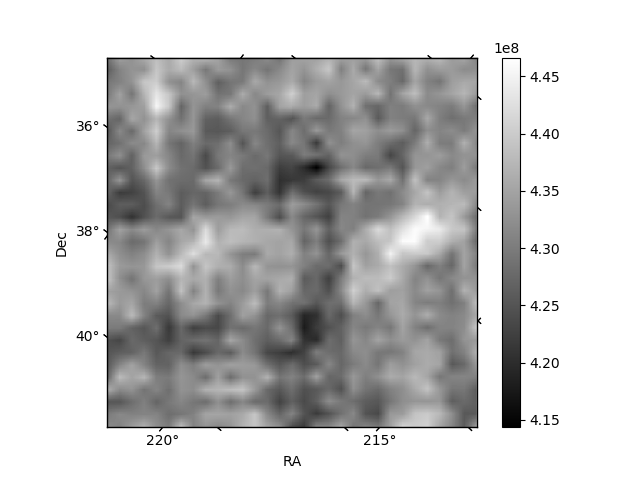
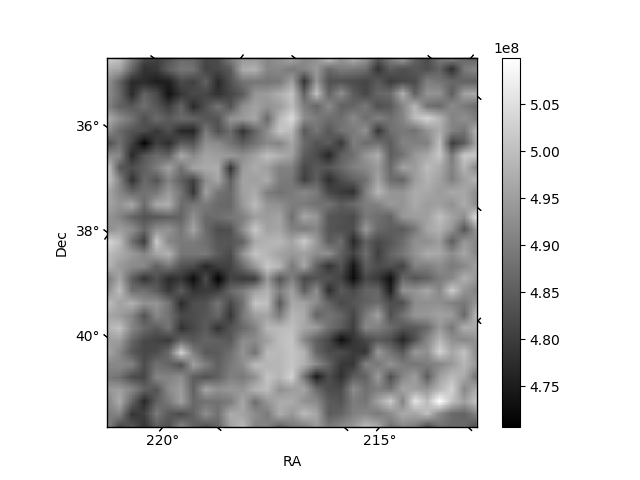
Histogram calculated using DETX and DETY for each event in the final _common_clean file
| Quadrant A | 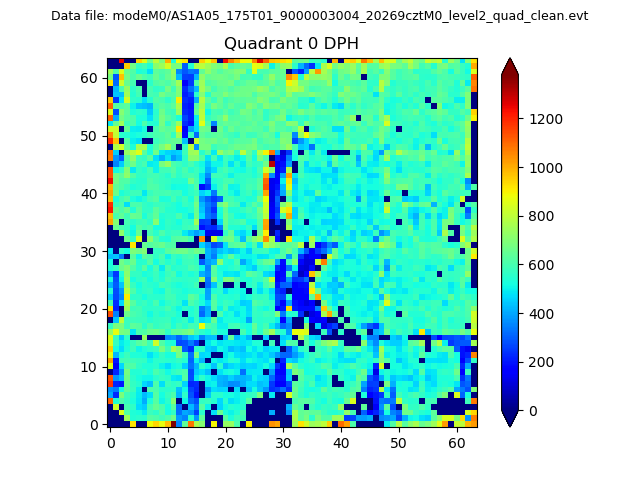 |
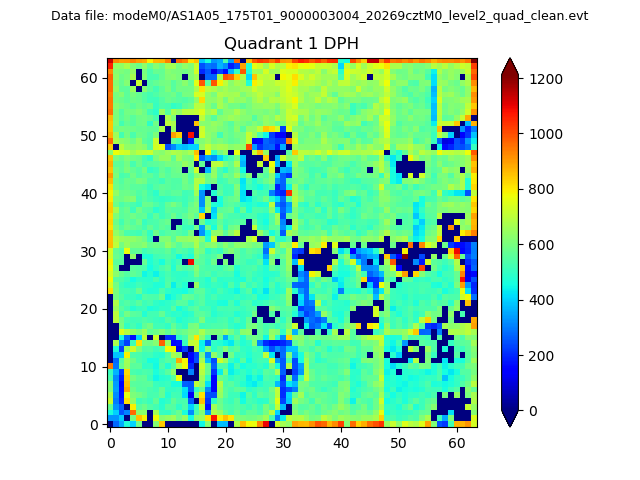 |
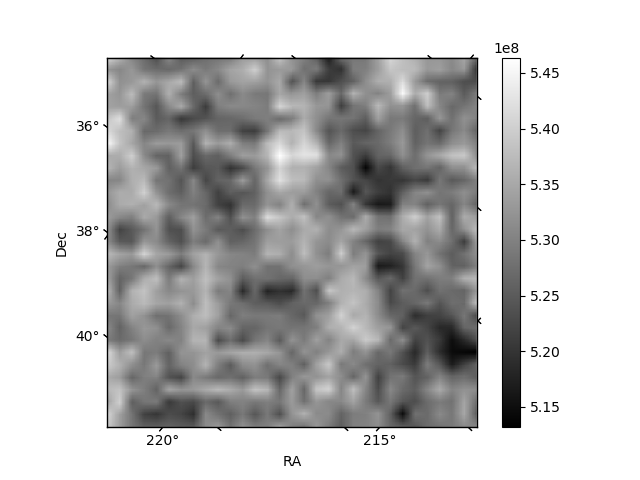
Quadrant B |
|---|---|---|---|
| Quadrant D | 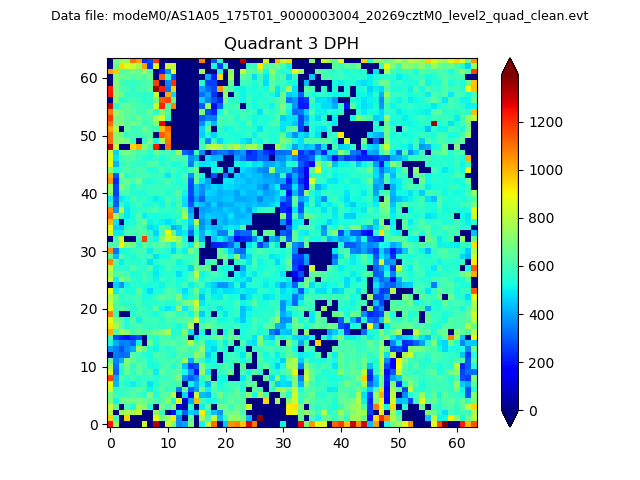 |
 |
Quadrant C |
| Plot type | Count rate plots | Images |
|---|---|---|
| Comparison with Poisson distribution Blue bars denote a histogram of data divided into 1 sec bins. Red curve is a Poisson curve with rate = median count rate of data. |
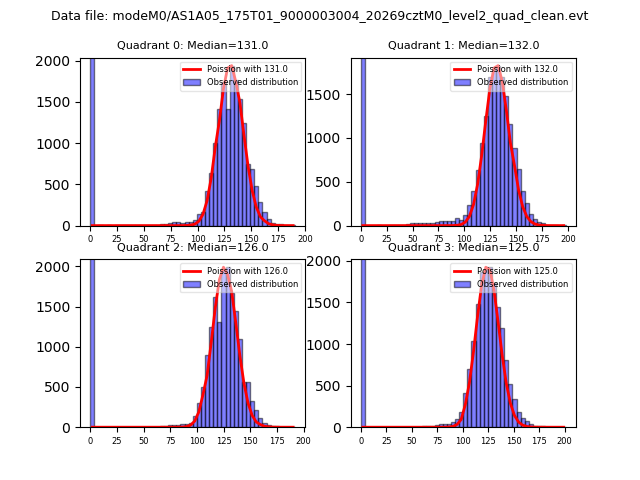 |
 |
| Quadrant-wise count rates Data is divided into 100 sec bins |
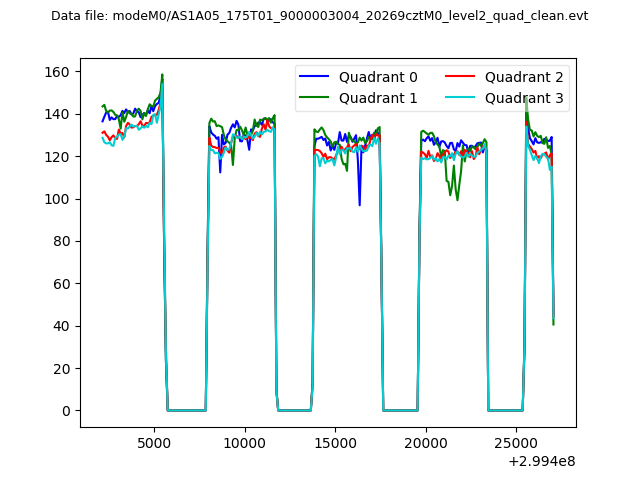 |
|
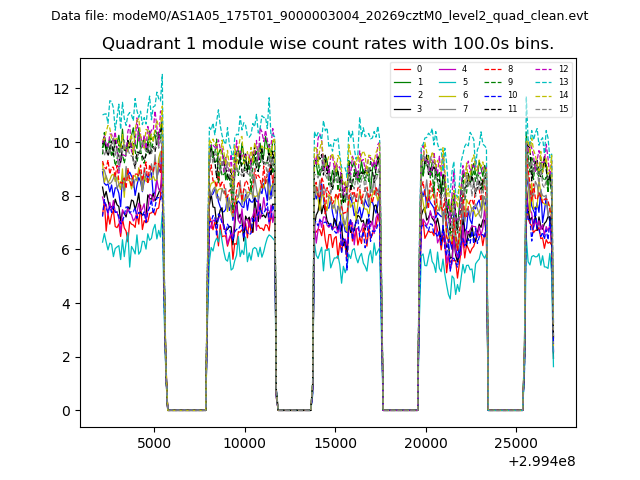
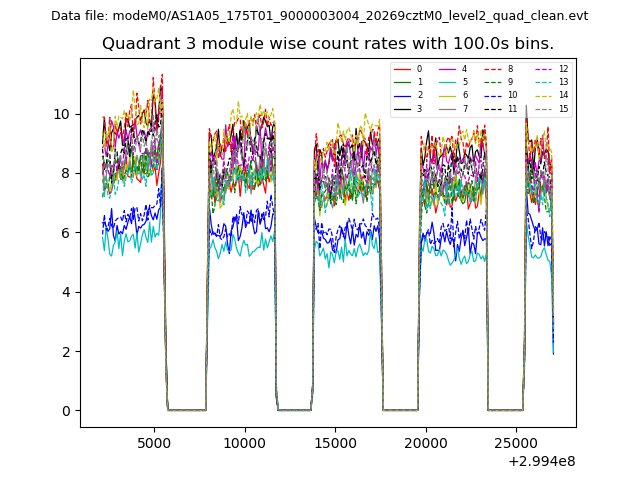
| Module-wise count rates for Quadrant A Data is divided into 100 sec bins |
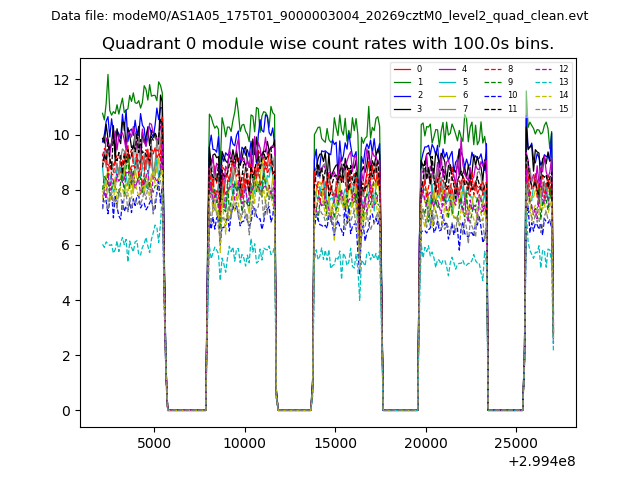 |
 |
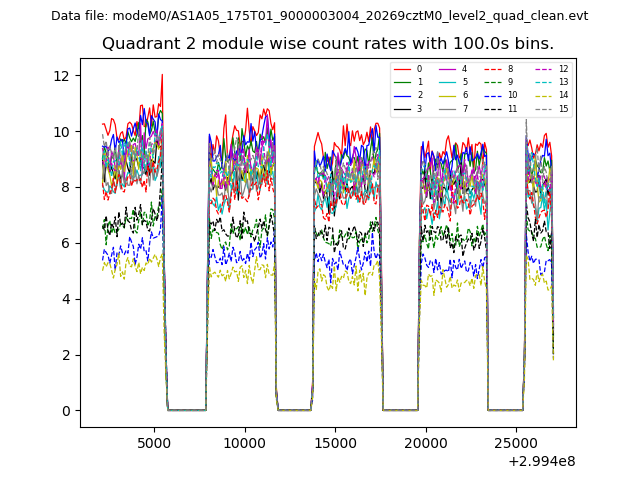
| Module-wise count rates for Quadrant B Data is divided into 100 sec bins |
 |
 |
| Module-wise count rates for Quadrant C Data is divided into 100 sec bins |
 |
 |
| Module-wise count rates for Quadrant D Data is divided into 100 sec bins |
 |
 |
| Parameter | Plot |
|---|---|
| CZT HV Monitor | 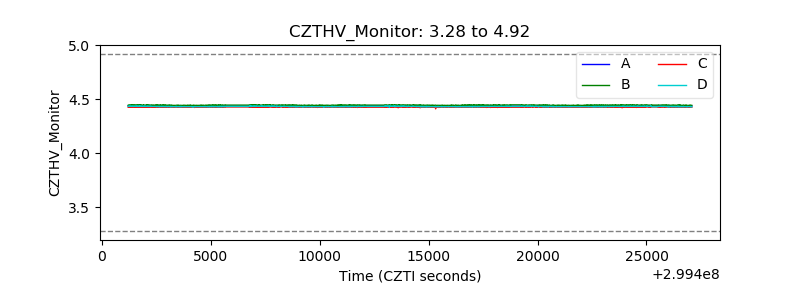 |
| D_VDD | 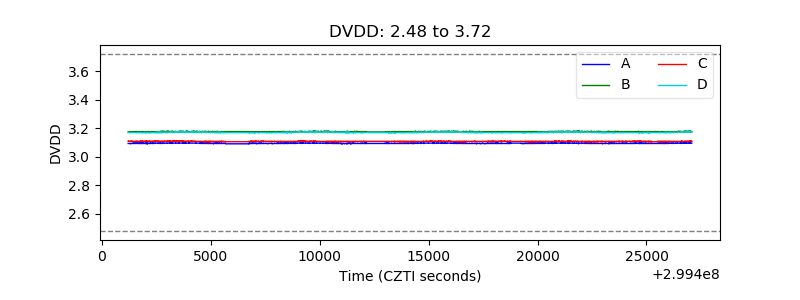 |
| Temperature 1 | 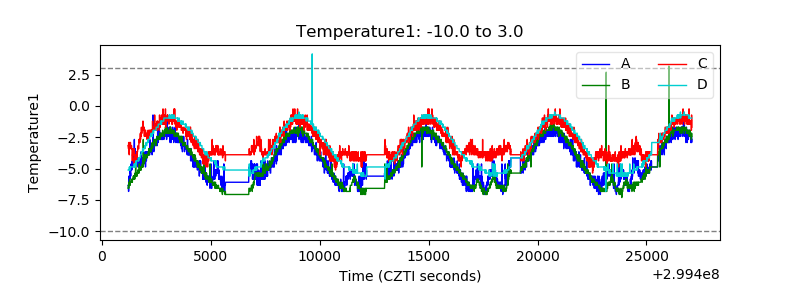 |
| Veto HV Monitor |  |
| Veto LLD | 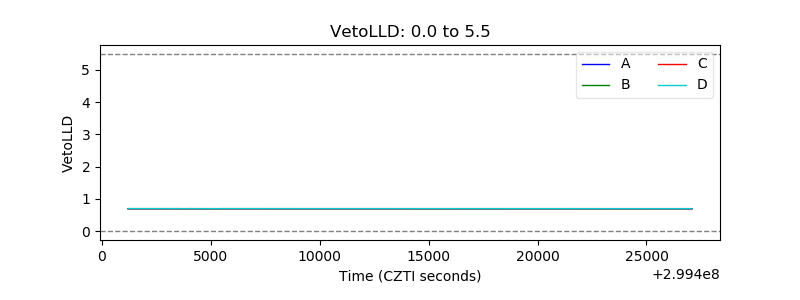 |
| Alpha Counter | 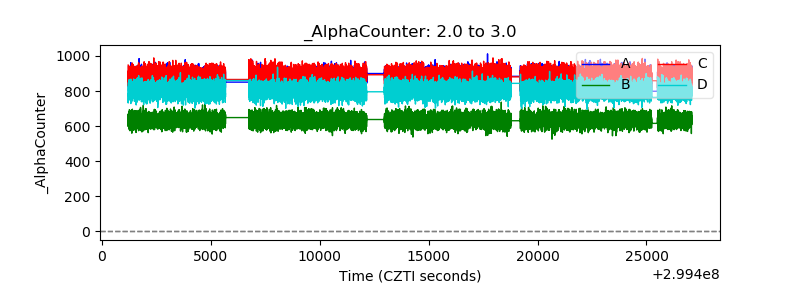 |
| _CPM_Rate | 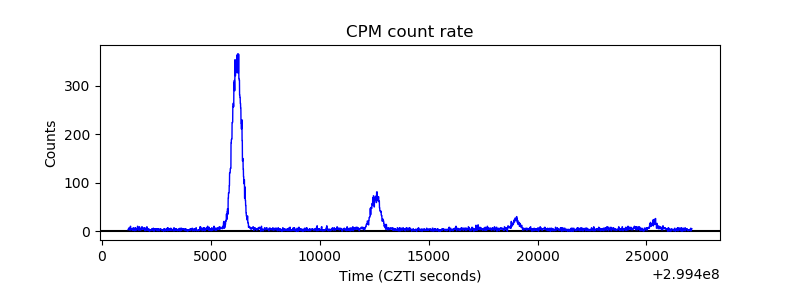 |
| CZT Counter | 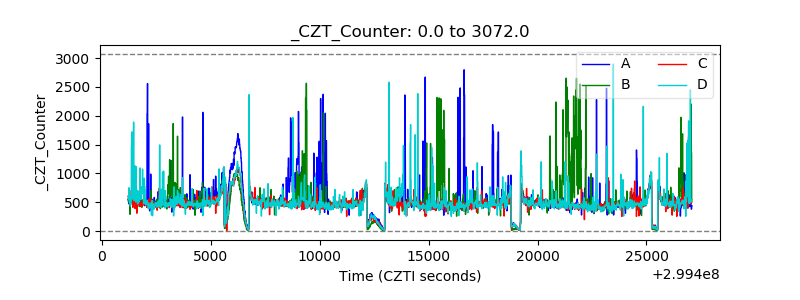 |
| +2.5 Volts monitor | 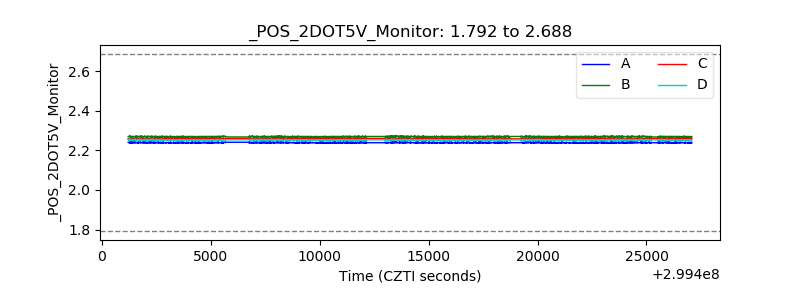 |
| +5 Volts monitor |  |
| _ROLL_ROT | 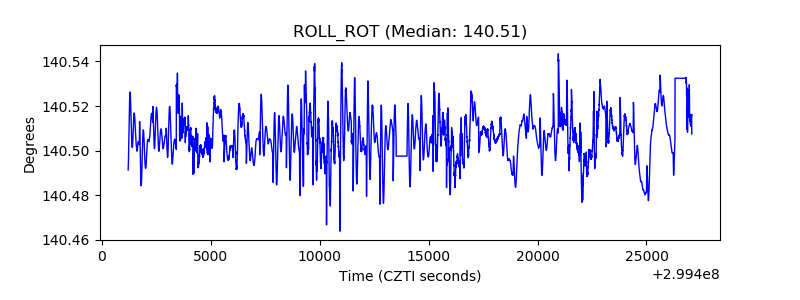 |
| _Roll_DEC | 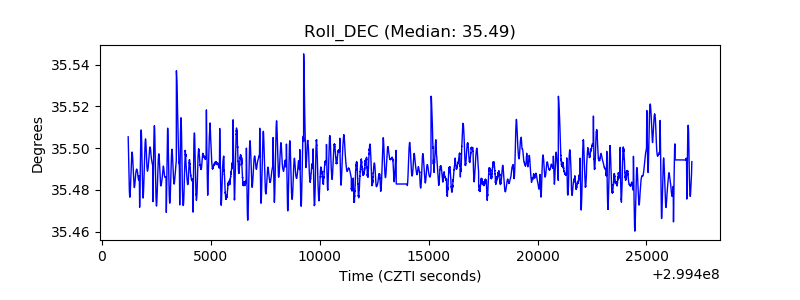 |
| _Roll_RA | 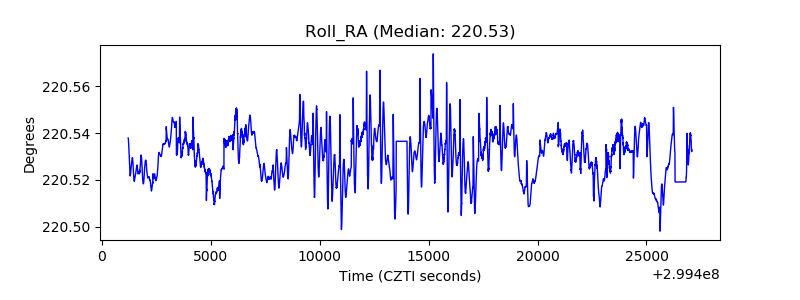 |
| Veto Counter | 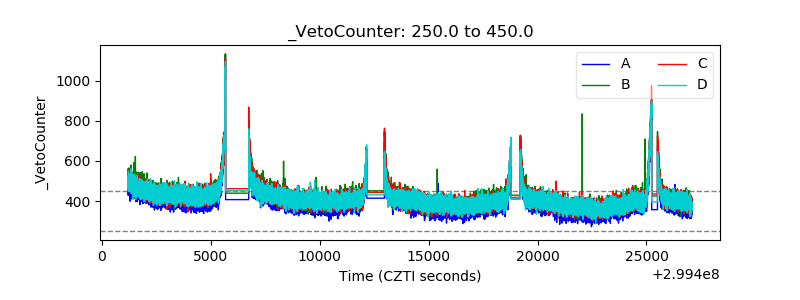 |