| Param | Original file | Final file |
|---|---|---|
| Filename | modeM0/AS1A05_175T01_9000003004_20270cztM0_level2.evt | modeM0/AS1A05_175T01_9000003004_20270cztM0_level2_quad_clean.evt |
| Size (bytes) | 507,516,480 | 94,458,240 |
| Size | 484.0 MB | 90.1 MB |
| Events in quadrant A | 3,929,507 | 604,520 |
| Events in quadrant B | 3,868,226 | 607,702 |
| Events in quadrant C | 3,333,421 | 587,147 |
| Events in quadrant D | 3,769,495 | 579,326 |
| Mode M0 | |||
|---|---|---|---|
| Quadrant | BADHDUFLAG | Total packets | Discarded packets |
| A | 0 | 16177 | 1 |
| B | 0 | 16024 | 1 |
| C | 0 | 14355 | 1 |
| D | 0 | 15871 | 2 |
| Mode SS | |||
|---|---|---|---|
| Quadrant | BADHDUFLAG | Total packets | Discarded packets |
| A | 0 | 140 | 0 |
| B | 0 | 140 | 0 |
| C | 0 | 140 | 0 |
| D | 0 | 140 | 0 |
| Mode M9 | |||
|---|---|---|---|
| Quadrant | BADHDUFLAG | Total packets | Discarded packets |
| A | 0 | 4 | 0 |
| B | 0 | 4 | 0 |
| C | 0 | 4 | 0 |
| D | 0 | 4 | 0 |
| Quadrant | Total seconds | Saturated seconds | Saturation percentage |
|---|---|---|---|
| A | 6913 | 241 | 3.486185% |
| B | 6913 | 176 | 2.545928% |
| C | 6914 | 115 | 1.663292% |
| D | 6913 | 162 | 2.343411% |
Noise dominated data is calculated using 1-second bins in cleaned event files. If a bin has >2000 counts, and if more than 50% of those come from <1% of pixels, then it is considered to be noise-dominated and hence unusable.
| Quadrant | # 1 sec bins | Bins with >0 counts | Bins with >2000 counts | High rate bins dominated by noise | Noise dominated (total time) | Noise dominated (detector-on time) | Marked lightcurve |
|---|---|---|---|---|---|---|---|
| A | 7308 | 6914 | 108 | 108 | 1.48% | 1.56% | 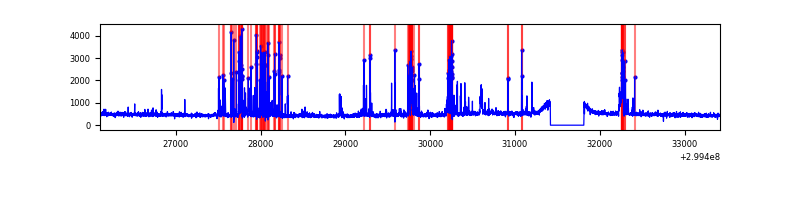 |
| B | 7308 | 6914 | 51 | 51 | 0.70% | 0.74% | 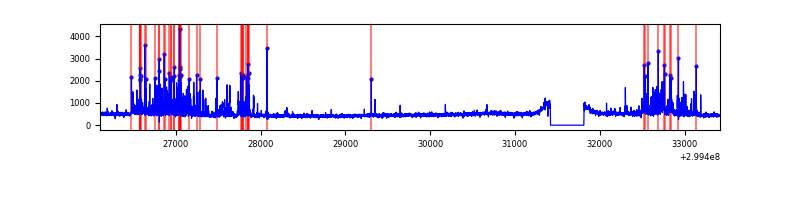 |
| C | 7309 | 6915 | 0 | 0 | 0.00% | 0.00% | 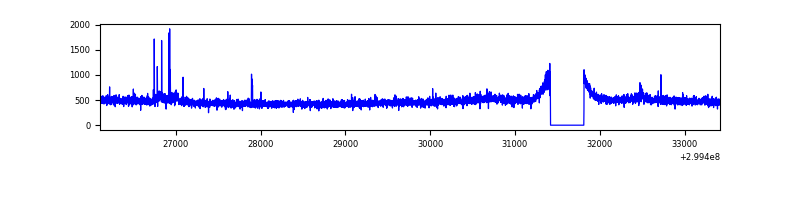 |
| D | 7308 | 6914 | 75 | 75 | 1.03% | 1.08% | 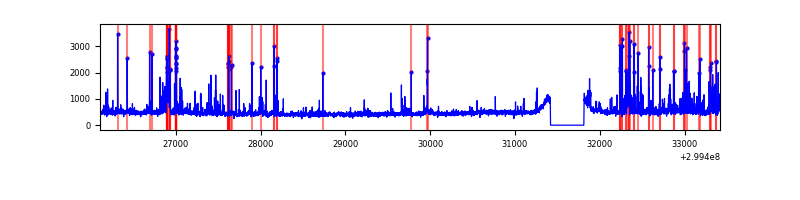 |
Top three noisy pixels from each quadrant. If the there are fewer than three noisy pixels in the level2.evt file, extra rows are filled as -1
| Pixel properties | Quadrant properties | ||||||
|---|---|---|---|---|---|---|---|
| Quadrant | DetID | PixID | Counts | Sigma | Mean | Median | Sigma |
| A | 14 | 238 | 529504 | 3178.01 | 826 | 806 | 166.4 |
| A | 14 | 254 | 142033 | 848.92 | 826 | 806 | 166.4 |
| A | 4 | 2 | 24301 | 141.23 | 826 | 806 | 166.4 |
| B | 7 | 220 | 322010 | 2025.26 | 823 | 801 | 158.6 |
| B | 4 | 142 | 170511 | 1070.04 | 823 | 801 | 158.6 |
| B | 0 | 244 | 81509 | 508.87 | 823 | 801 | 158.6 |
| C | 14 | 238 | 123789 | 648.69 | 800 | 805 | 189.6 |
| C | 9 | 221 | 68305 | 356.03 | 800 | 805 | 189.6 |
| C | 3 | 233 | 9013 | 43.29 | 800 | 805 | 189.6 |
| D | 1 | 52 | 326401 | 1654.47 | 814 | 791 | 196.8 |
| D | 11 | 176 | 247248 | 1252.28 | 814 | 791 | 196.8 |
| D | 2 | 234 | 49329 | 246.63 | 814 | 791 | 196.8 |
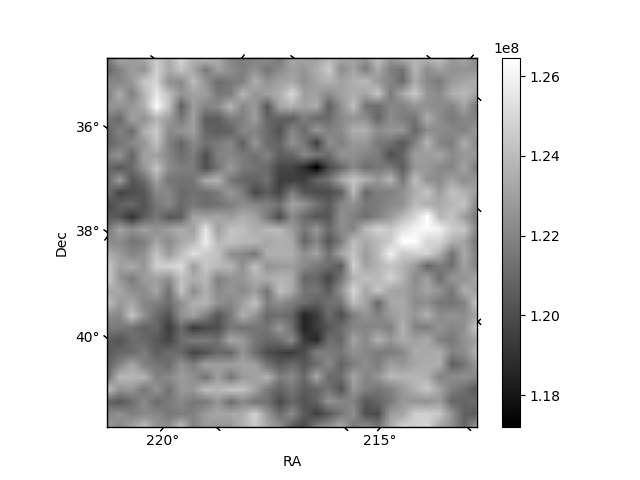
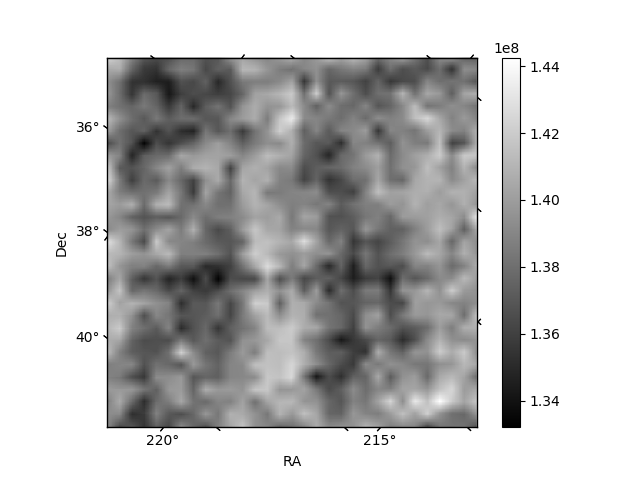
Histogram calculated using DETX and DETY for each event in the final _common_clean file
| Quadrant A | 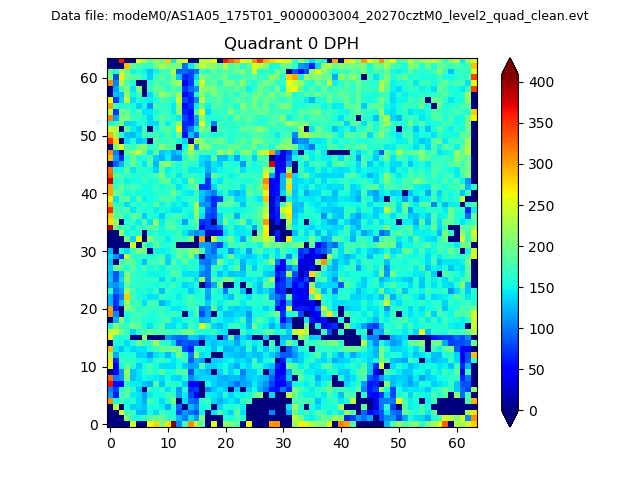 |
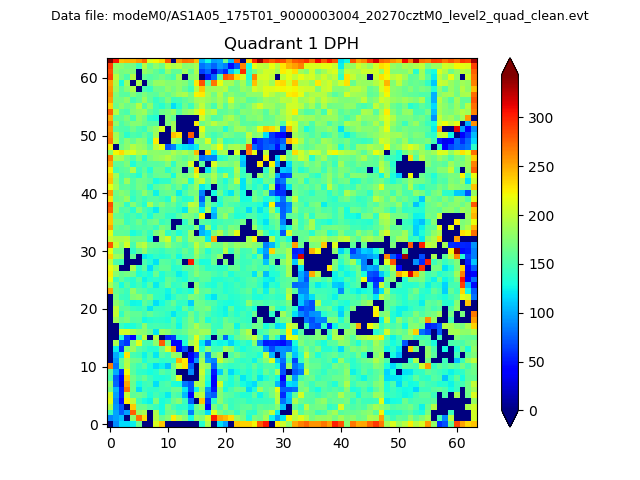 |
Quadrant B |
|---|---|---|---|
| Quadrant D |  |
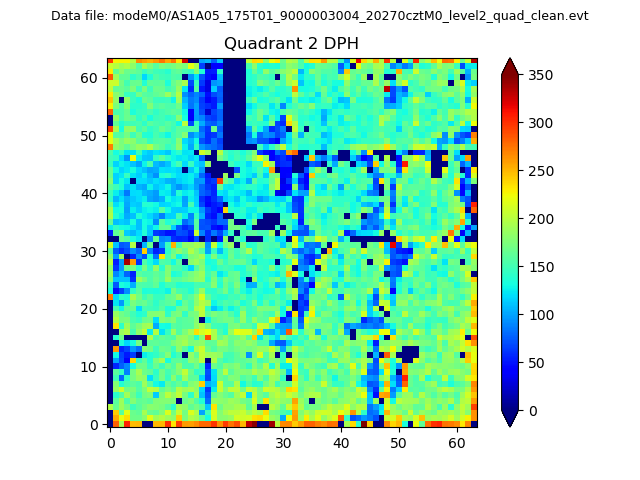 |
Quadrant C |
| Plot type | Count rate plots | Images |
|---|---|---|
| Comparison with Poisson distribution Blue bars denote a histogram of data divided into 1 sec bins. Red curve is a Poisson curve with rate = median count rate of data. |
 |
 |
| Quadrant-wise count rates Data is divided into 100 sec bins |
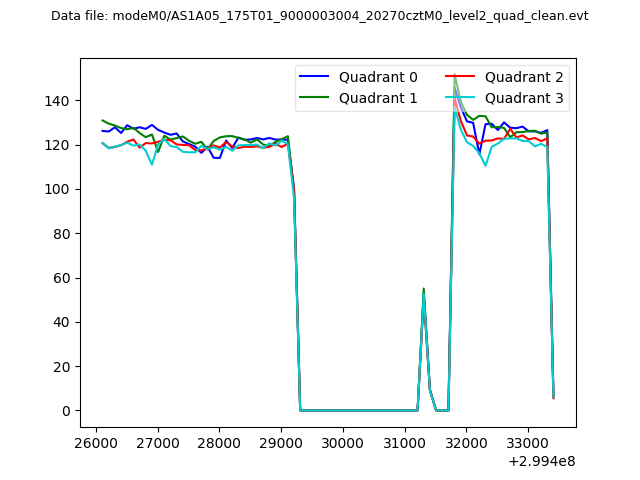 |
|
| Module-wise count rates for Quadrant A Data is divided into 100 sec bins |
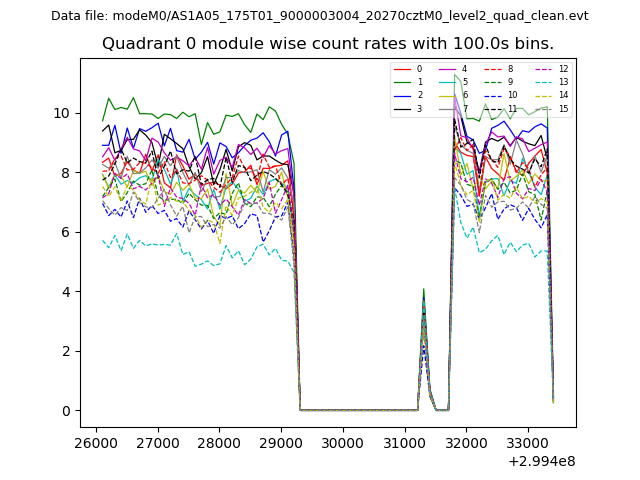 |
 |
| Module-wise count rates for Quadrant B Data is divided into 100 sec bins |
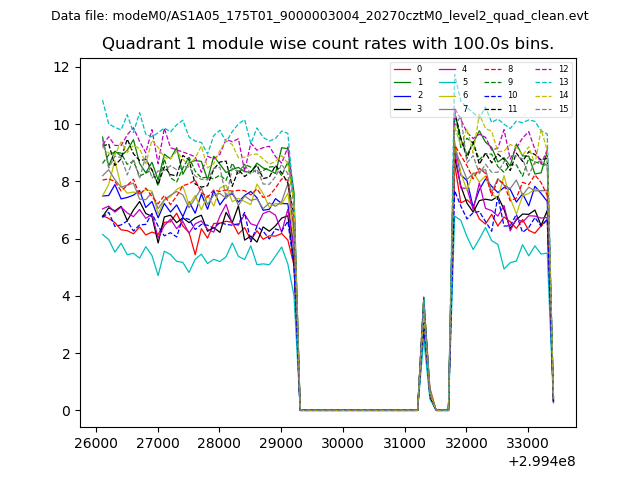 |
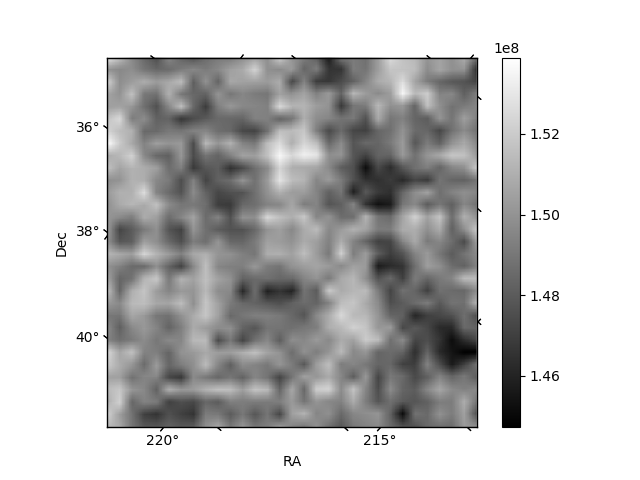 |
| Module-wise count rates for Quadrant C Data is divided into 100 sec bins |
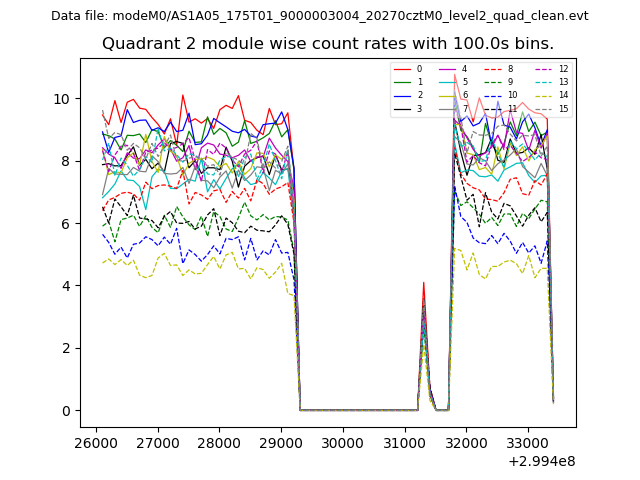 |
 |
| Module-wise count rates for Quadrant D Data is divided into 100 sec bins |
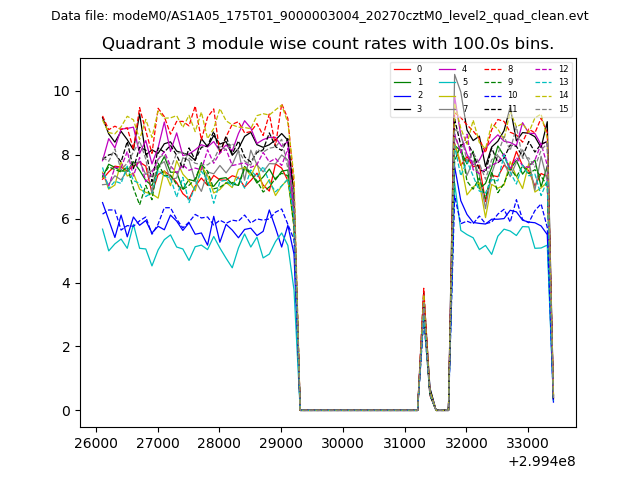 |
 |
| Parameter | Plot |
|---|---|
| CZT HV Monitor | 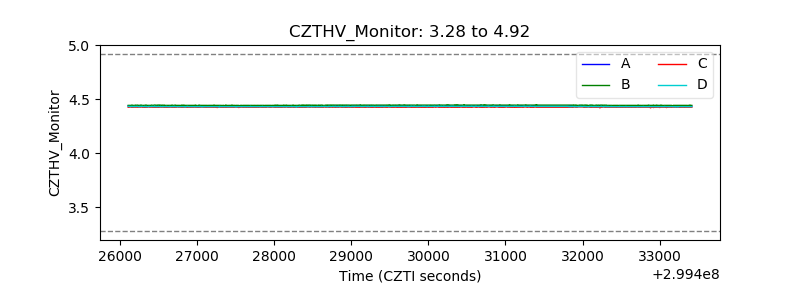 |
| D_VDD | 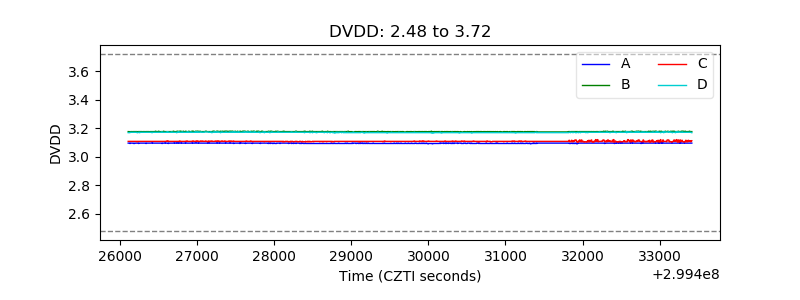 |
| Temperature 1 | 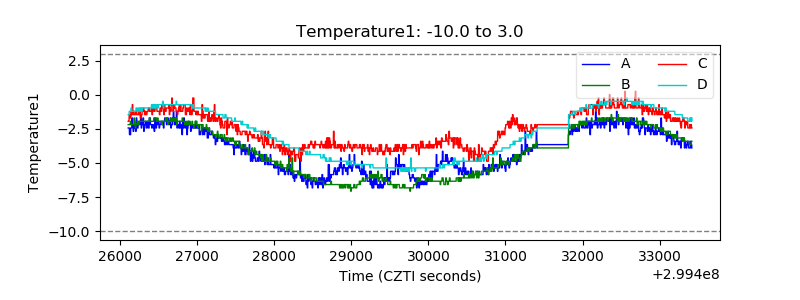 |
| Veto HV Monitor |  |
| Veto LLD | 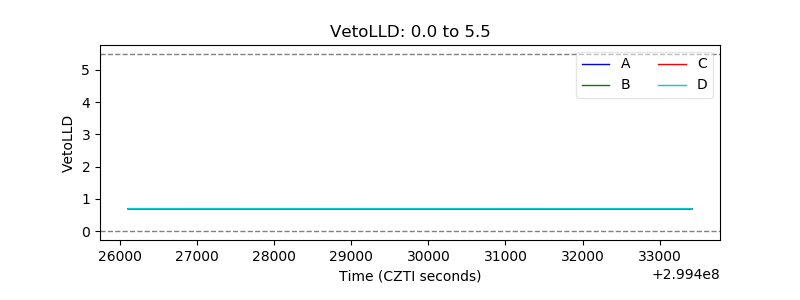 |
| Alpha Counter | 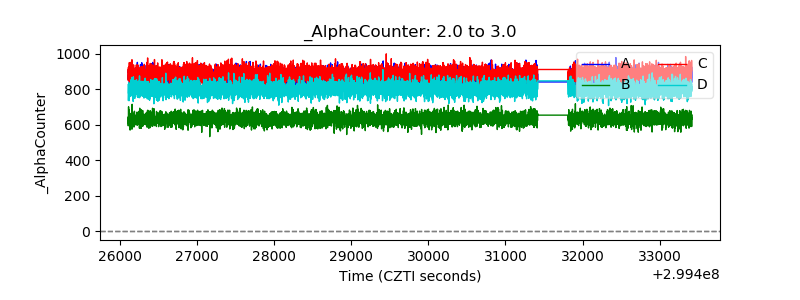 |
| _CPM_Rate | 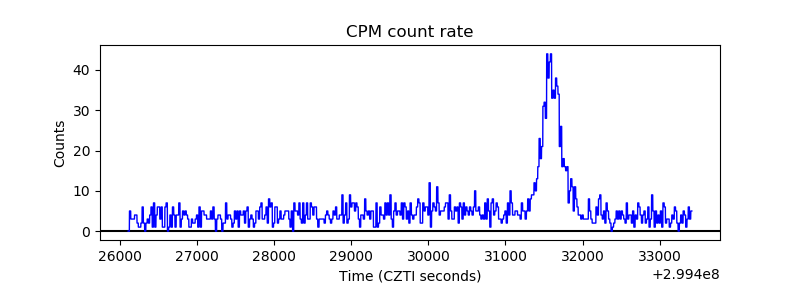 |
| CZT Counter | 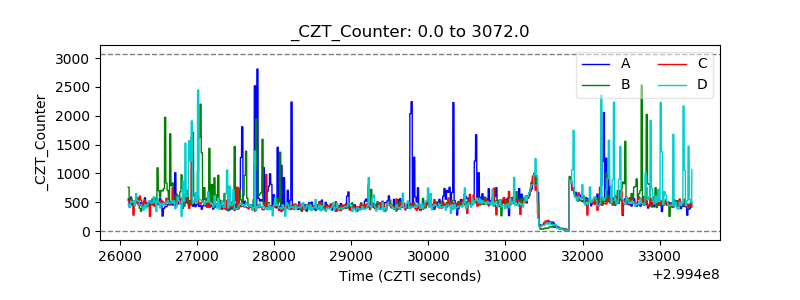 |
| +2.5 Volts monitor | 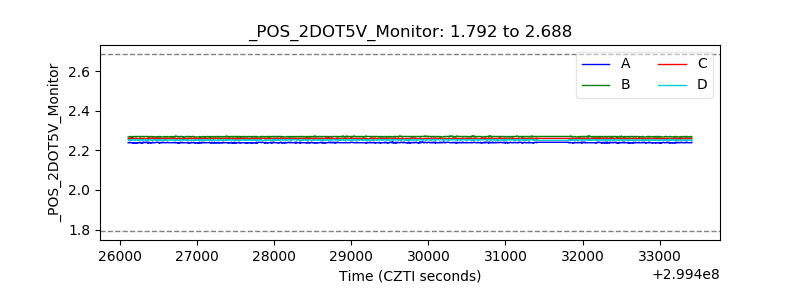 |
| +5 Volts monitor |  |
| _ROLL_ROT | 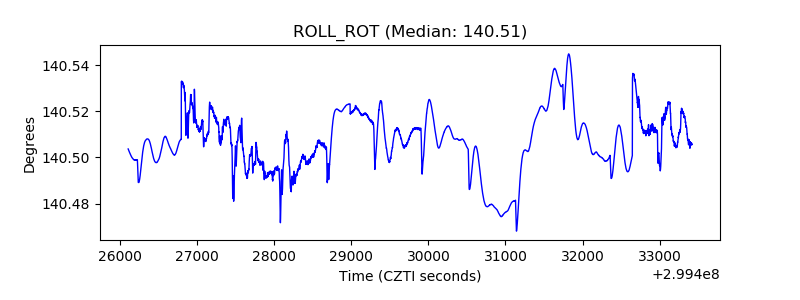 |
| _Roll_DEC | 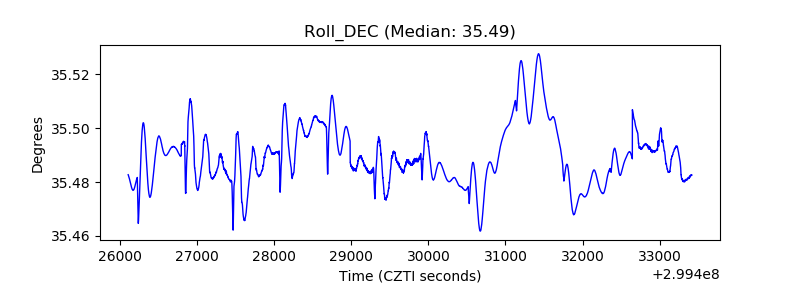 |
| _Roll_RA | 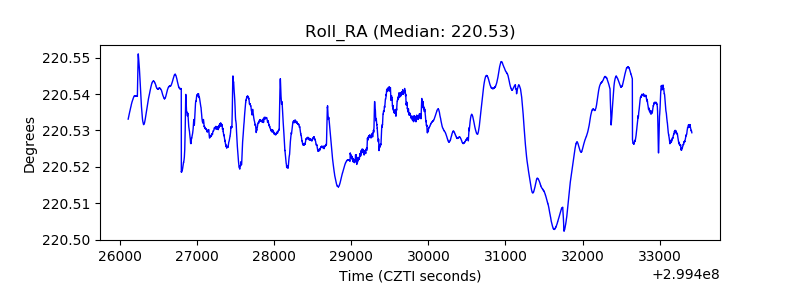 |
| Veto Counter | 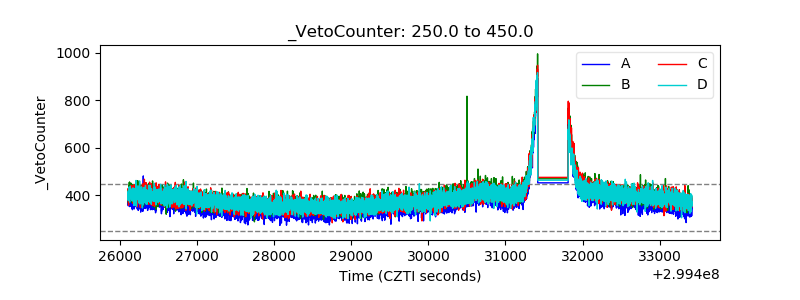 |