| Param | Original file | Final file |
|---|---|---|
| Filename | modeM0/AS1A05_175T01_9000003004_20272cztM0_level2.evt | modeM0/AS1A05_175T01_9000003004_20272cztM0_level2_quad_clean.evt |
| Size (bytes) | 750,542,400 | 124,179,840 |
| Size | 715.8 MB | 118.4 MB |
| Events in quadrant A | 5,795,415 | 770,614 |
| Events in quadrant B | 5,293,788 | 772,826 |
| Events in quadrant C | 4,814,210 | 756,608 |
| Events in quadrant D | 6,123,253 | 740,823 |
| Mode M0 | |||
|---|---|---|---|
| Quadrant | BADHDUFLAG | Total packets | Discarded packets |
| A | 0 | 24216 | 1 |
| B | 0 | 22791 | 1 |
| C | 0 | 21149 | 2 |
| D | 0 | 25384 | 1 |
| Mode SS | |||
|---|---|---|---|
| Quadrant | BADHDUFLAG | Total packets | Discarded packets |
| A | 0 | 208 | 0 |
| B | 0 | 210 | 0 |
| C | 0 | 210 | 0 |
| D | 0 | 210 | 0 |
| Mode M9 | |||
|---|---|---|---|
| Quadrant | BADHDUFLAG | Total packets | Discarded packets |
| A | 0 | 6 | 0 |
| B | 0 | 6 | 0 |
| C | 0 | 6 | 0 |
| D | 0 | 6 | 0 |
| Quadrant | Total seconds | Saturated seconds | Saturation percentage |
|---|---|---|---|
| A | 10392 | 169 | 1.626251% |
| B | 10393 | 160 | 1.539498% |
| C | 10392 | 77 | 0.740955% |
| D | 10392 | 251 | 2.415319% |
Noise dominated data is calculated using 1-second bins in cleaned event files. If a bin has >2000 counts, and if more than 50% of those come from <1% of pixels, then it is considered to be noise-dominated and hence unusable.
| Quadrant | # 1 sec bins | Bins with >0 counts | Bins with >2000 counts | High rate bins dominated by noise | Noise dominated (total time) | Noise dominated (detector-on time) | Marked lightcurve |
|---|---|---|---|---|---|---|---|
| A | 10967 | 10393 | 87 | 87 | 0.79% | 0.84% | 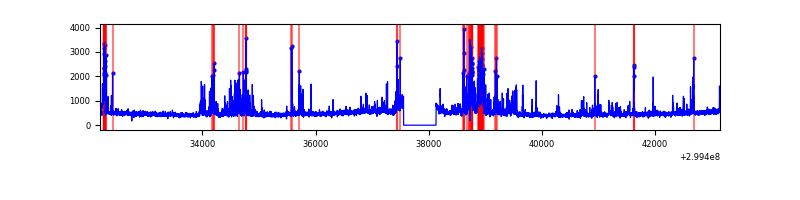 |
| B | 10968 | 10394 | 61 | 61 | 0.56% | 0.59% | 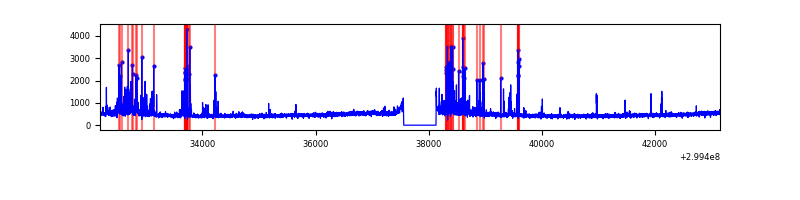 |
| C | 10967 | 10393 | 0 | 0 | 0.00% | 0.00% | 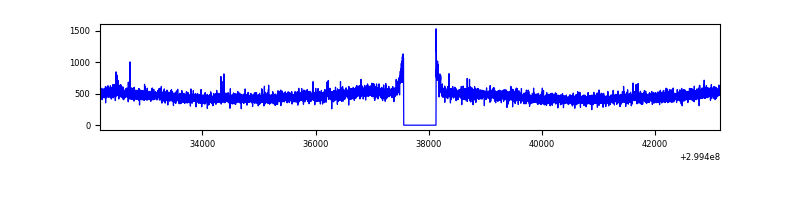 |
| D | 10967 | 10393 | 200 | 200 | 1.82% | 1.92% | 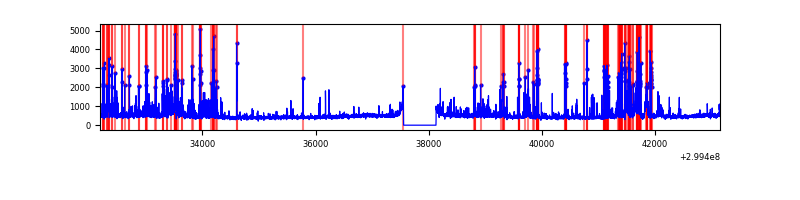 |
Top three noisy pixels from each quadrant. If the there are fewer than three noisy pixels in the level2.evt file, extra rows are filled as -1
| Pixel properties | Quadrant properties | ||||||
|---|---|---|---|---|---|---|---|
| Quadrant | DetID | PixID | Counts | Sigma | Mean | Median | Sigma |
| A | 14 | 238 | 1005832 | 4133.18 | 1203 | 1176 | 243.1 |
| A | 4 | 2 | 101967 | 414.66 | 1203 | 1176 | 243.1 |
| A | 8 | 205 | 34171 | 135.74 | 1203 | 1176 | 243.1 |
| B | 7 | 220 | 389972 | 1704.52 | 1199 | 1172 | 228.1 |
| B | 0 | 244 | 74803 | 322.8 | 1199 | 1172 | 228.1 |
| B | 0 | 197 | 31225 | 131.75 | 1199 | 1172 | 228.1 |
| C | 14 | 238 | 182588 | 664.68 | 1164 | 1170 | 272.9 |
| C | 9 | 221 | 32793 | 115.86 | 1164 | 1170 | 272.9 |
| C | 3 | 233 | 17643 | 60.35 | 1164 | 1170 | 272.9 |
| D | 11 | 176 | 815181 | 2893.66 | 1171 | 1140 | 281.3 |
| D | 1 | 52 | 428135 | 1517.83 | 1171 | 1140 | 281.3 |
| D | 9 | 1 | 175499 | 619.79 | 1171 | 1140 | 281.3 |
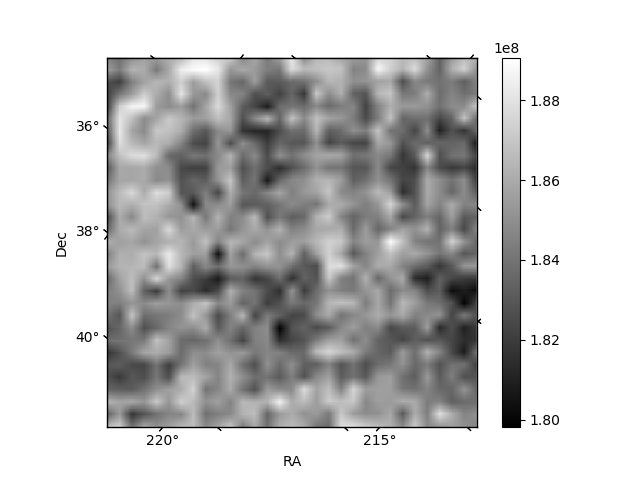
Histogram calculated using DETX and DETY for each event in the final _common_clean file
| Quadrant A | 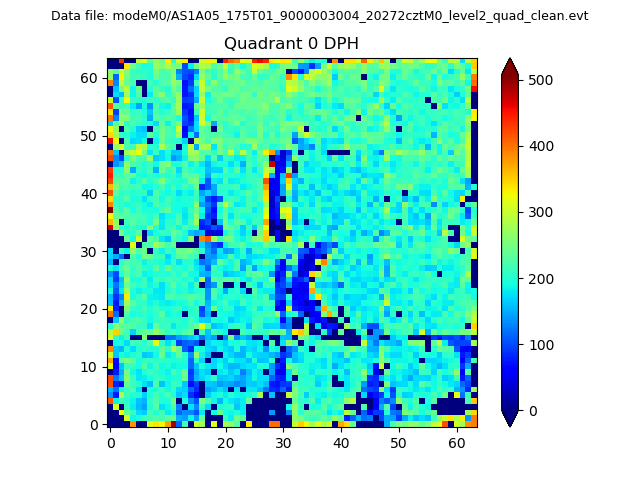 |
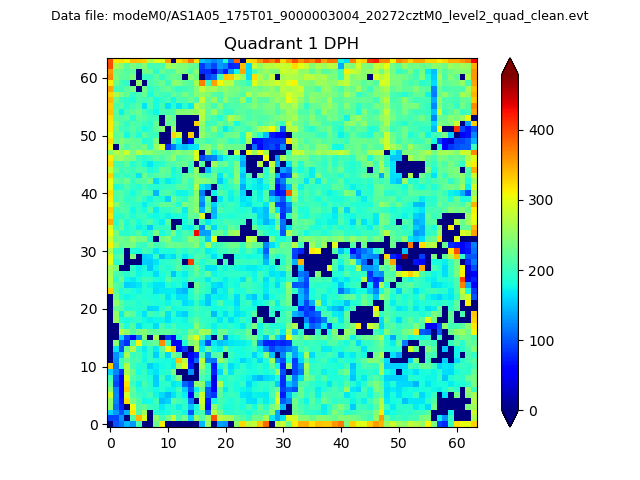 |
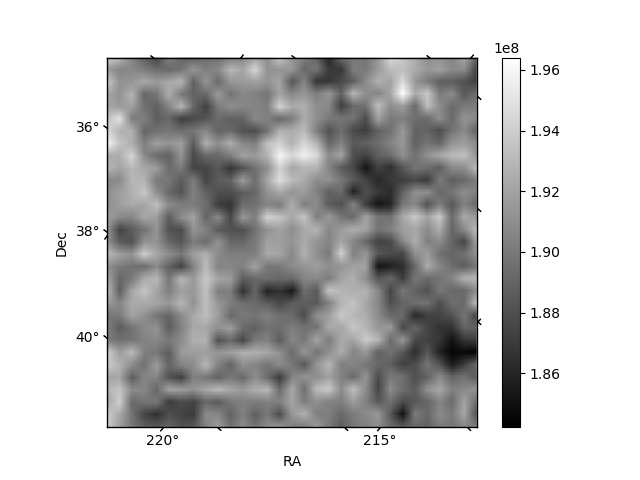
Quadrant B |
|---|---|---|---|
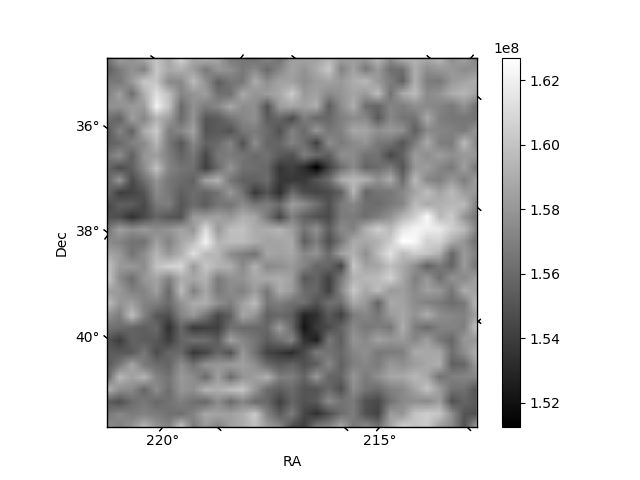
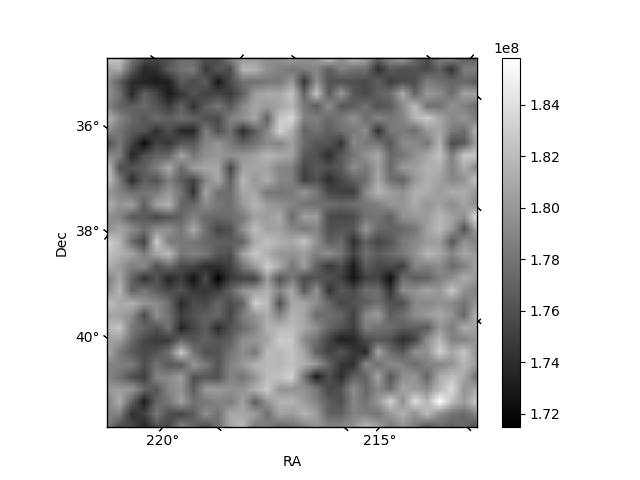
| Quadrant D | 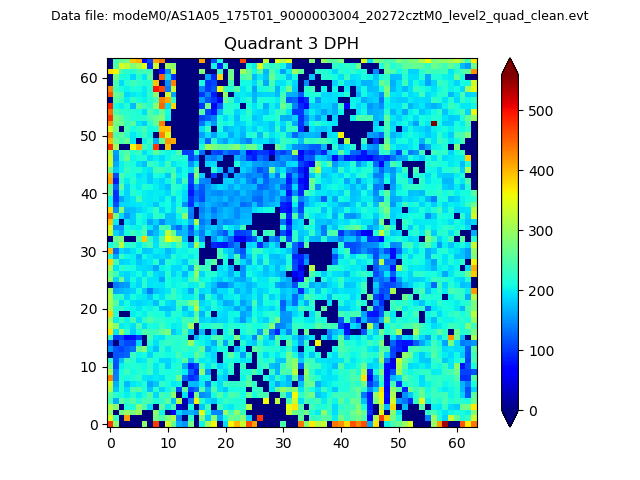 |
 |
Quadrant C |
| Plot type | Count rate plots | Images |
|---|---|---|
| Comparison with Poisson distribution Blue bars denote a histogram of data divided into 1 sec bins. Red curve is a Poisson curve with rate = median count rate of data. |
 |
 |
| Quadrant-wise count rates Data is divided into 100 sec bins |
 |
|
| Module-wise count rates for Quadrant A Data is divided into 100 sec bins |
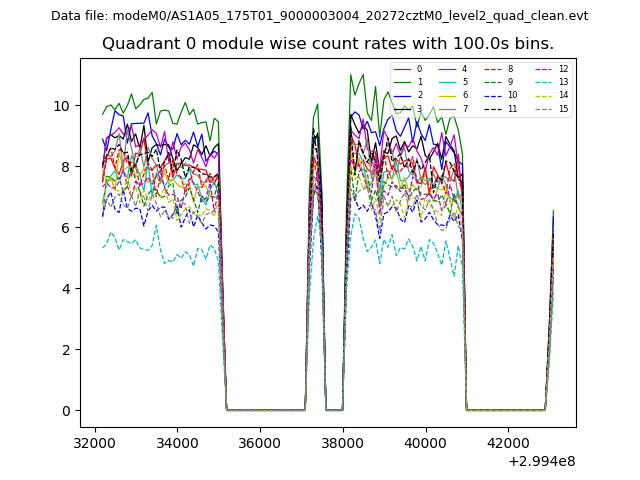 |
 |
| Module-wise count rates for Quadrant B Data is divided into 100 sec bins |
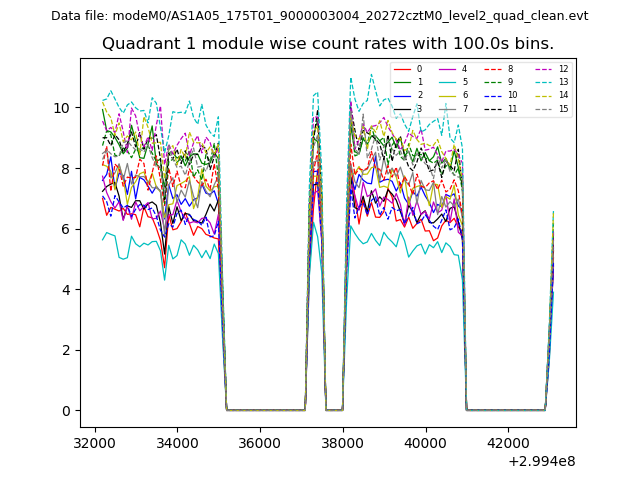 |
 |
| Module-wise count rates for Quadrant C Data is divided into 100 sec bins |
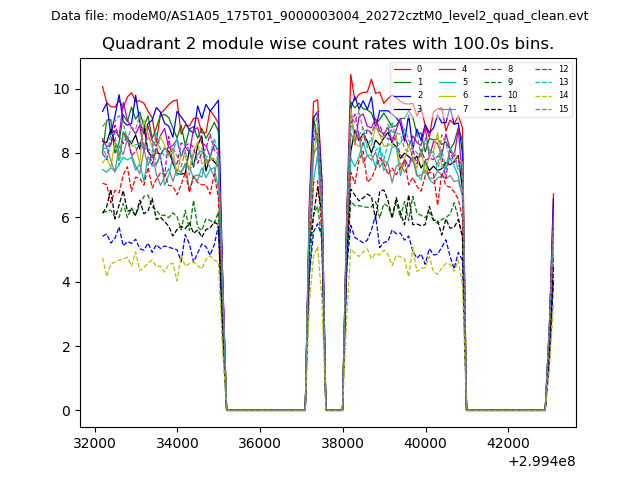 |
 |
| Module-wise count rates for Quadrant D Data is divided into 100 sec bins |
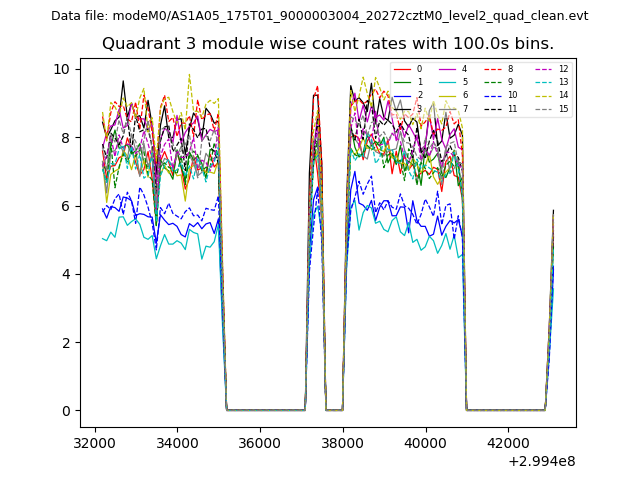 |
 |
| Parameter | Plot |
|---|---|
| CZT HV Monitor | 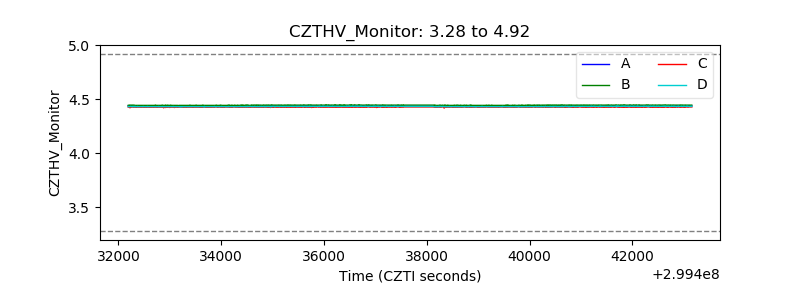 |
| D_VDD | 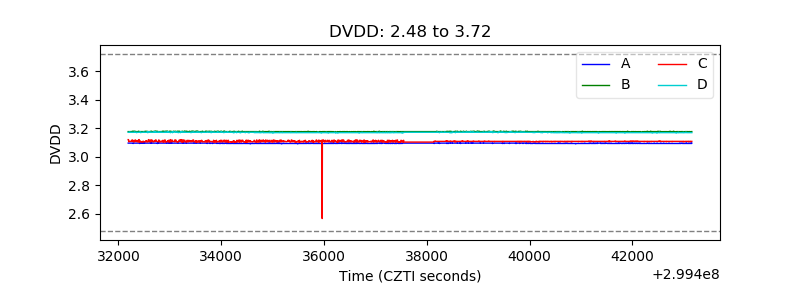 |
| Temperature 1 | 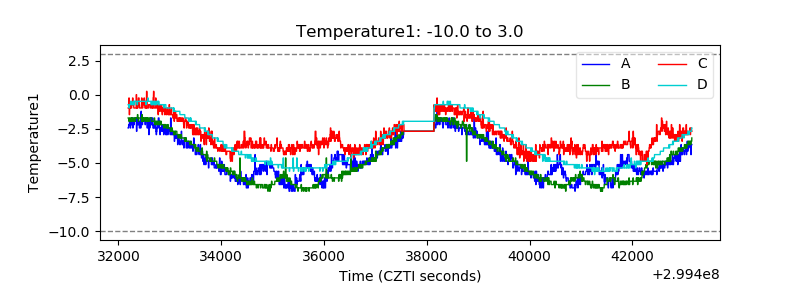 |
| Veto HV Monitor | 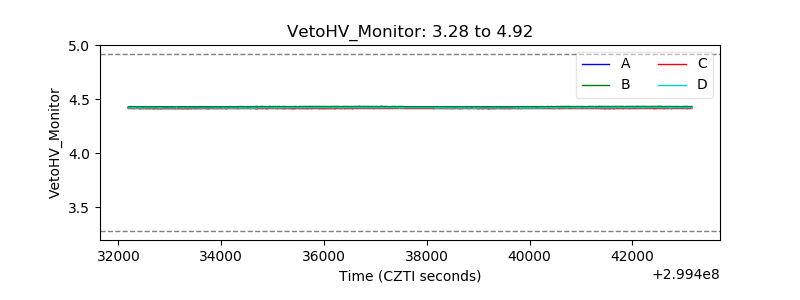 |
| Veto LLD | 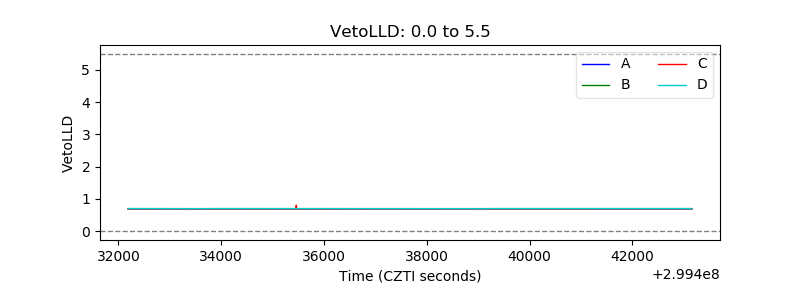 |
| Alpha Counter |  |
| _CPM_Rate |  |
| CZT Counter | 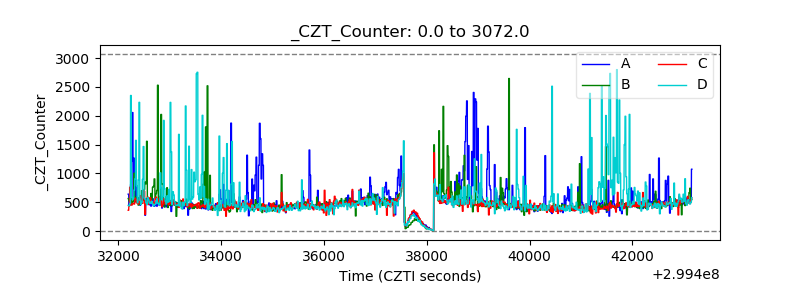 |
| +2.5 Volts monitor |  |
| +5 Volts monitor |  |
| _ROLL_ROT | 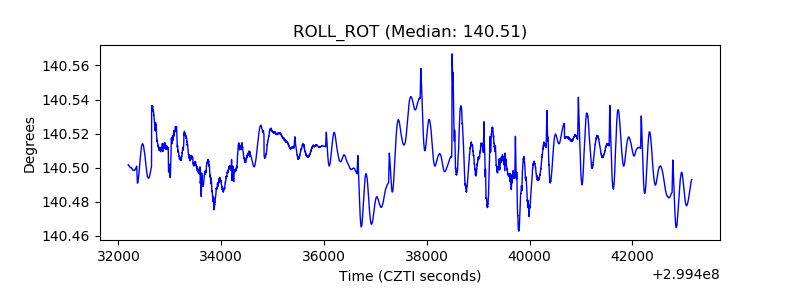 |
| _Roll_DEC | 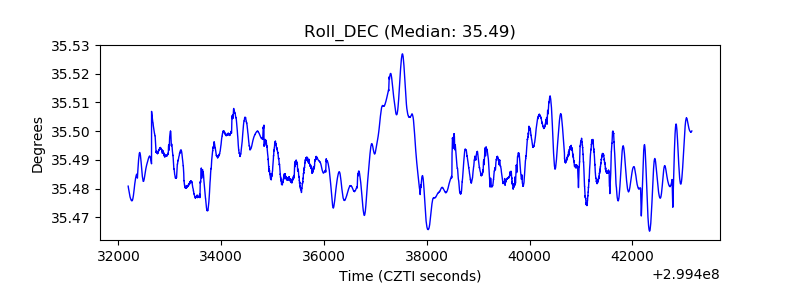 |
| _Roll_RA | 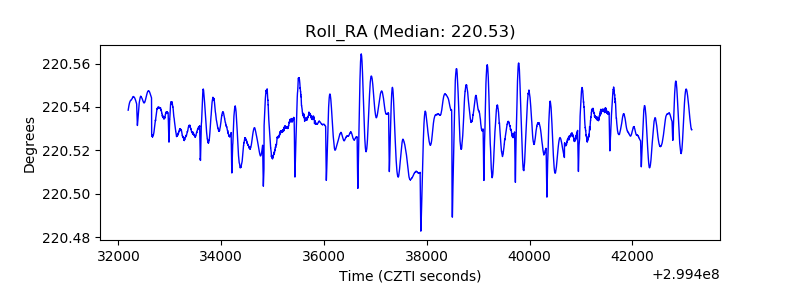 |
| Veto Counter | 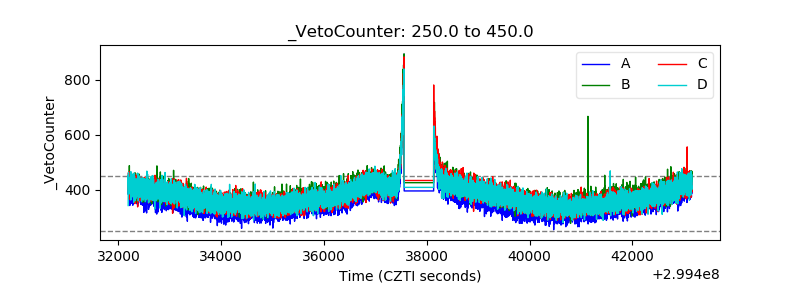 |