| Param | Original file | Final file |
|---|---|---|
| Filename | modeM0/AS1A05_175T01_9000003004_20273cztM0_level2.evt | modeM0/AS1A05_175T01_9000003004_20273cztM0_level2_quad_clean.evt |
| Size (bytes) | 594,840,960 | 110,007,360 |
| Size | 567.3 MB | 104.9 MB |
| Events in quadrant A | 4,281,689 | 699,709 |
| Events in quadrant B | 4,115,507 | 708,749 |
| Events in quadrant C | 4,000,214 | 683,472 |
| Events in quadrant D | 5,053,260 | 661,707 |
| Mode M0 | |||
|---|---|---|---|
| Quadrant | BADHDUFLAG | Total packets | Discarded packets |
| A | 0 | 18189 | 2 |
| B | 0 | 17588 | 2 |
| C | 0 | 17137 | 2 |
| D | 0 | 20571 | 2 |
| Mode SS | |||
|---|---|---|---|
| Quadrant | BADHDUFLAG | Total packets | Discarded packets |
| A | 0 | 172 | 0 |
| B | 0 | 172 | 0 |
| C | 0 | 172 | 0 |
| D | 0 | 172 | 0 |
| Mode M9 | |||
|---|---|---|---|
| Quadrant | BADHDUFLAG | Total packets | Discarded packets |
| A | 0 | 16 | 0 |
| B | 0 | 16 | 0 |
| C | 0 | 16 | 0 |
| D | 0 | 16 | 0 |
| Quadrant | Total seconds | Saturated seconds | Saturation percentage |
|---|---|---|---|
| A | 8311 | 153 | 1.840934% |
| B | 8312 | 126 | 1.515881% |
| C | 8312 | 106 | 1.275265% |
| D | 8312 | 191 | 2.297883% |
Noise dominated data is calculated using 1-second bins in cleaned event files. If a bin has >2000 counts, and if more than 50% of those come from <1% of pixels, then it is considered to be noise-dominated and hence unusable.
| Quadrant | # 1 sec bins | Bins with >0 counts | Bins with >2000 counts | High rate bins dominated by noise | Noise dominated (total time) | Noise dominated (detector-on time) | Marked lightcurve |
|---|---|---|---|---|---|---|---|
| A | 9926 | 8313 | 32 | 32 | 0.32% | 0.38% | 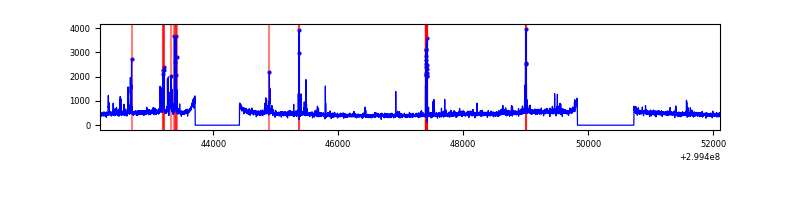 |
| B | 9927 | 8314 | 16 | 16 | 0.16% | 0.19% | 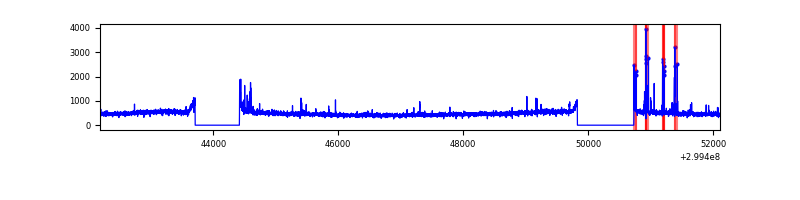 |
| C | 9927 | 8314 | 0 | 0 | 0.00% | 0.00% |  |
| D | 9927 | 8314 | 117 | 117 | 1.18% | 1.41% | 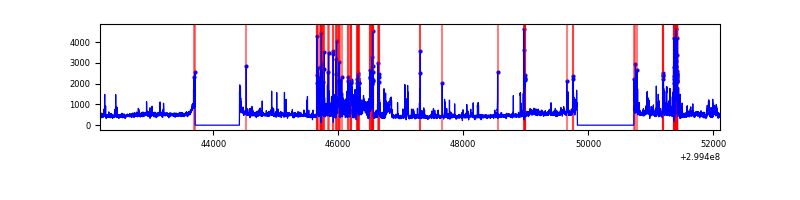 |
Top three noisy pixels from each quadrant. If the there are fewer than three noisy pixels in the level2.evt file, extra rows are filled as -1
| Pixel properties | Quadrant properties | ||||||
|---|---|---|---|---|---|---|---|
| Quadrant | DetID | PixID | Counts | Sigma | Mean | Median | Sigma |
| A | 14 | 238 | 258217 | 1258.19 | 1009 | 987 | 204.4 |
| A | 4 | 2 | 32882 | 156.01 | 1009 | 987 | 204.4 |
| A | 8 | 205 | 29085 | 137.44 | 1009 | 987 | 204.4 |
| B | 7 | 220 | 70543 | 361.04 | 1008 | 982 | 192.7 |
| B | 12 | 111 | 23592 | 117.35 | 1008 | 982 | 192.7 |
| B | 11 | 111 | 20859 | 103.17 | 1008 | 982 | 192.7 |
| C | 14 | 238 | 151879 | 660.14 | 973 | 979 | 228.6 |
| C | 3 | 233 | 21736 | 90.81 | 973 | 979 | 228.6 |
| C | 9 | 221 | 16893 | 69.62 | 973 | 979 | 228.6 |
| D | 1 | 52 | 1157146 | 4881.71 | 978 | 950 | 236.8 |
| D | 9 | 1 | 70870 | 295.22 | 978 | 950 | 236.8 |
| D | 2 | 234 | 52324 | 216.91 | 978 | 950 | 236.8 |
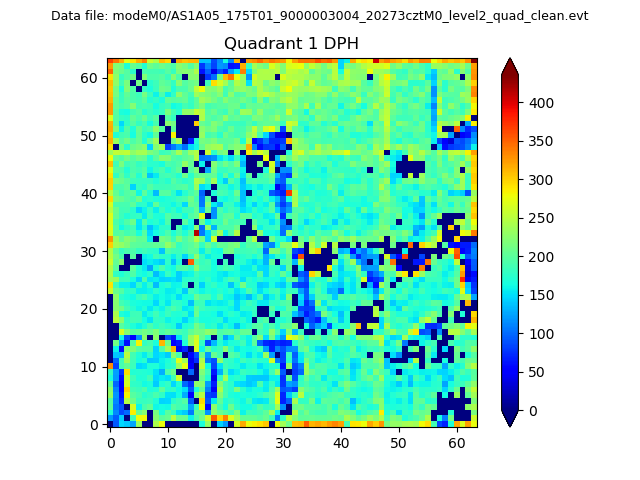
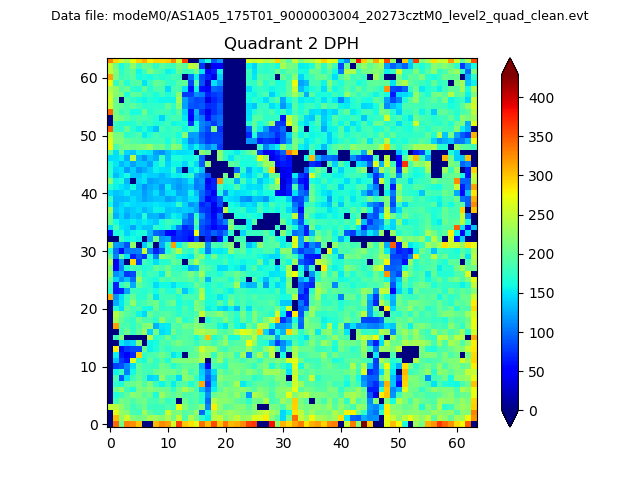
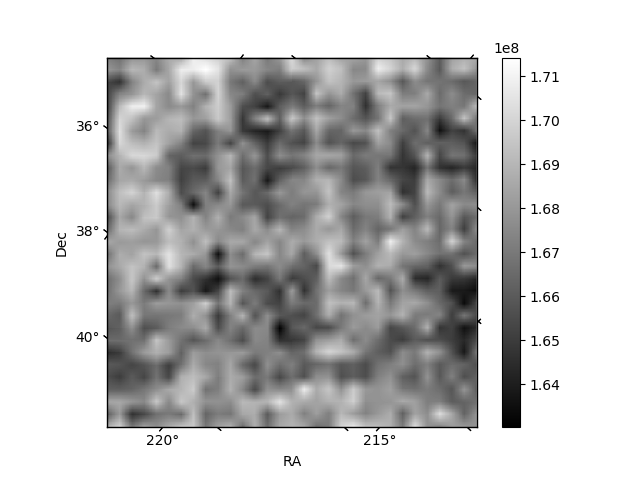
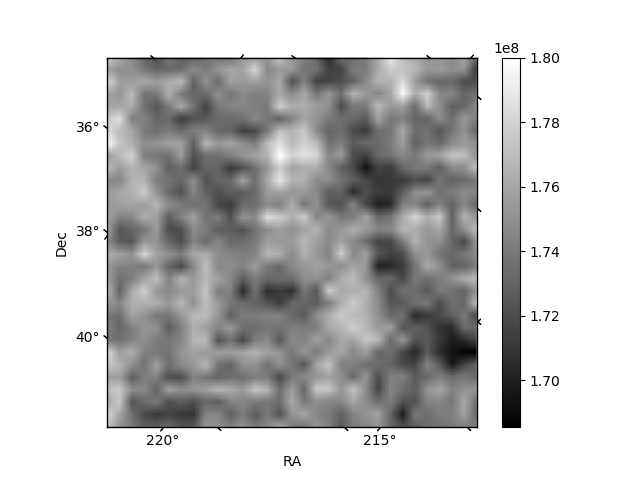
Histogram calculated using DETX and DETY for each event in the final _common_clean file
| Quadrant A | 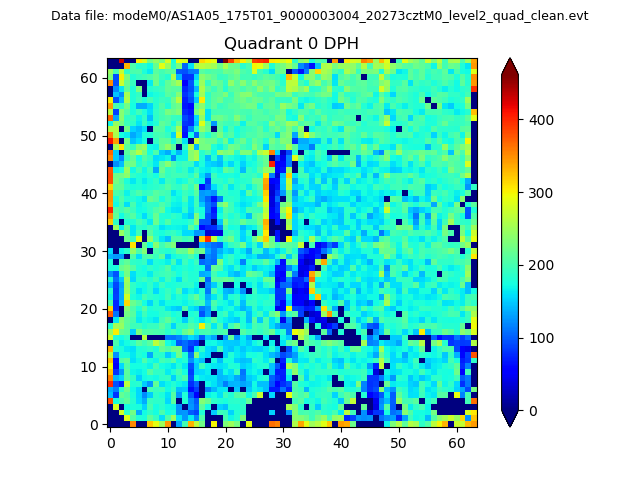 |
 |
Quadrant B |
|---|---|---|---|
| Quadrant D |  |
 |
Quadrant C |
| Plot type | Count rate plots | Images |
|---|---|---|
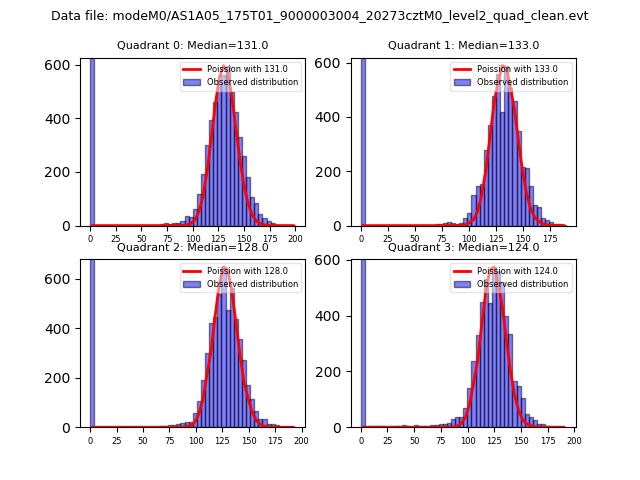
| Comparison with Poisson distribution Blue bars denote a histogram of data divided into 1 sec bins. Red curve is a Poisson curve with rate = median count rate of data. |
 |
 |
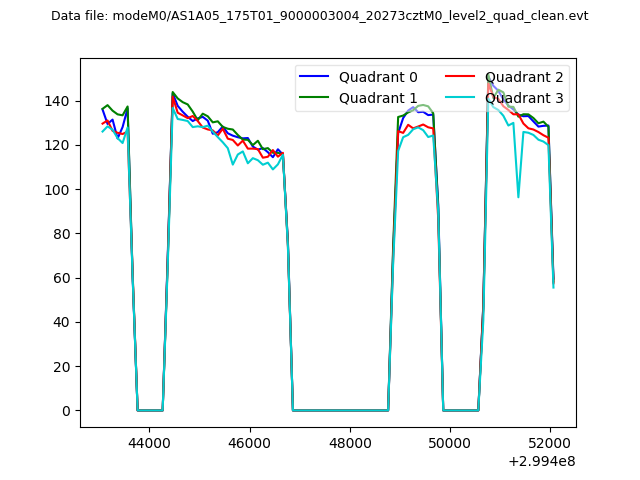
| Quadrant-wise count rates Data is divided into 100 sec bins |
 |
|
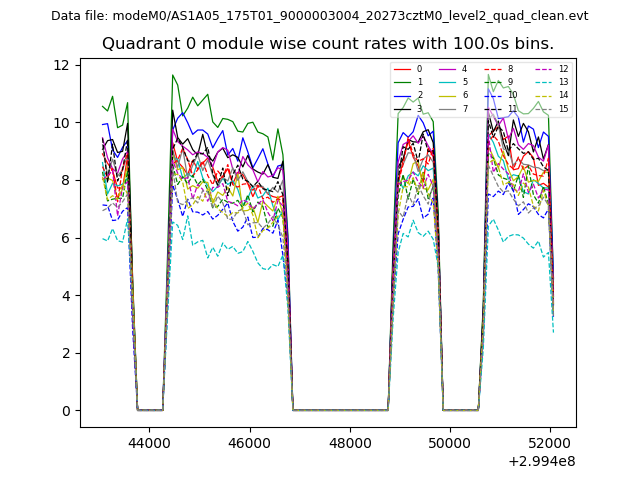
| Module-wise count rates for Quadrant A Data is divided into 100 sec bins |
 |
 |
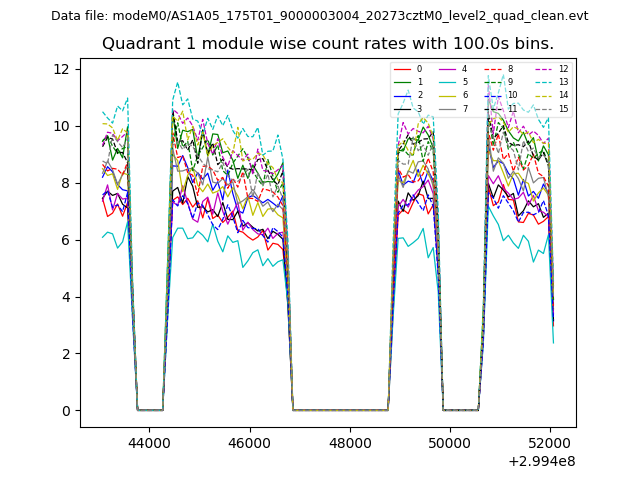
| Module-wise count rates for Quadrant B Data is divided into 100 sec bins |
 |
 |
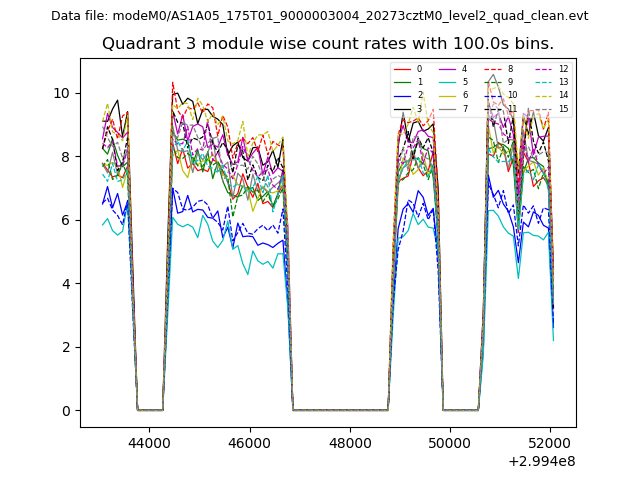
| Module-wise count rates for Quadrant C Data is divided into 100 sec bins |
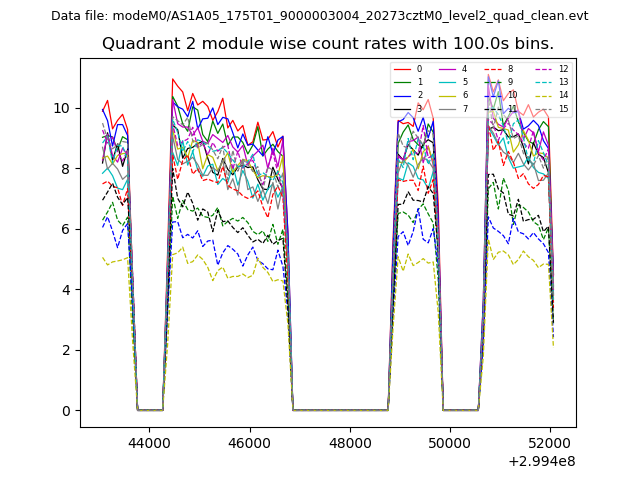 |
 |
| Module-wise count rates for Quadrant D Data is divided into 100 sec bins |
 |
 |
| Parameter | Plot |
|---|---|
| CZT HV Monitor | 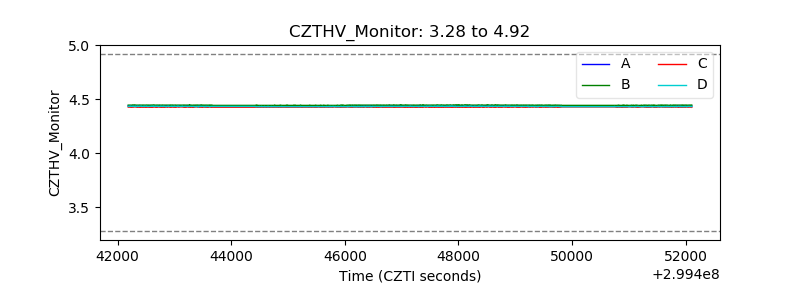 |
| D_VDD | 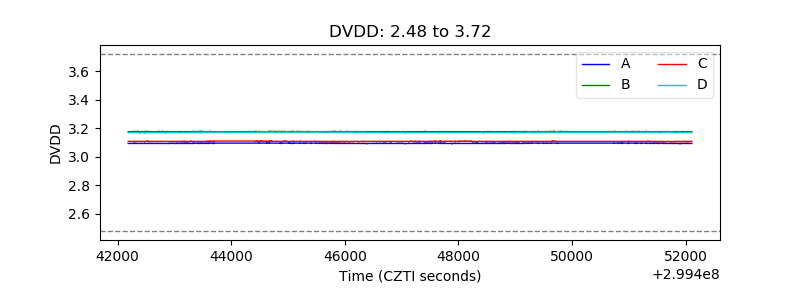 |
| Temperature 1 | 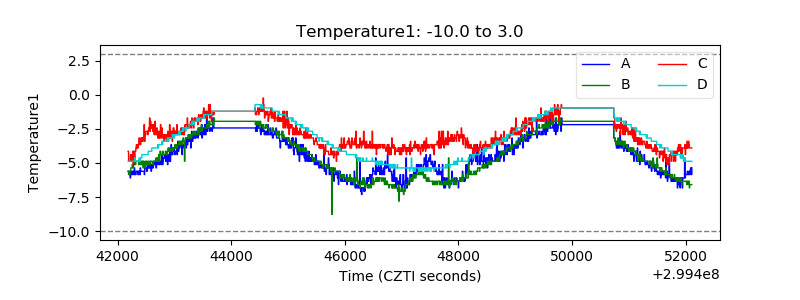 |
| Veto HV Monitor | 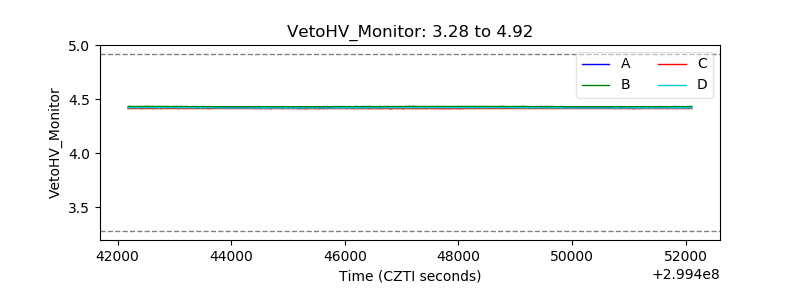 |
| Veto LLD | 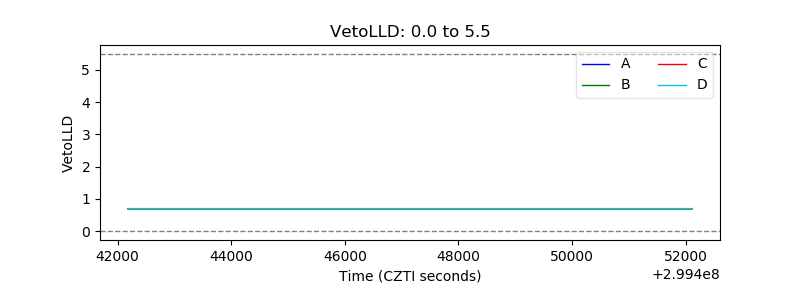 |
| Alpha Counter | 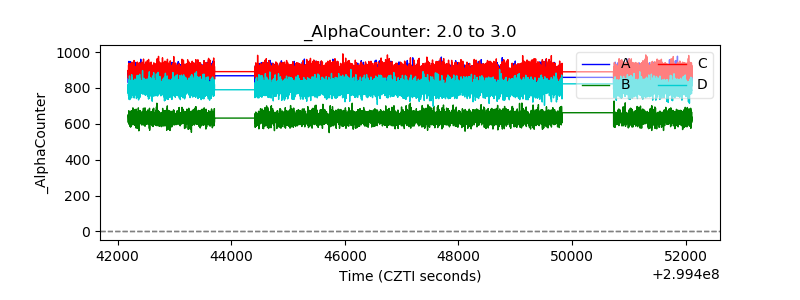 |
| _CPM_Rate |  |
| CZT Counter | 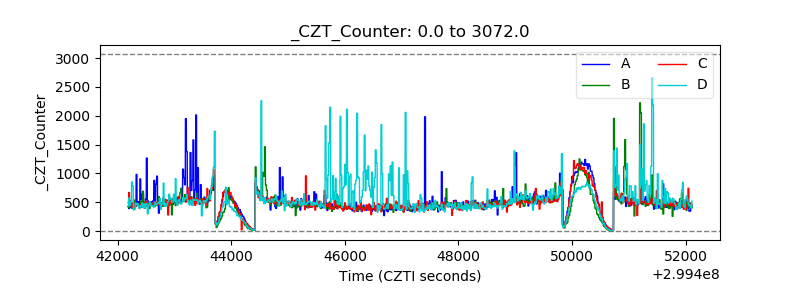 |
| +2.5 Volts monitor |  |
| +5 Volts monitor |  |
| _ROLL_ROT | 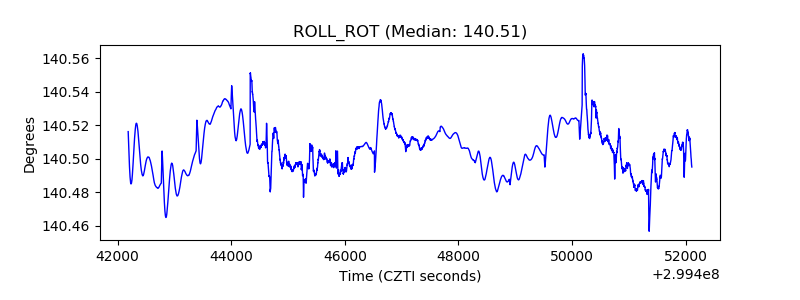 |
| _Roll_DEC | 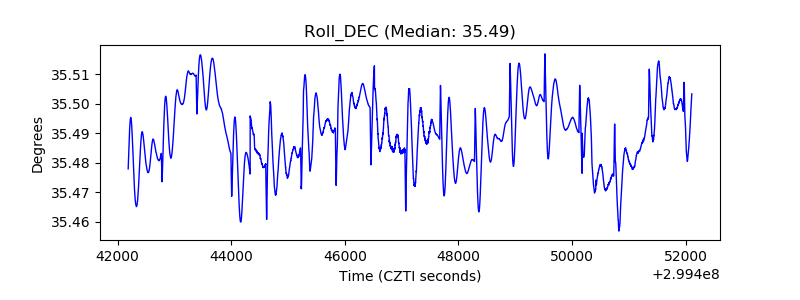 |
| _Roll_RA | 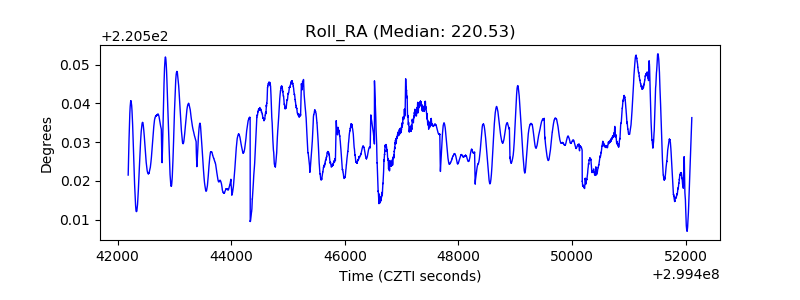 |
| Veto Counter | 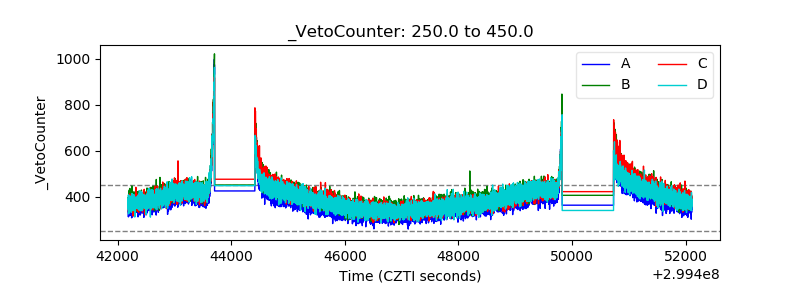 |