| Param | Original file | Final file |
|---|---|---|
| Filename | modeM0/AS1A05_175T01_9000003004_20277cztM0_level2.evt | modeM0/AS1A05_175T01_9000003004_20277cztM0_level2_quad_clean.evt |
| Size (bytes) | 473,921,280 | 90,086,400 |
| Size | 452.0 MB | 85.9 MB |
| Events in quadrant A | 3,073,131 | 592,166 |
| Events in quadrant B | 3,249,341 | 601,136 |
| Events in quadrant C | 3,036,427 | 571,669 |
| Events in quadrant D | 4,568,110 | 525,459 |
| Mode M0 | |||
|---|---|---|---|
| Quadrant | BADHDUFLAG | Total packets | Discarded packets |
| A | 0 | 13059 | 2 |
| B | 0 | 13671 | 2 |
| C | 0 | 12938 | 2 |
| D | 0 | 17899 | 2 |
| Mode SS | |||
|---|---|---|---|
| Quadrant | BADHDUFLAG | Total packets | Discarded packets |
| A | 0 | 128 | 0 |
| B | 0 | 128 | 0 |
| C | 0 | 128 | 0 |
| D | 0 | 128 | 0 |
| Mode M9 | |||
|---|---|---|---|
| Quadrant | BADHDUFLAG | Total packets | Discarded packets |
| A | 0 | 15 | 0 |
| B | 0 | 16 | 0 |
| C | 0 | 16 | 0 |
| D | 0 | 16 | 0 |
| Quadrant | Total seconds | Saturated seconds | Saturation percentage |
|---|---|---|---|
| A | 6265 | 24 | 0.383081% |
| B | 6265 | 59 | 0.941740% |
| C | 6265 | 40 | 0.638468% |
| D | 6265 | 453 | 7.230646% |
Noise dominated data is calculated using 1-second bins in cleaned event files. If a bin has >2000 counts, and if more than 50% of those come from <1% of pixels, then it is considered to be noise-dominated and hence unusable.
| Quadrant | # 1 sec bins | Bins with >0 counts | Bins with >2000 counts | High rate bins dominated by noise | Noise dominated (total time) | Noise dominated (detector-on time) | Marked lightcurve |
|---|---|---|---|---|---|---|---|
| A | 7440 | 6266 | 11 | 11 | 0.15% | 0.18% | 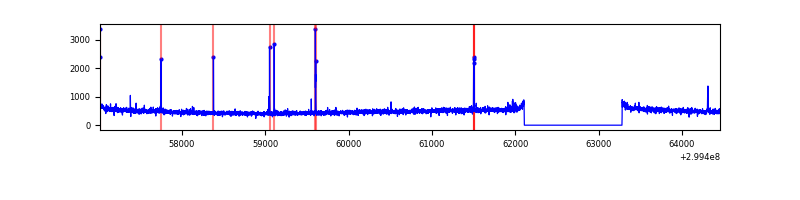 |
| B | 7440 | 6266 | 13 | 13 | 0.17% | 0.21% | 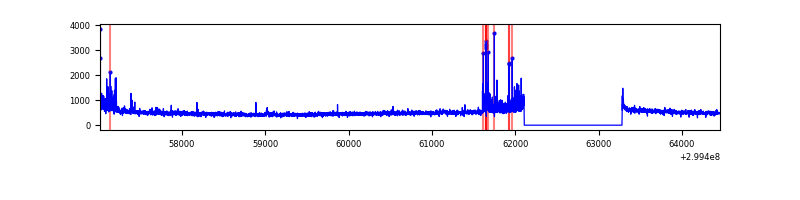 |
| C | 7440 | 6266 | 0 | 0 | 0.00% | 0.00% | 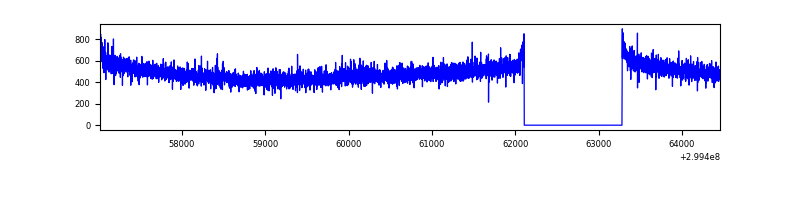 |
| D | 7440 | 6266 | 320 | 320 | 4.30% | 5.11% | 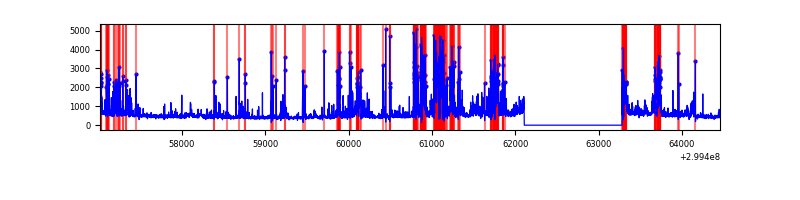 |
Top three noisy pixels from each quadrant. If the there are fewer than three noisy pixels in the level2.evt file, extra rows are filled as -1
| Pixel properties | Quadrant properties | ||||||
|---|---|---|---|---|---|---|---|
| Quadrant | DetID | PixID | Counts | Sigma | Mean | Median | Sigma |
| A | 14 | 238 | 36375 | 229.82 | 772 | 757 | 155.0 |
| A | 8 | 205 | 31878 | 200.8 | 772 | 757 | 155.0 |
| A | 4 | 2 | 31034 | 195.36 | 772 | 757 | 155.0 |
| B | 7 | 220 | 104548 | 710.2 | 774 | 755 | 146.1 |
| B | 0 | 197 | 54302 | 366.39 | 774 | 755 | 146.1 |
| B | 4 | 142 | 29768 | 198.52 | 774 | 755 | 146.1 |
| C | 14 | 238 | 116731 | 666.37 | 743 | 749 | 174.1 |
| C | 3 | 233 | 18936 | 104.49 | 743 | 749 | 174.1 |
| C | 13 | 61 | 5191 | 25.52 | 743 | 749 | 174.1 |
| D | 1 | 52 | 1264144 | 7241.72 | 721 | 701 | 174.5 |
| D | 12 | 218 | 413762 | 2367.55 | 721 | 701 | 174.5 |
| D | 11 | 176 | 56141 | 317.77 | 721 | 701 | 174.5 |
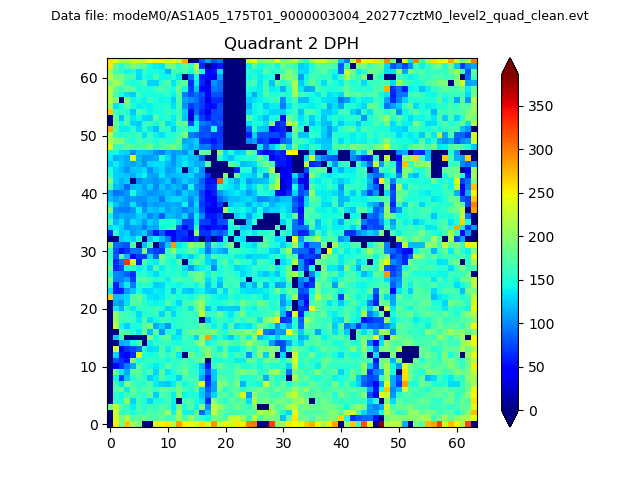
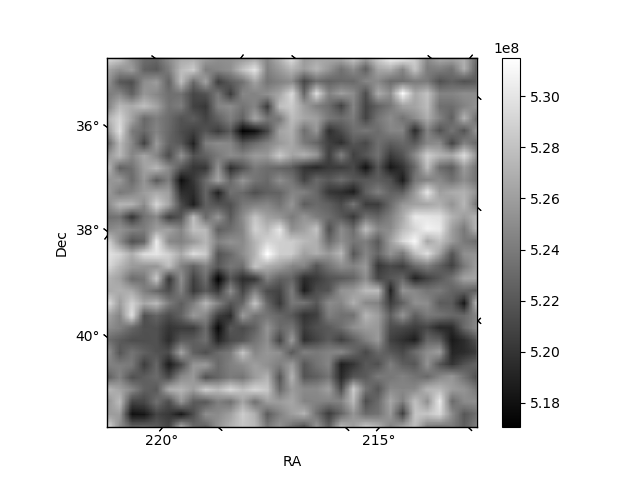
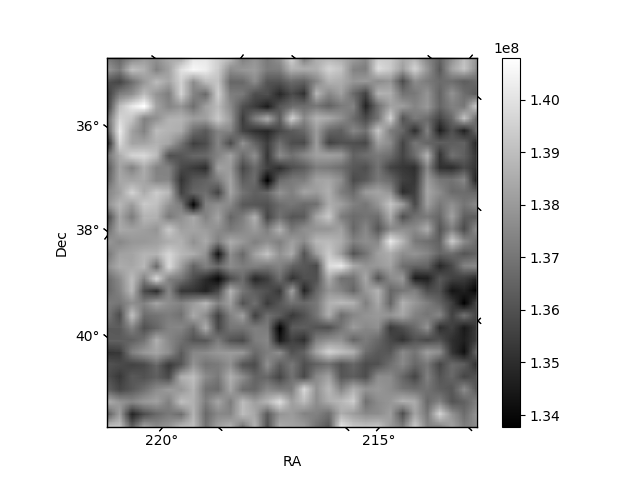
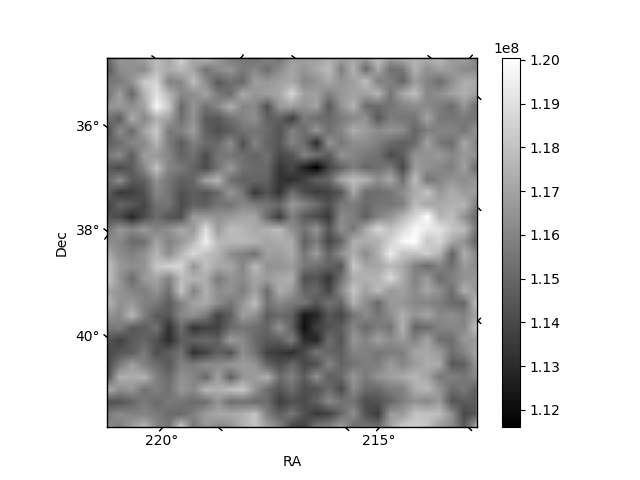
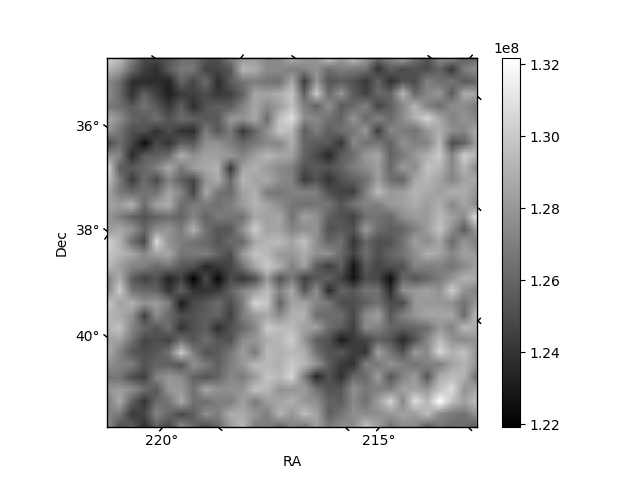
Histogram calculated using DETX and DETY for each event in the final _common_clean file
| Quadrant A | 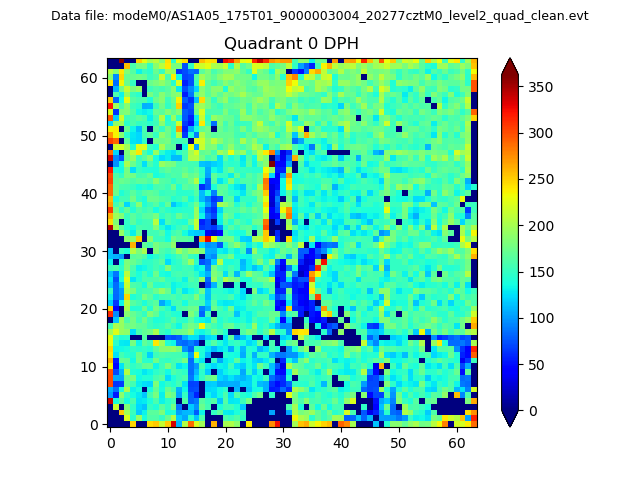 |
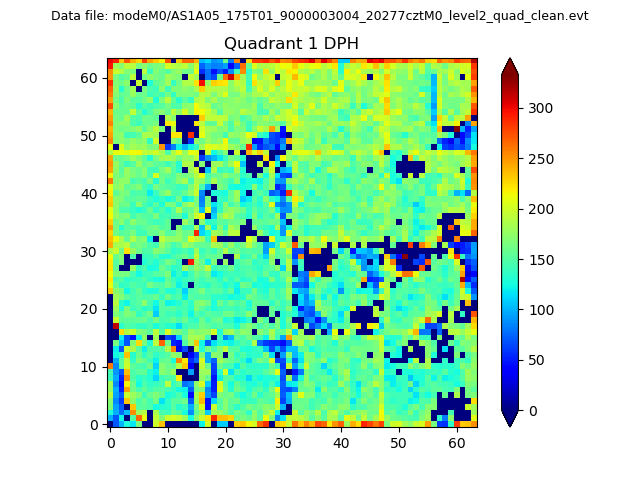 |
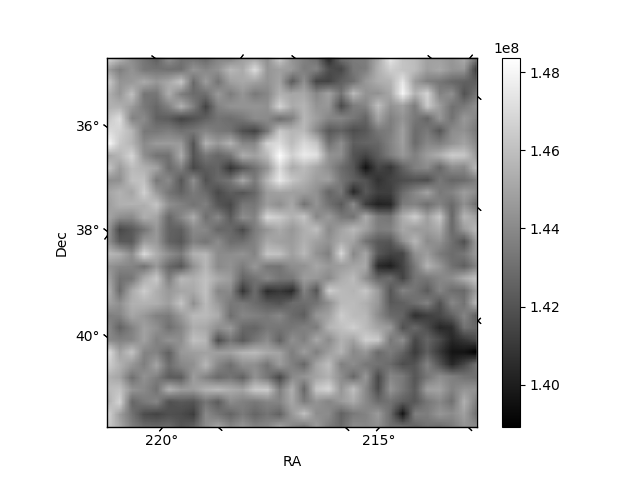
Quadrant B |
|---|---|---|---|
| Quadrant D | 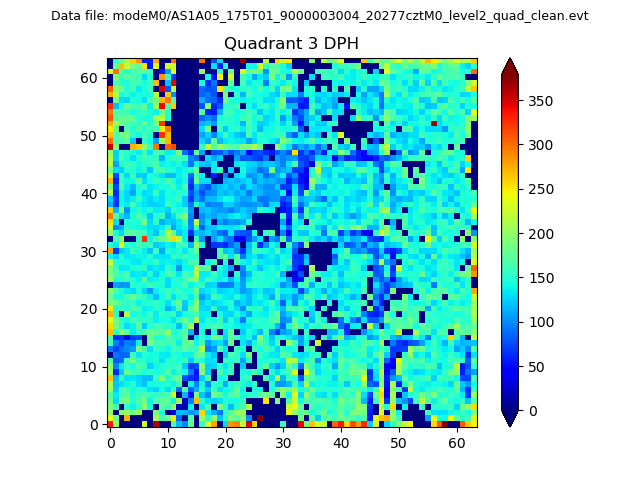 |
 |
Quadrant C |
| Plot type | Count rate plots | Images |
|---|---|---|
| Comparison with Poisson distribution Blue bars denote a histogram of data divided into 1 sec bins. Red curve is a Poisson curve with rate = median count rate of data. |
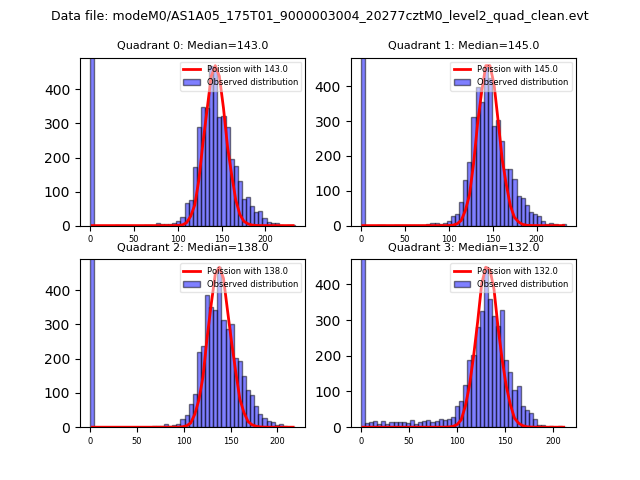 |
 |
| Quadrant-wise count rates Data is divided into 100 sec bins |
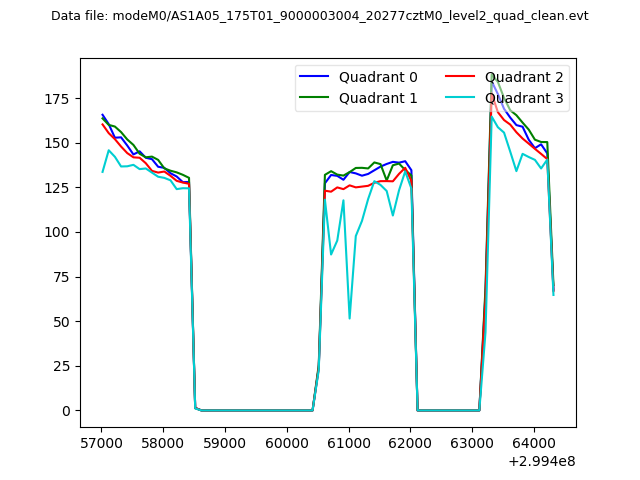 |
|
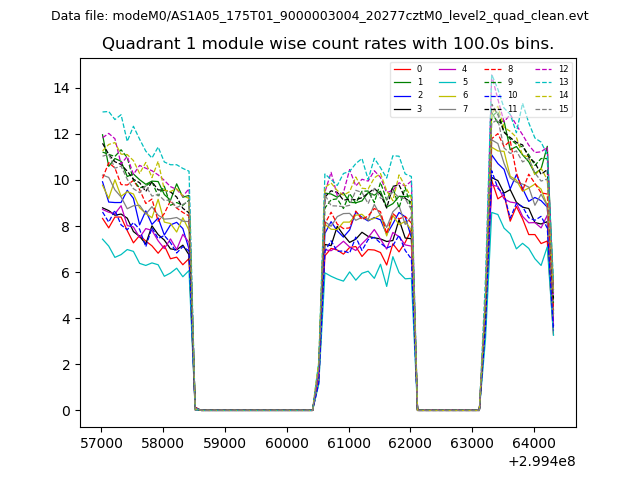
| Module-wise count rates for Quadrant A Data is divided into 100 sec bins |
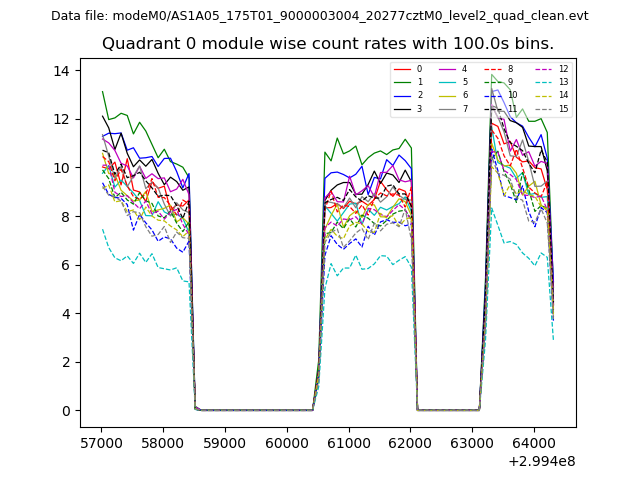 |
 |
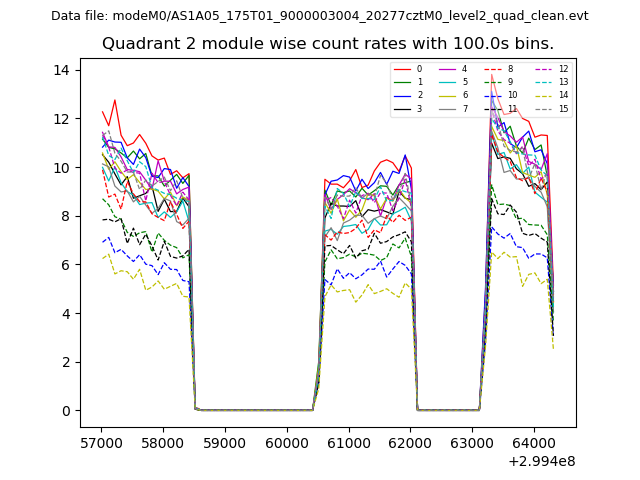
| Module-wise count rates for Quadrant B Data is divided into 100 sec bins |
 |
 |
| Module-wise count rates for Quadrant C Data is divided into 100 sec bins |
 |
 |
| Module-wise count rates for Quadrant D Data is divided into 100 sec bins |
 |
 |
| Parameter | Plot |
|---|---|
| CZT HV Monitor | 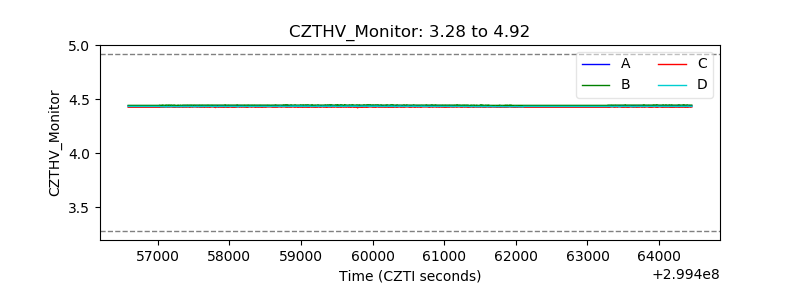 |
| D_VDD | 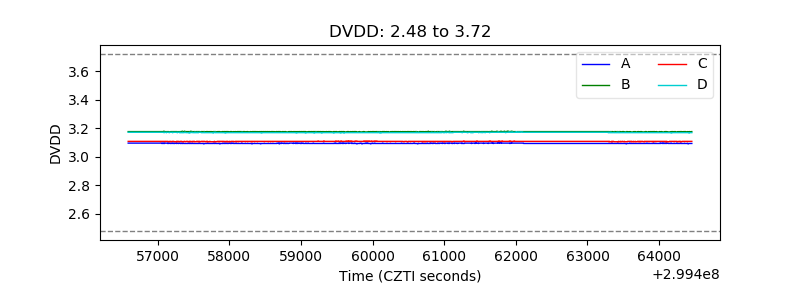 |
| Temperature 1 | 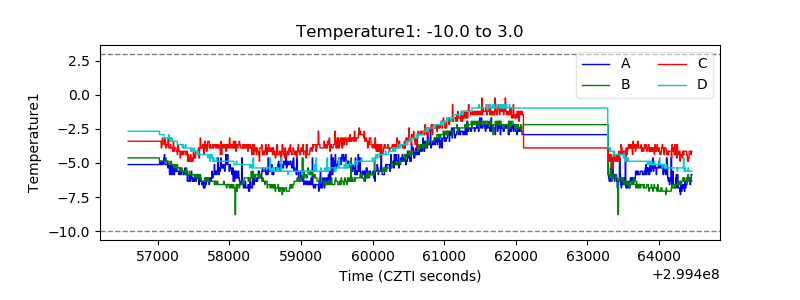 |
| Veto HV Monitor | 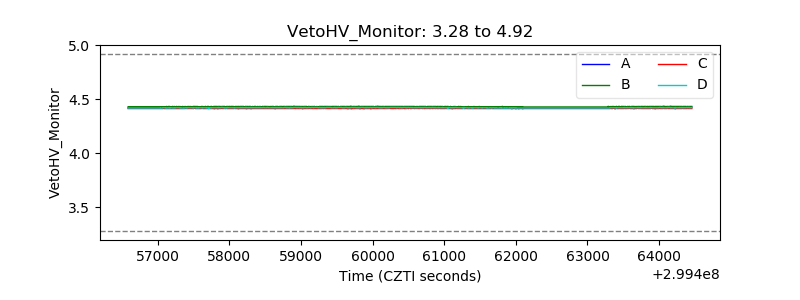 |
| Veto LLD | 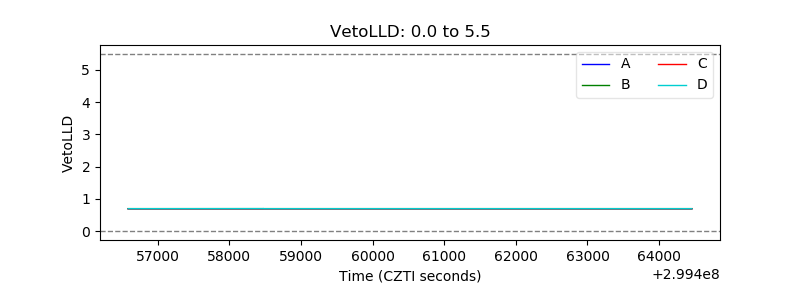 |
| Alpha Counter | 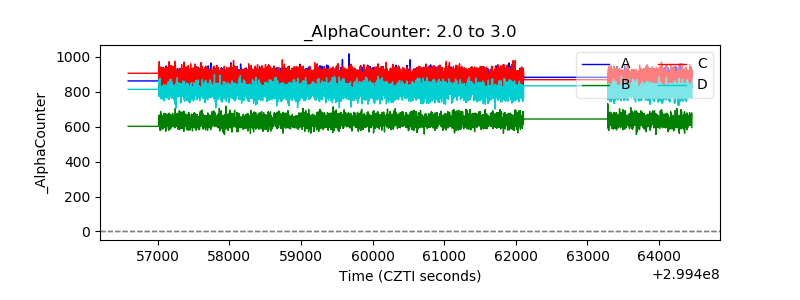 |
| _CPM_Rate | 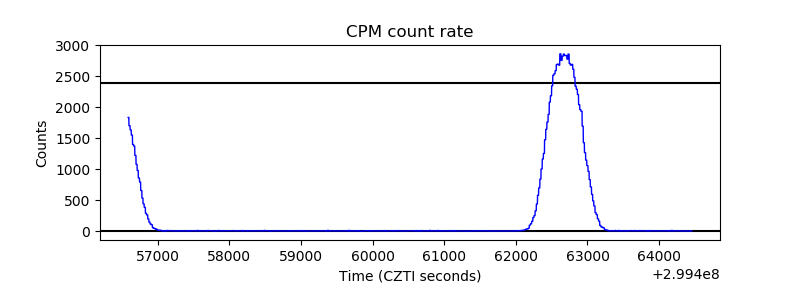 |
| CZT Counter | 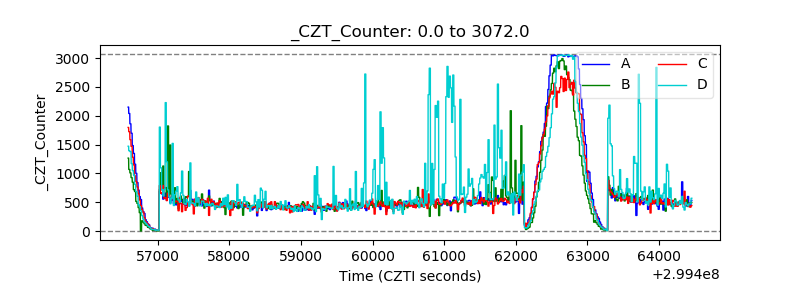 |
| +2.5 Volts monitor | 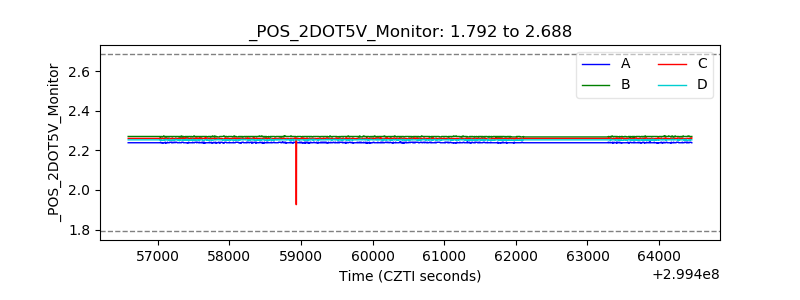 |
| +5 Volts monitor | 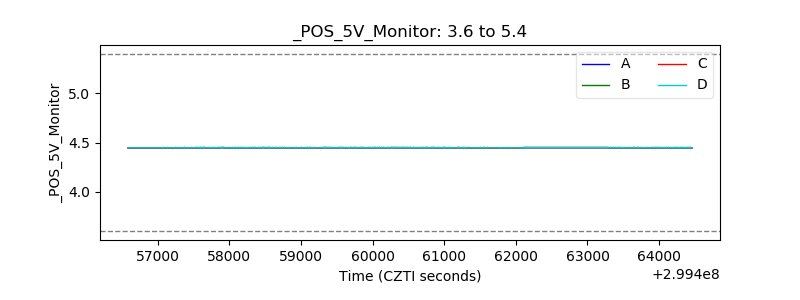 |
| _ROLL_ROT | 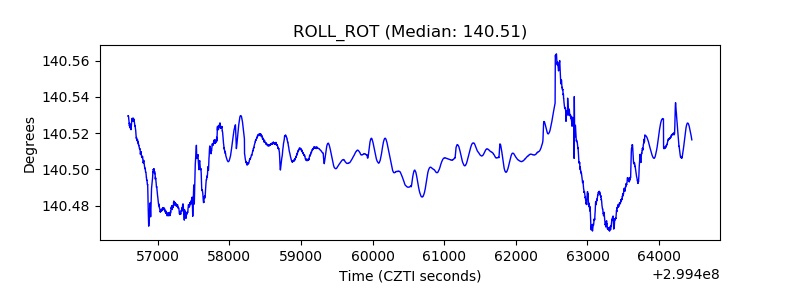 |
| _Roll_DEC | 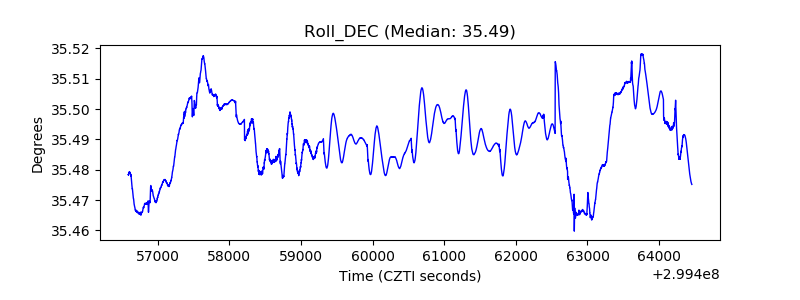 |
| _Roll_RA | 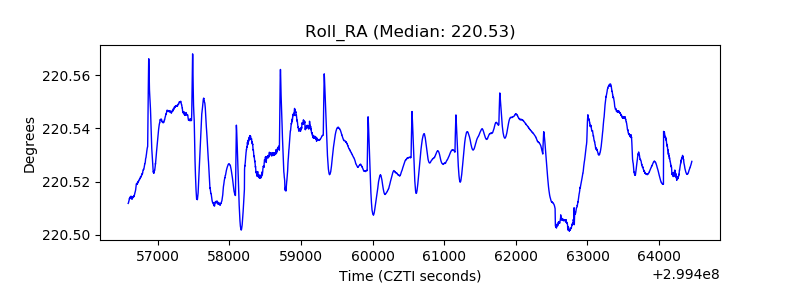 |
| Veto Counter | 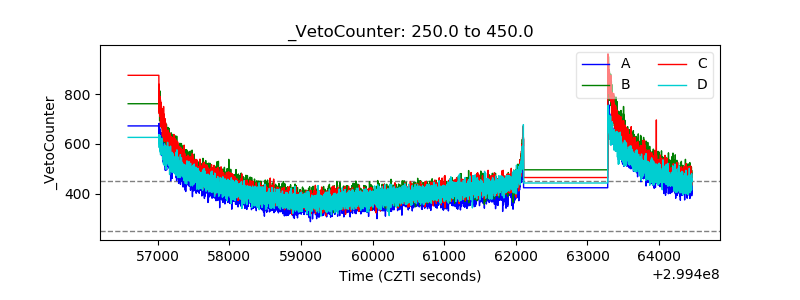 |