| Param | Original file | Final file |
|---|---|---|
| Filename | modeM0/AS1A05_174T01_9000003008cztM0_level2.fits | modeM0/AS1A05_174T01_9000003008cztM0_level2_quad_clean.evt |
| Size (bytes) | 2,627,187,840 | 2,330,801,280 |
| Size | 2.4 GB | 2.2 GB |
| Events in quadrant A | 16,078,442 | 13,658,247 |
| Events in quadrant B | 15,443,640 | 13,752,054 |
| Events in quadrant C | 15,913,228 | 12,988,837 |
| Events in quadrant D | 13,695,540 | 11,763,152 |
| Mode M9 | |||
|---|---|---|---|
| Quadrant | BADHDUFLAG | Total packets | Discarded packets |
| A | 0 | 450 | 0 |
| B | 0 | 451 | 0 |
| C | 0 | 451 | 0 |
| D | 0 | 451 | 0 |
| Mode M0 | |||
|---|---|---|---|
| Quadrant | BADHDUFLAG | Total packets | Discarded packets |
| A | 0 | 576540 | 0 |
| B | 0 | 604571 | 0 |
| C | 0 | 616276 | 0 |
| D | 0 | 700681 | 0 |
| Mode SS | |||
|---|---|---|---|
| Quadrant | BADHDUFLAG | Total packets | Discarded packets |
| A | 0 | 5522 | 0 |
| B | 0 | 5526 | 0 |
| C | 0 | 5528 | 0 |
| D | 0 | 5524 | 0 |
| Quadrant | Total seconds | Saturated seconds | Saturation percentage |
|---|---|---|---|
| A | 268882 | 4704 | 1.749466% |
| B | 268910 | 7645 | 2.842959% |
| C | 268890 | 7153 | 2.660196% |
| D | 268881 | 13644 | 5.074364% |
Noise dominated data is calculated using 1-second bins in cleaned event files. If a bin has >2000 counts, and if more than 50% of those come from <1% of pixels, then it is considered to be noise-dominated and hence unusable.
| Quadrant | # 1 sec bins | Bins with >0 counts | Bins with >2000 counts | High rate bins dominated by noise | Noise dominated (total time) | Noise dominated (detector-on time) | Marked lightcurve |
|---|---|---|---|---|---|---|---|
| A | 328867 | 268956 | 0 | 0 | 0.00% | 0.00% |  |
| B | 328867 | 268981 | 0 | 0 | 0.00% | 0.00% |  |
| C | 328867 | 268982 | 0 | 0 | 0.00% | 0.00% |  |
| D | 328867 | 268397 | 0 | 0 | 0.00% | 0.00% | 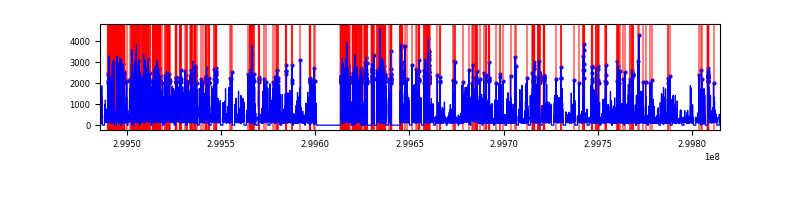 |
Top three noisy pixels from each quadrant. If the there are fewer than three noisy pixels in the level2.evt file, extra rows are filled as -1
| Pixel properties | Quadrant properties | ||||||
|---|---|---|---|---|---|---|---|
| Quadrant | DetID | PixID | Counts | Sigma | Mean | Median | Sigma |
| A | 0 | 29 | 15686 | 11.51 | 4191 | 3928 | 1021.3 |
| A | 7 | 110 | 12835 | 8.72 | 4191 | 3928 | 1021.3 |
| A | 9 | 19 | 12142 | 8.04 | 4191 | 3928 | 1021.3 |
| B | 3 | 17 | 10218 | 8.07 | 4078 | 3885 | 784.6 |
| B | 5 | 128 | 10136 | 7.97 | 4078 | 3885 | 784.6 |
| B | 5 | 225 | 9977 | 7.76 | 4078 | 3885 | 784.6 |
| C | 1 | 81 | 12340 | 7.88 | 4200 | 3927 | 1068.3 |
| C | 1 | 80 | 12255 | 7.8 | 4200 | 3927 | 1068.3 |
| C | 12 | 241 | 11056 | 6.67 | 4200 | 3927 | 1068.3 |
| D | 3 | 14 | 9915 | 6.12 | 3920 | 3572 | 1036.6 |
| D | 6 | 231 | 9707 | 5.92 | 3920 | 3572 | 1036.6 |
| D | 7 | 3 | 9671 | 5.88 | 3920 | 3572 | 1036.6 |
Histogram calculated using DETX and DETY for each event in the final _common_clean file
| Quadrant A | 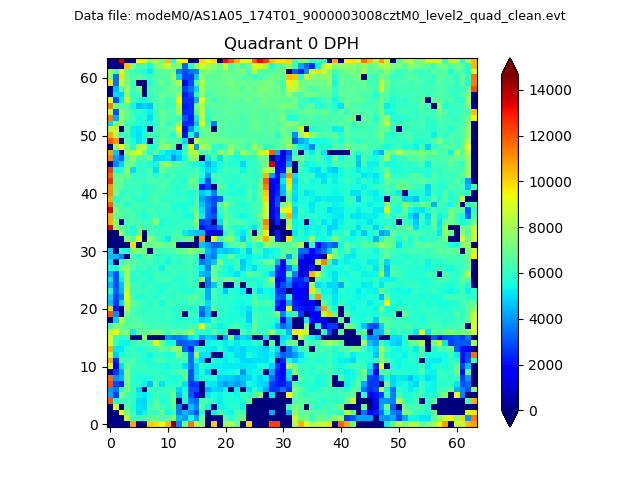 |
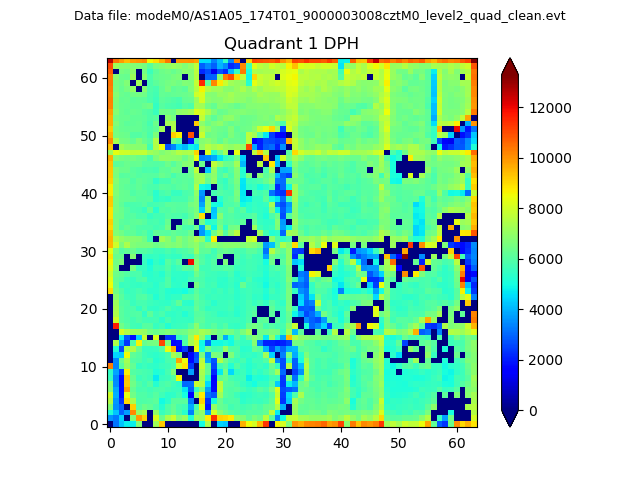 |
Quadrant B |
|---|---|---|---|
| Quadrant D | 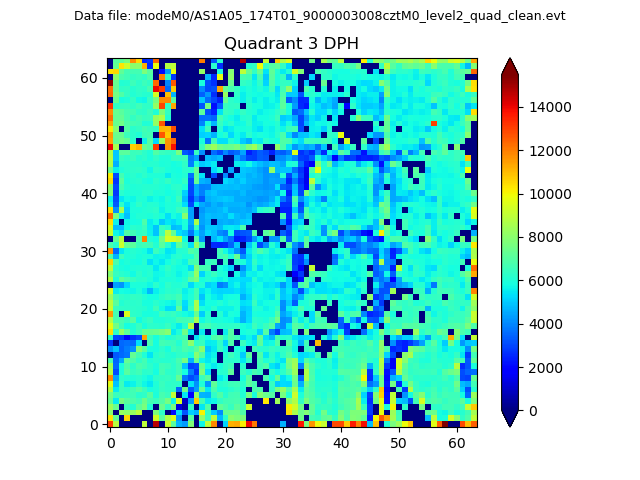 |
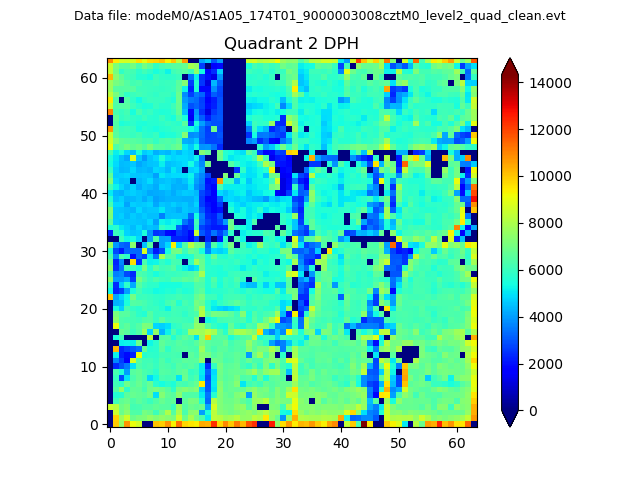 |
Quadrant C |
| Plot type | Count rate plots | Images |
|---|---|---|
| Comparison with Poisson distribution Blue bars denote a histogram of data divided into 1 sec bins. Red curve is a Poisson curve with rate = median count rate of data. |
 |
 |
| Quadrant-wise count rates Data is divided into 100 sec bins |
 |
|
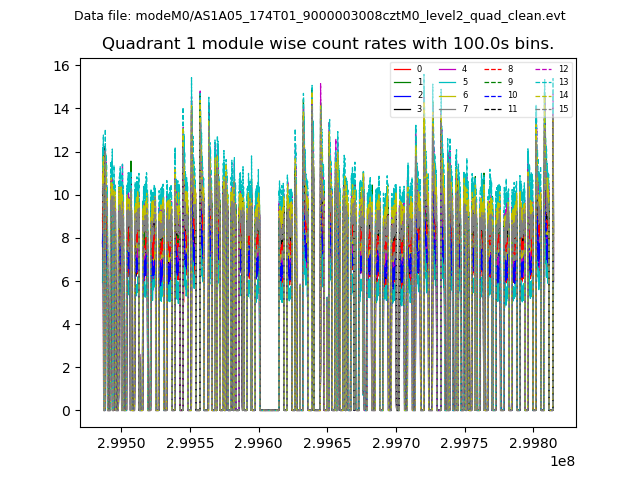
| Module-wise count rates for Quadrant A Data is divided into 100 sec bins |
 |
 |
| Module-wise count rates for Quadrant B Data is divided into 100 sec bins |
 |
 |
| Module-wise count rates for Quadrant C Data is divided into 100 sec bins |
 |
 |
| Module-wise count rates for Quadrant D Data is divided into 100 sec bins |
 |
 |
| Parameter | Plot |
|---|---|
| CZT HV Monitor |  |
| D_VDD | 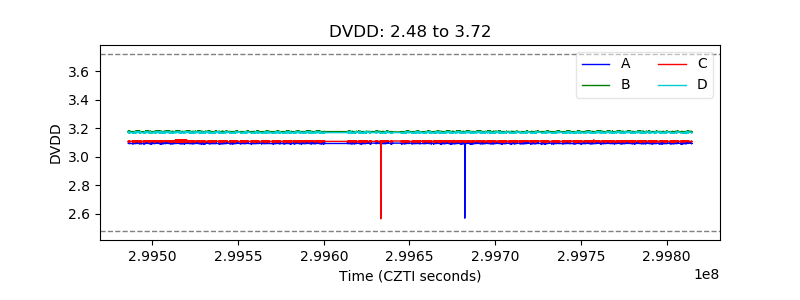 |
| Temperature 1 |  |
| Veto HV Monitor |  |
| Veto LLD |  |
| Alpha Counter |  |
| _CPM_Rate |  |
| CZT Counter |  |
| +2.5 Volts monitor |  |
| +5 Volts monitor | 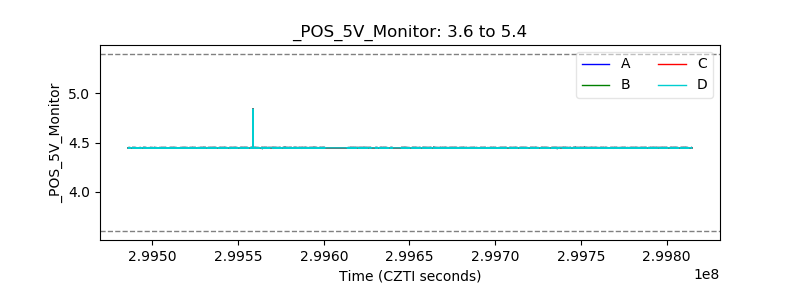 |
| _ROLL_ROT |  |
| _Roll_DEC |  |
| _Roll_RA | 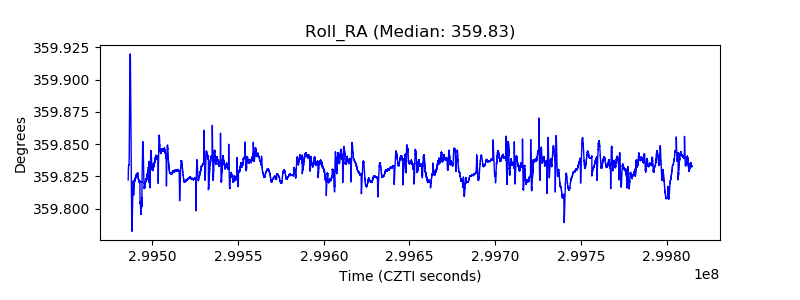 |
| Veto Counter | 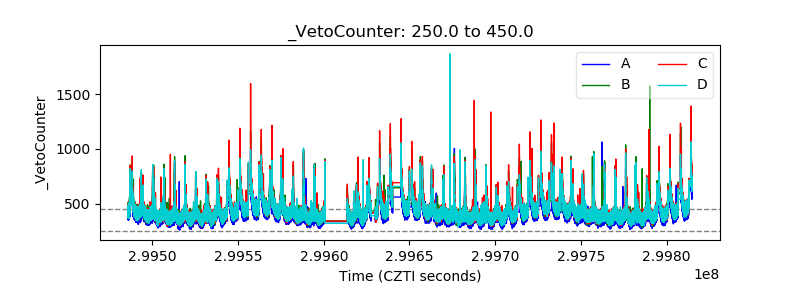 |