| Param | Original file | Final file |
|---|---|---|
| Filename | modeM0/AS1A05_174T01_9000003008_20282cztM0_level2.evt | modeM0/AS1A05_174T01_9000003008_20282cztM0_level2_quad_clean.evt |
| Size (bytes) | 590,601,600 | 84,957,120 |
| Size | 563.2 MB | 81.0 MB |
| Events in quadrant A | 3,559,782 | 526,947 |
| Events in quadrant B | 4,046,770 | 538,360 |
| Events in quadrant C | 3,455,424 | 518,270 |
| Events in quadrant D | 6,349,558 | 501,133 |
| Mode M9 | |||
|---|---|---|---|
| Quadrant | BADHDUFLAG | Total packets | Discarded packets |
| A | 0 | 6 | 0 |
| B | 0 | 6 | 0 |
| C | 0 | 6 | 0 |
| D | 0 | 6 | 0 |
| Mode M0 | |||
|---|---|---|---|
| Quadrant | BADHDUFLAG | Total packets | Discarded packets |
| A | 0 | 14900 | 1 |
| B | 0 | 16367 | 1 |
| C | 0 | 14461 | 1 |
| D | 0 | 23543 | 1 |
| Mode SS | |||
|---|---|---|---|
| Quadrant | BADHDUFLAG | Total packets | Discarded packets |
| A | 0 | 140 | 0 |
| B | 0 | 140 | 0 |
| C | 0 | 140 | 0 |
| D | 0 | 140 | 0 |
| Quadrant | Total seconds | Saturated seconds | Saturation percentage |
|---|---|---|---|
| A | 7007 | 170 | 2.426145% |
| B | 7007 | 316 | 4.509776% |
| C | 7006 | 157 | 2.240936% |
| D | 7007 | 1010 | 14.414157% |
Noise dominated data is calculated using 1-second bins in cleaned event files. If a bin has >2000 counts, and if more than 50% of those come from <1% of pixels, then it is considered to be noise-dominated and hence unusable.
| Quadrant | # 1 sec bins | Bins with >0 counts | Bins with >2000 counts | High rate bins dominated by noise | Noise dominated (total time) | Noise dominated (detector-on time) | Marked lightcurve |
|---|---|---|---|---|---|---|---|
| A | 7542 | 7008 | 9 | 9 | 0.12% | 0.13% | 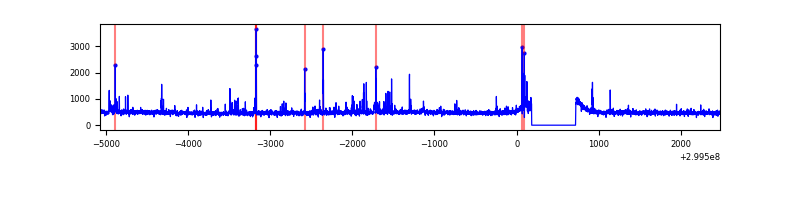 |
| B | 7542 | 7008 | 112 | 112 | 1.49% | 1.60% | 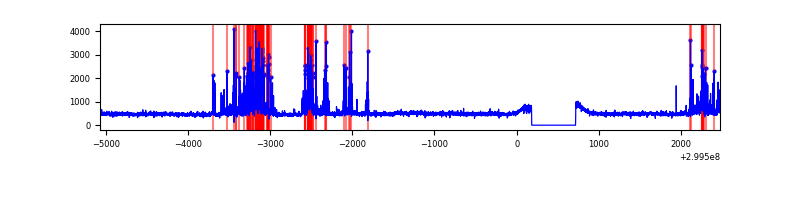 |
| C | 7541 | 7007 | 0 | 0 | 0.00% | 0.00% | 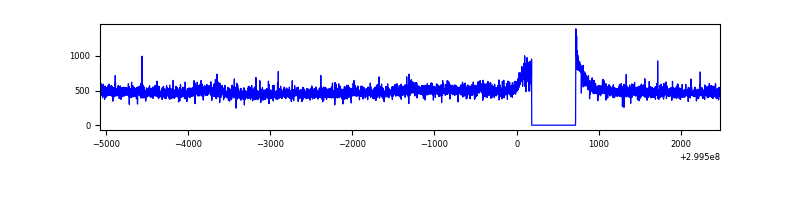 |
| D | 7542 | 7008 | 807 | 807 | 10.70% | 11.52% | 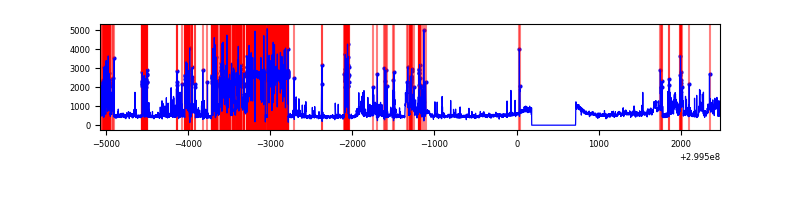 |
Top three noisy pixels from each quadrant. If the there are fewer than three noisy pixels in the level2.evt file, extra rows are filled as -1
| Pixel properties | Quadrant properties | ||||||
|---|---|---|---|---|---|---|---|
| Quadrant | DetID | PixID | Counts | Sigma | Mean | Median | Sigma |
| A | 14 | 238 | 116026 | 666.76 | 854 | 834 | 172.8 |
| A | 4 | 2 | 88998 | 510.32 | 854 | 834 | 172.8 |
| A | 8 | 205 | 43529 | 247.13 | 854 | 834 | 172.8 |
| B | 4 | 142 | 349348 | 2135.85 | 841 | 818 | 163.2 |
| B | 7 | 220 | 274217 | 1675.44 | 841 | 818 | 163.2 |
| B | 0 | 197 | 60335 | 364.73 | 841 | 818 | 163.2 |
| C | 14 | 238 | 128926 | 663.61 | 824 | 830 | 193.0 |
| C | 3 | 233 | 82242 | 421.76 | 824 | 830 | 193.0 |
| C | 7 | 220 | 23675 | 118.35 | 824 | 830 | 193.0 |
| D | 1 | 52 | 3258204 | 17051.49 | 786 | 764 | 191.0 |
| D | 2 | 234 | 44726 | 230.12 | 786 | 764 | 191.0 |
| D | 7 | 238 | 36662 | 187.91 | 786 | 764 | 191.0 |
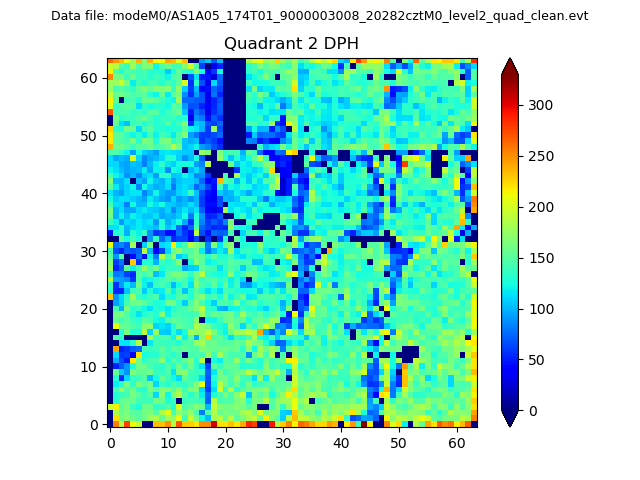
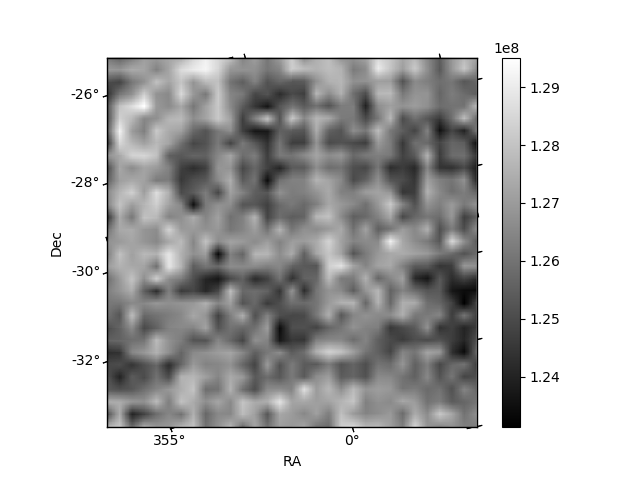
Histogram calculated using DETX and DETY for each event in the final _common_clean file
| Quadrant A |  |
 |
Quadrant B |
|---|---|---|---|
| Quadrant D | 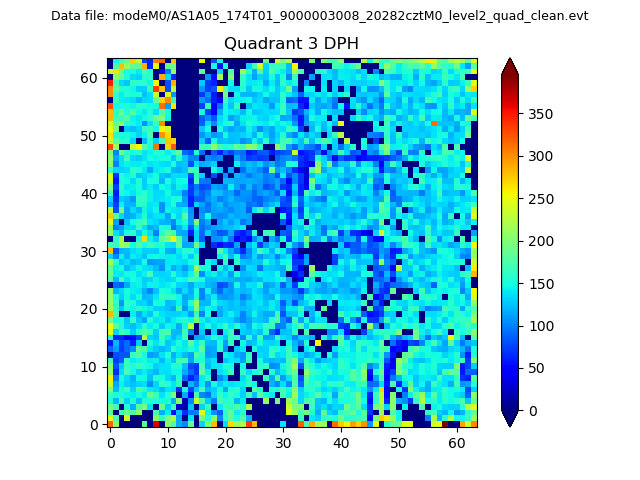 |
 |
Quadrant C |
| Plot type | Count rate plots | Images |
|---|---|---|
| Comparison with Poisson distribution Blue bars denote a histogram of data divided into 1 sec bins. Red curve is a Poisson curve with rate = median count rate of data. |
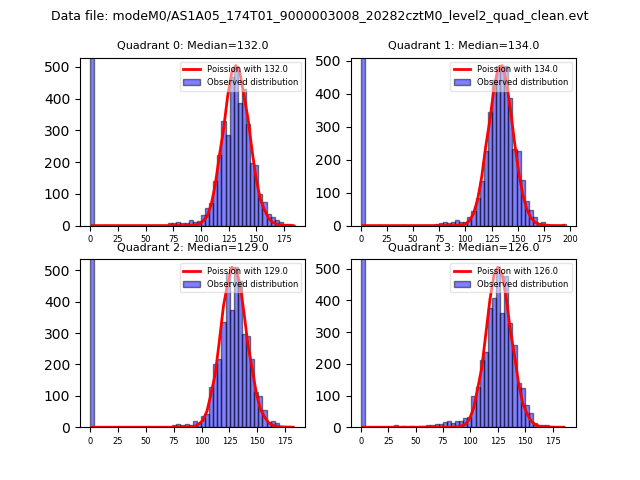 |
 |
| Quadrant-wise count rates Data is divided into 100 sec bins |
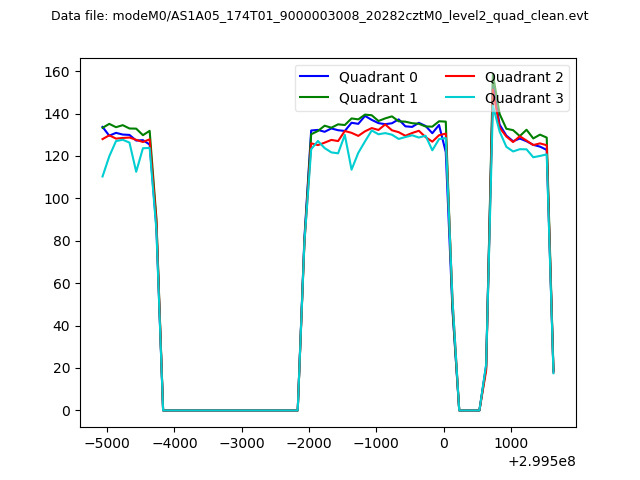 |
|
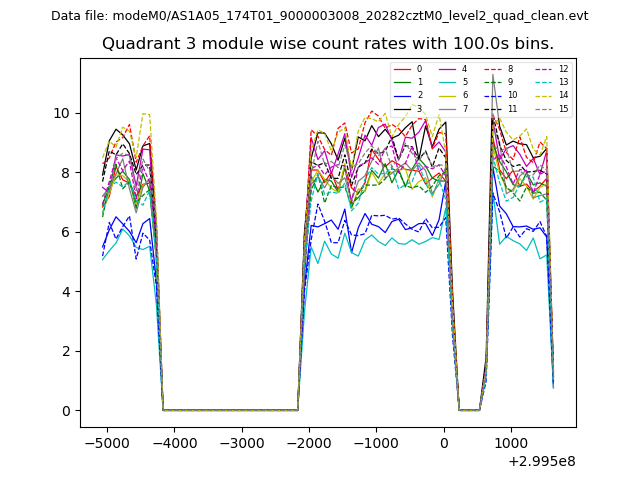
| Module-wise count rates for Quadrant A Data is divided into 100 sec bins |
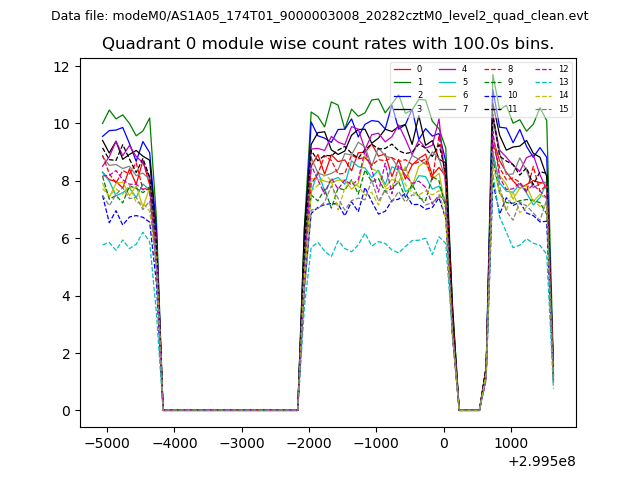 |
 |
| Module-wise count rates for Quadrant B Data is divided into 100 sec bins |
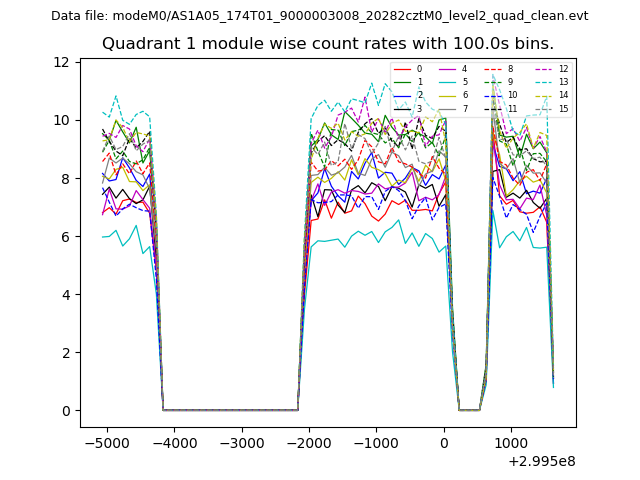 |
 |
| Module-wise count rates for Quadrant C Data is divided into 100 sec bins |
 |
 |
| Module-wise count rates for Quadrant D Data is divided into 100 sec bins |
 |
 |
| Parameter | Plot |
|---|---|
| CZT HV Monitor | 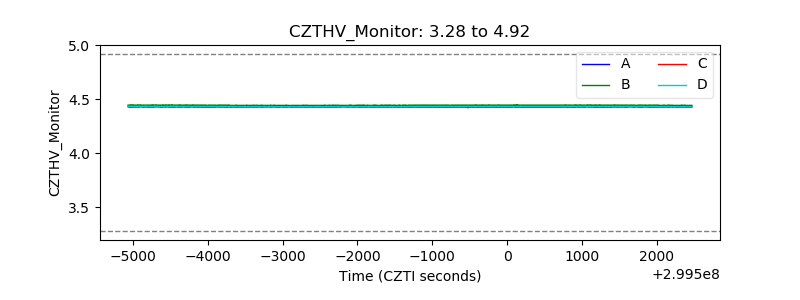 |
| D_VDD | 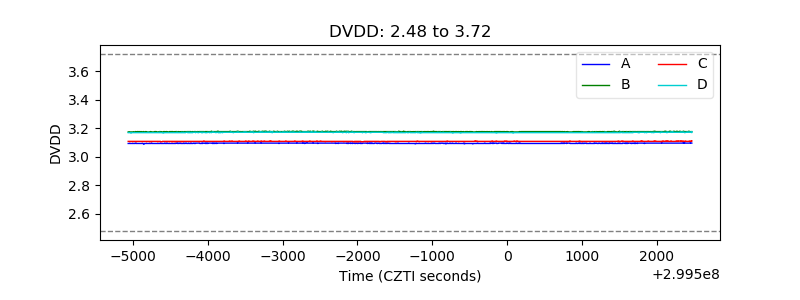 |
| Temperature 1 | 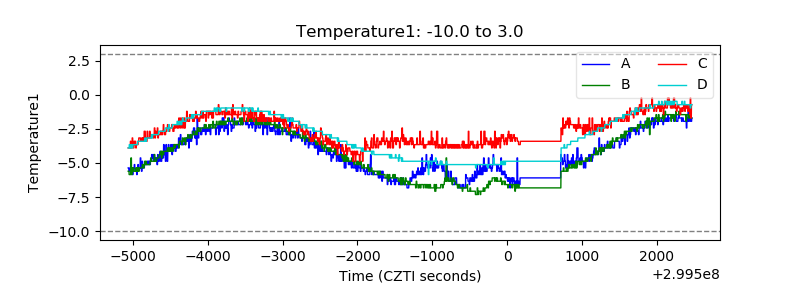 |
| Veto HV Monitor | 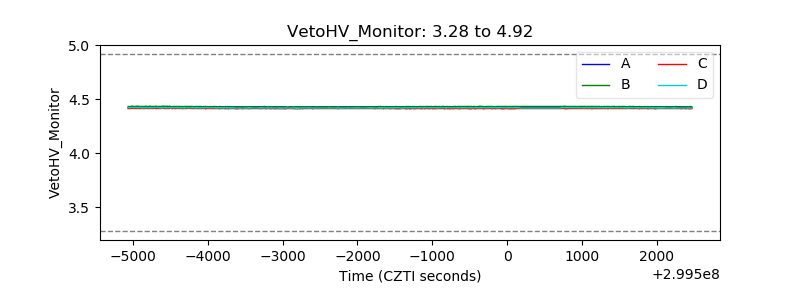 |
| Veto LLD | 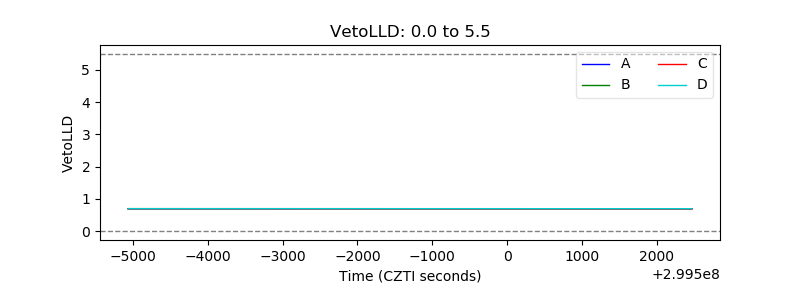 |
| Alpha Counter | 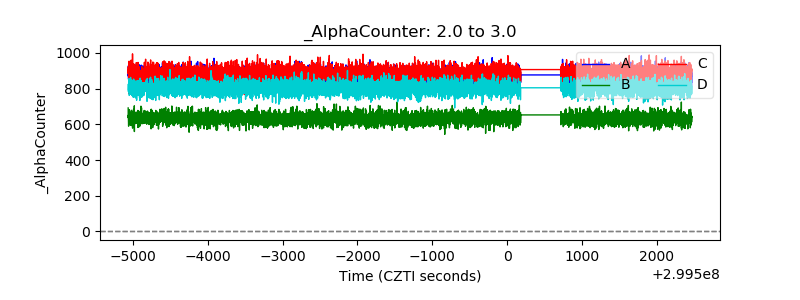 |
| _CPM_Rate | 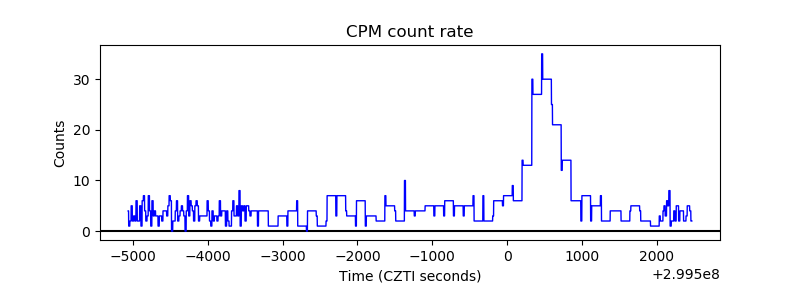 |
| CZT Counter | 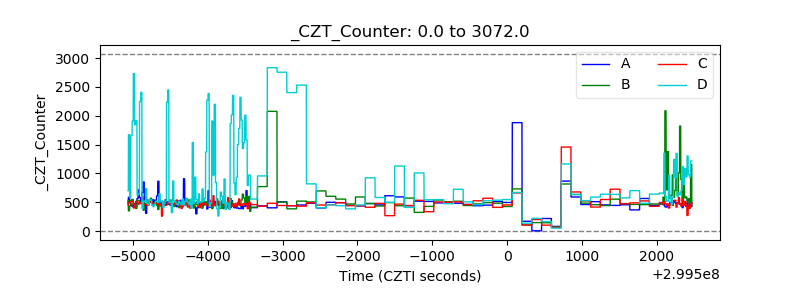 |
| +2.5 Volts monitor |  |
| +5 Volts monitor |  |
| _ROLL_ROT | 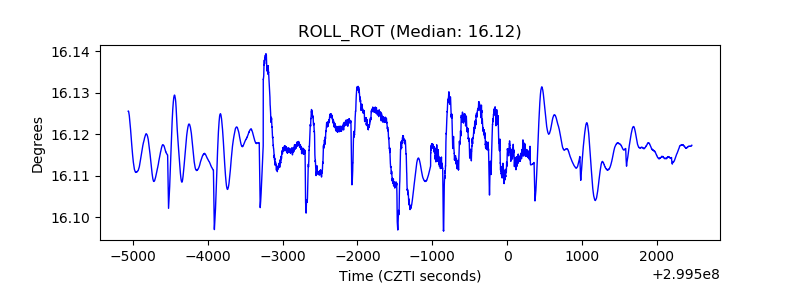 |
| _Roll_DEC | 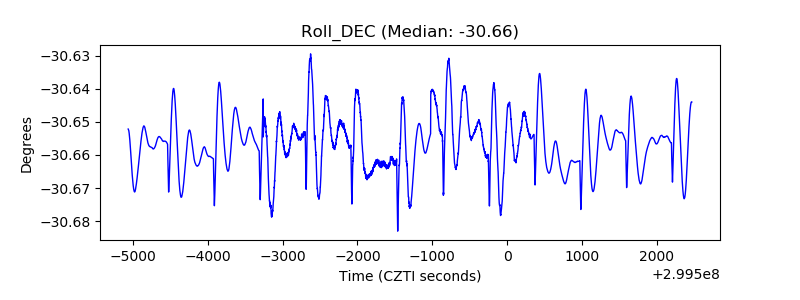 |
| _Roll_RA | 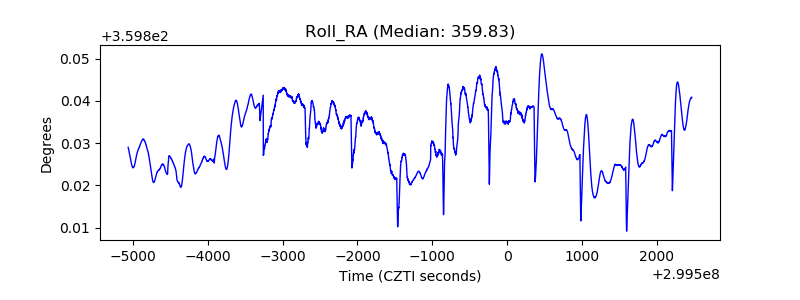 |
| Veto Counter | 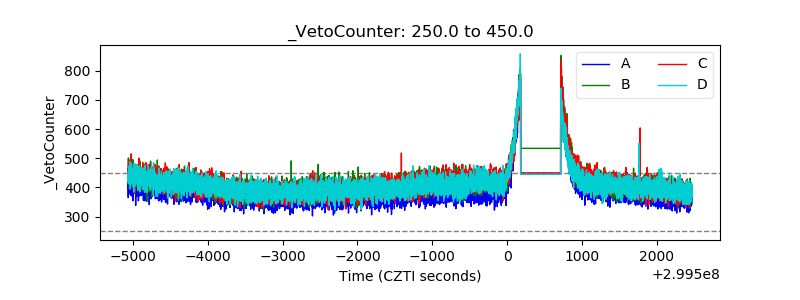 |