| Param | Original file | Final file |
|---|---|---|
| Filename | modeM0/AS1A05_174T01_9000003008_20284cztM0_level2.evt | modeM0/AS1A05_174T01_9000003008_20284cztM0_level2_quad_clean.evt |
| Size (bytes) | 639,616,320 | 73,866,240 |
| Size | 610.0 MB | 70.4 MB |
| Events in quadrant A | 3,655,845 | 443,132 |
| Events in quadrant B | 4,152,007 | 447,586 |
| Events in quadrant C | 3,811,585 | 432,614 |
| Events in quadrant D | 7,265,743 | 413,426 |
| Mode M9 | |||
|---|---|---|---|
| Quadrant | BADHDUFLAG | Total packets | Discarded packets |
| A | 0 | 4 | 0 |
| B | 0 | 4 | 0 |
| C | 0 | 4 | 0 |
| D | 0 | 4 | 0 |
| Mode M0 | |||
|---|---|---|---|
| Quadrant | BADHDUFLAG | Total packets | Discarded packets |
| A | 0 | 15442 | 1 |
| B | 0 | 16962 | 1 |
| C | 0 | 15637 | 1 |
| D | 0 | 26610 | 2 |
| Mode SS | |||
|---|---|---|---|
| Quadrant | BADHDUFLAG | Total packets | Discarded packets |
| A | 0 | 144 | 0 |
| B | 0 | 144 | 0 |
| C | 0 | 144 | 0 |
| D | 0 | 144 | 0 |
| Quadrant | Total seconds | Saturated seconds | Saturation percentage |
|---|---|---|---|
| A | 7181 | 150 | 2.088846% |
| B | 7182 | 248 | 3.453077% |
| C | 7182 | 150 | 2.088555% |
| D | 7181 | 722 | 10.054310% |
Noise dominated data is calculated using 1-second bins in cleaned event files. If a bin has >2000 counts, and if more than 50% of those come from <1% of pixels, then it is considered to be noise-dominated and hence unusable.
| Quadrant | # 1 sec bins | Bins with >0 counts | Bins with >2000 counts | High rate bins dominated by noise | Noise dominated (total time) | Noise dominated (detector-on time) | Marked lightcurve |
|---|---|---|---|---|---|---|---|
| A | 7527 | 7182 | 29 | 29 | 0.39% | 0.40% | 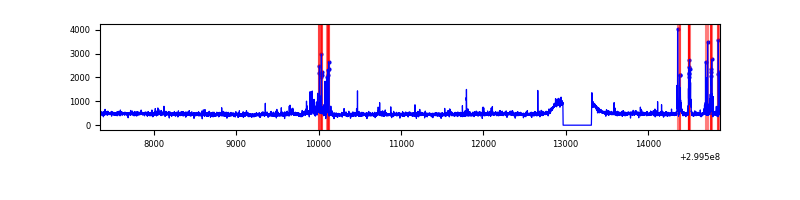 |
| B | 7528 | 7183 | 70 | 70 | 0.93% | 0.97% | 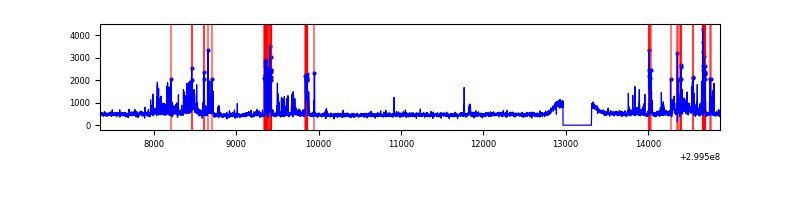 |
| C | 7528 | 7183 | 22 | 22 | 0.29% | 0.31% | 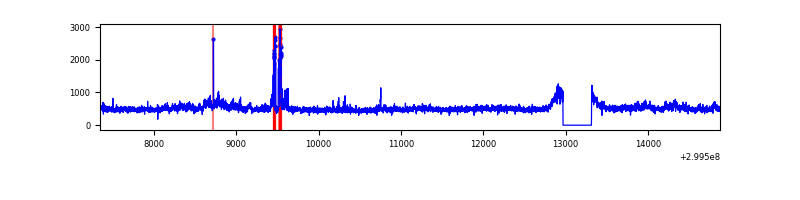 |
| D | 7527 | 7182 | 587 | 587 | 7.80% | 8.17% | 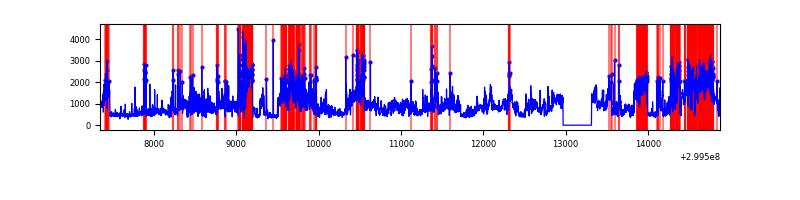 |
Top three noisy pixels from each quadrant. If the there are fewer than three noisy pixels in the level2.evt file, extra rows are filled as -1
| Pixel properties | Quadrant properties | ||||||
|---|---|---|---|---|---|---|---|
| Quadrant | DetID | PixID | Counts | Sigma | Mean | Median | Sigma |
| A | 14 | 238 | 88437 | 494.23 | 870 | 851 | 177.2 |
| A | 14 | 254 | 73691 | 411.02 | 870 | 851 | 177.2 |
| A | 9 | 143 | 52209 | 289.8 | 870 | 851 | 177.2 |
| B | 4 | 142 | 339971 | 2051.32 | 861 | 838 | 165.3 |
| B | 0 | 190 | 112011 | 672.45 | 861 | 838 | 165.3 |
| B | 7 | 220 | 91632 | 549.19 | 861 | 838 | 165.3 |
| C | 3 | 233 | 406618 | 2053.19 | 835 | 841 | 197.6 |
| C | 14 | 238 | 129365 | 650.32 | 835 | 841 | 197.6 |
| C | 8 | 208 | 7457 | 33.48 | 835 | 841 | 197.6 |
| D | 1 | 52 | 3826534 | 18701.85 | 833 | 807 | 204.6 |
| D | 5 | 222 | 227894 | 1110.1 | 833 | 807 | 204.6 |
| D | 2 | 234 | 43540 | 208.9 | 833 | 807 | 204.6 |
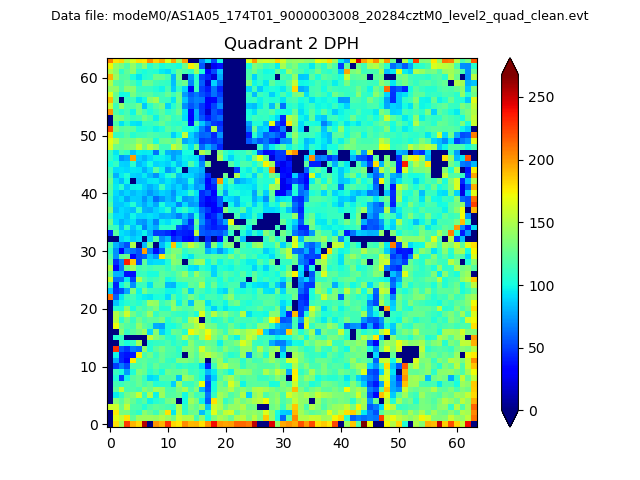
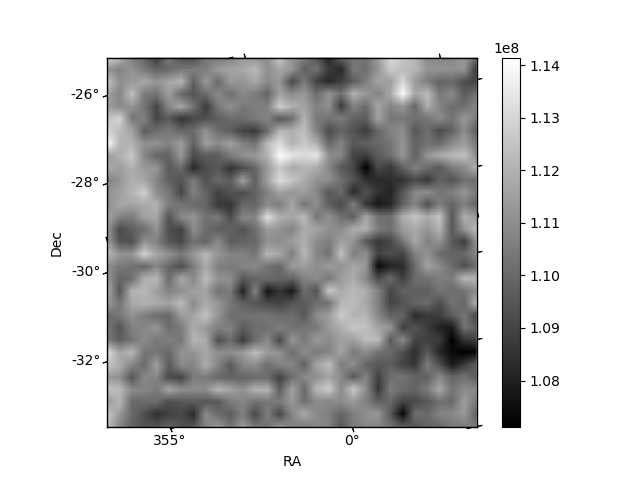
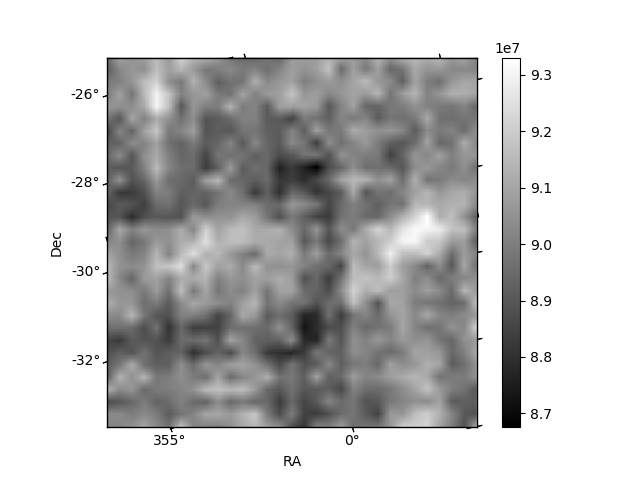
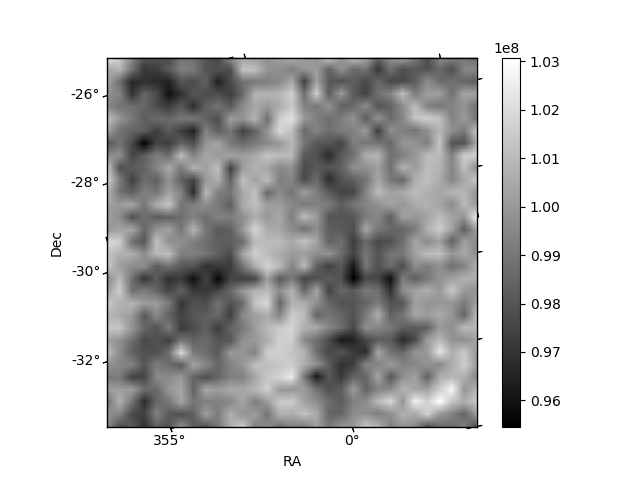
Histogram calculated using DETX and DETY for each event in the final _common_clean file
| Quadrant A | 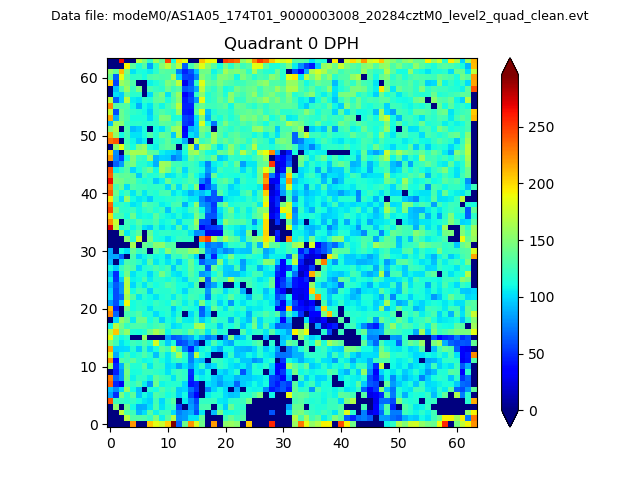 |
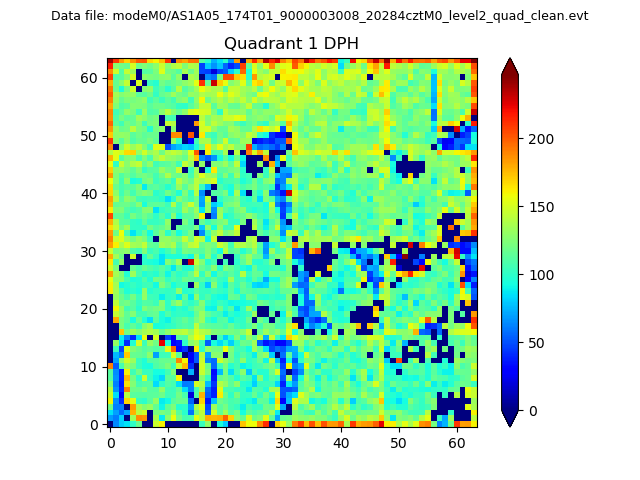 |
Quadrant B |
|---|---|---|---|
| Quadrant D | 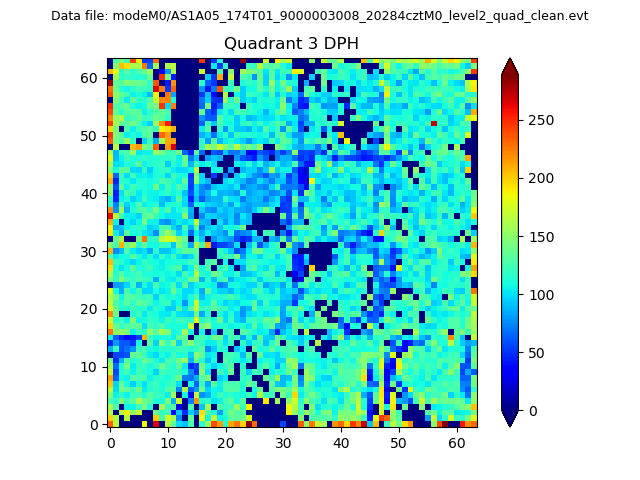 |
 |
Quadrant C |
| Plot type | Count rate plots | Images |
|---|---|---|
| Comparison with Poisson distribution Blue bars denote a histogram of data divided into 1 sec bins. Red curve is a Poisson curve with rate = median count rate of data. |
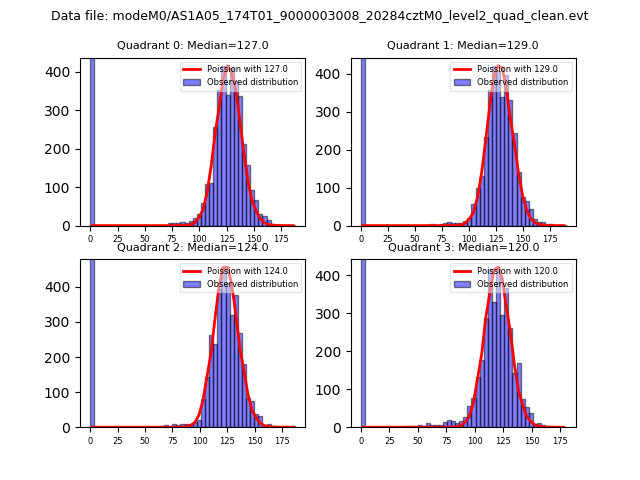 |
 |
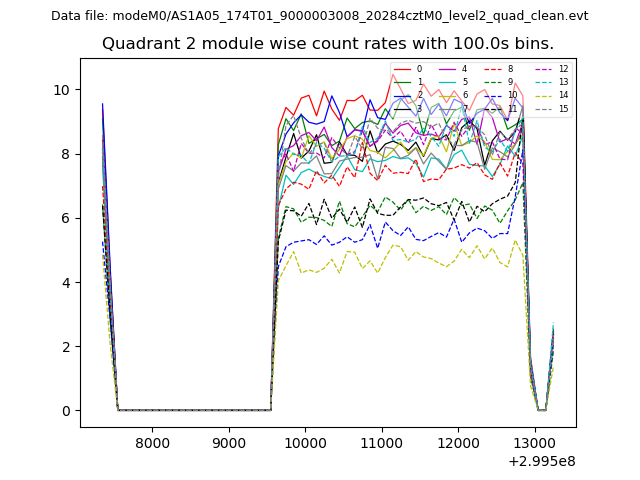
| Quadrant-wise count rates Data is divided into 100 sec bins |
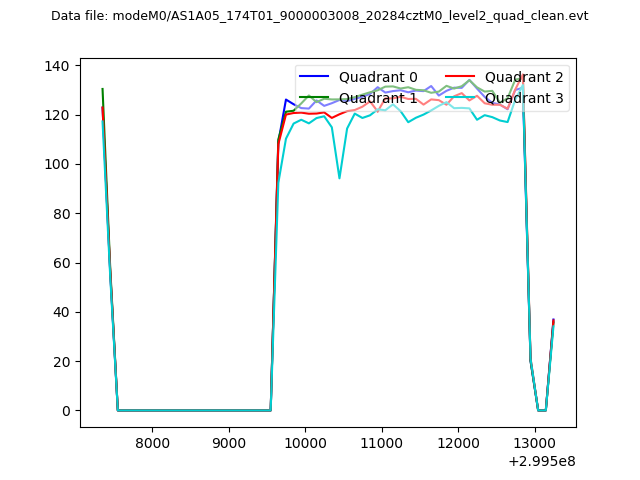 |
|
| Module-wise count rates for Quadrant A Data is divided into 100 sec bins |
 |
 |
| Module-wise count rates for Quadrant B Data is divided into 100 sec bins |
 |
 |
| Module-wise count rates for Quadrant C Data is divided into 100 sec bins |
 |
 |
| Module-wise count rates for Quadrant D Data is divided into 100 sec bins |
 |
 |
| Parameter | Plot |
|---|---|
| CZT HV Monitor | 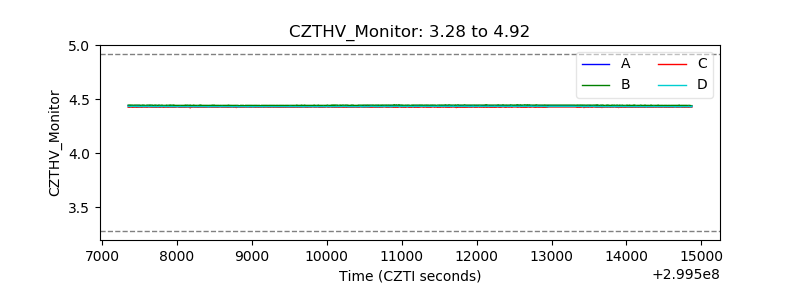 |
| D_VDD | 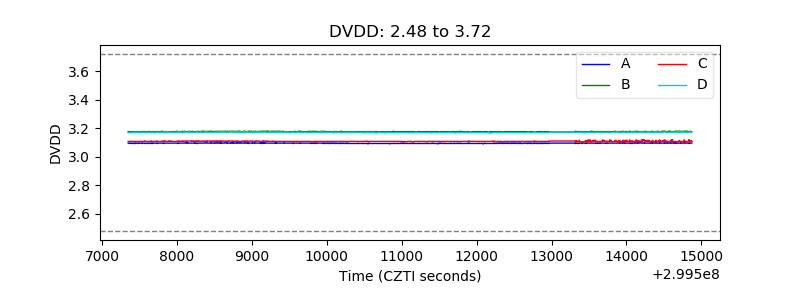 |
| Temperature 1 | 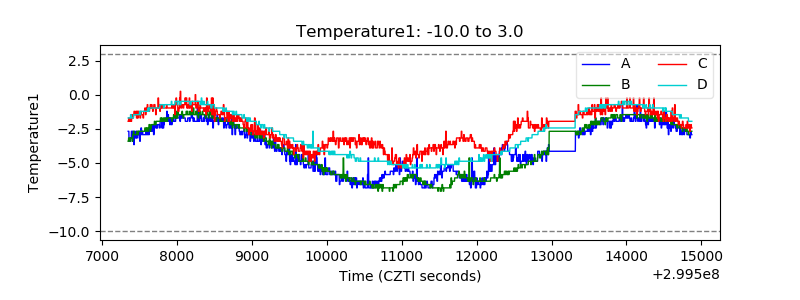 |
| Veto HV Monitor | 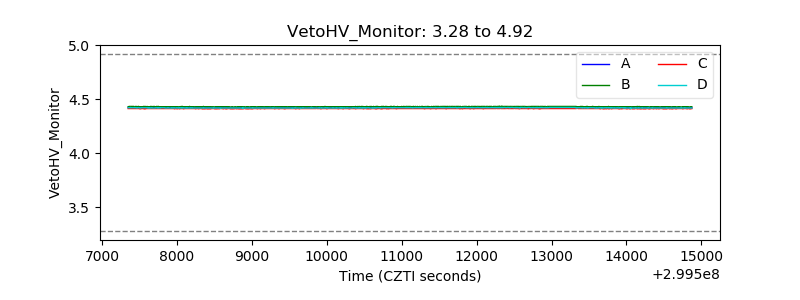 |
| Veto LLD |  |
| Alpha Counter | 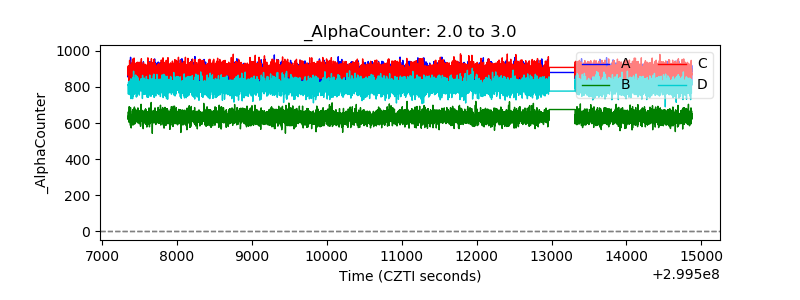 |
| _CPM_Rate | 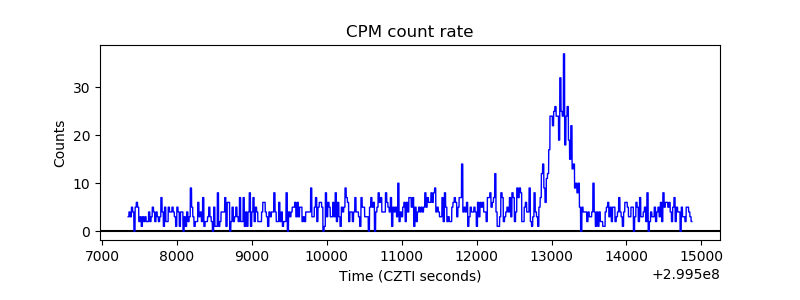 |
| CZT Counter | 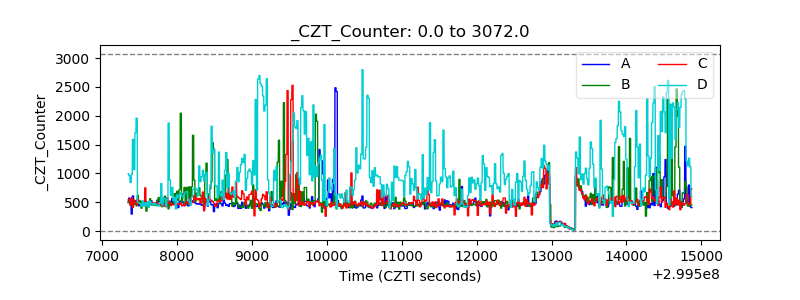 |
| +2.5 Volts monitor |  |
| +5 Volts monitor |  |
| _ROLL_ROT |  |
| _Roll_DEC | 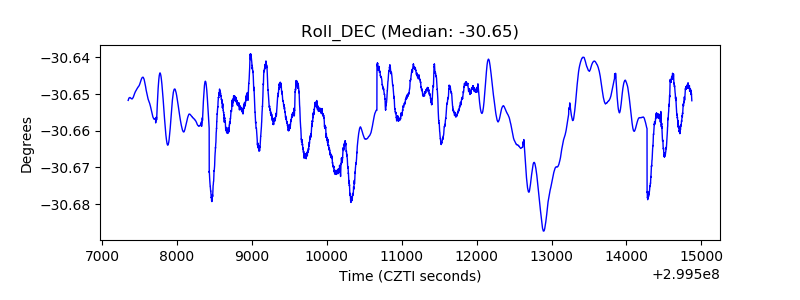 |
| _Roll_RA | 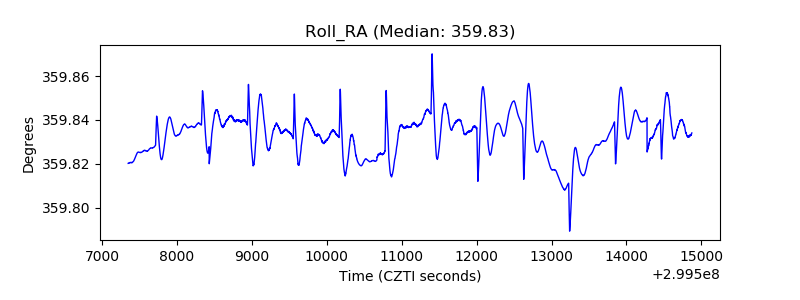 |
| Veto Counter |  |