| Param | Original file | Final file |
|---|---|---|
| Filename | modeM0/AS1A05_174T01_9000003008_20287cztM0_level2.evt | modeM0/AS1A05_174T01_9000003008_20287cztM0_level2_quad_clean.evt |
| Size (bytes) | 1,534,216,320 | 229,170,240 |
| Size | 1.4 GB | 218.6 MB |
| Events in quadrant A | 9,004,014 | 1,451,907 |
| Events in quadrant B | 10,907,392 | 1,463,167 |
| Events in quadrant C | 8,822,644 | 1,402,481 |
| Events in quadrant D | 16,496,367 | 1,362,449 |
| Mode M9 | |||
|---|---|---|---|
| Quadrant | BADHDUFLAG | Total packets | Discarded packets |
| A | 0 | 21 | 0 |
| B | 0 | 22 | 0 |
| C | 0 | 22 | 0 |
| D | 0 | 22 | 0 |
| Mode M0 | |||
|---|---|---|---|
| Quadrant | BADHDUFLAG | Total packets | Discarded packets |
| A | 0 | 38521 | 4 |
| B | 0 | 44312 | 4 |
| C | 0 | 37678 | 4 |
| D | 0 | 61452 | 4 |
| Mode SS | |||
|---|---|---|---|
| Quadrant | BADHDUFLAG | Total packets | Discarded packets |
| A | 0 | 372 | 0 |
| B | 0 | 372 | 0 |
| C | 0 | 372 | 0 |
| D | 0 | 372 | 0 |
| Quadrant | Total seconds | Saturated seconds | Saturation percentage |
|---|---|---|---|
| A | 18294 | 205 | 1.120586% |
| B | 18294 | 934 | 5.105499% |
| C | 18294 | 193 | 1.054991% |
| D | 18294 | 1123 | 6.138625% |
Noise dominated data is calculated using 1-second bins in cleaned event files. If a bin has >2000 counts, and if more than 50% of those come from <1% of pixels, then it is considered to be noise-dominated and hence unusable.
| Quadrant | # 1 sec bins | Bins with >0 counts | Bins with >2000 counts | High rate bins dominated by noise | Noise dominated (total time) | Noise dominated (detector-on time) | Marked lightcurve |
|---|---|---|---|---|---|---|---|
| A | 20344 | 18298 | 46 | 46 | 0.23% | 0.25% | 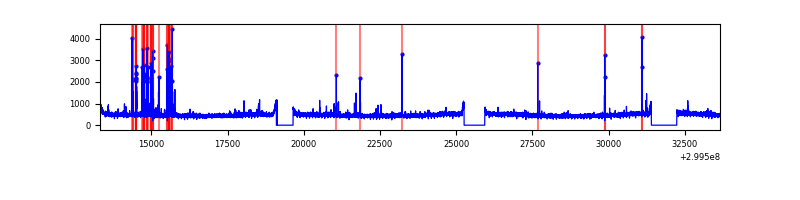 |
| B | 20344 | 18298 | 430 | 430 | 2.11% | 2.35% | 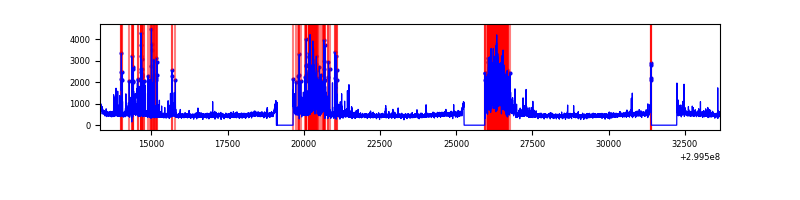 |
| C | 20344 | 18298 | 2 | 2 | 0.01% | 0.01% | 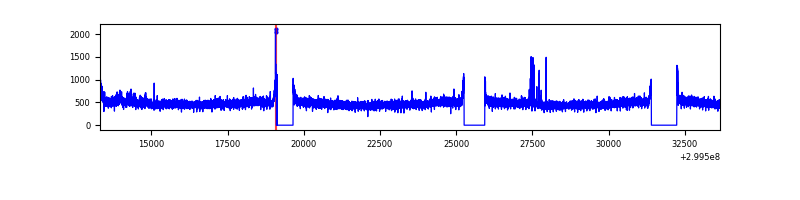 |
| D | 20344 | 18298 | 832 | 832 | 4.09% | 4.55% | 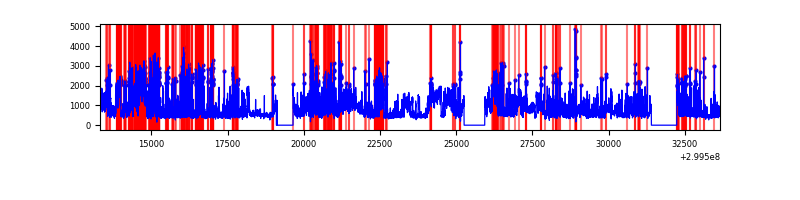 |
Top three noisy pixels from each quadrant. If the there are fewer than three noisy pixels in the level2.evt file, extra rows are filled as -1
| Pixel properties | Quadrant properties | ||||||
|---|---|---|---|---|---|---|---|
| Quadrant | DetID | PixID | Counts | Sigma | Mean | Median | Sigma |
| A | 14 | 238 | 210378 | 469.4 | 2198 | 2143 | 443.6 |
| A | 12 | 96 | 105134 | 232.16 | 2198 | 2143 | 443.6 |
| A | 8 | 205 | 102814 | 226.93 | 2198 | 2143 | 443.6 |
| B | 4 | 142 | 1622710 | 3930.39 | 2159 | 2101 | 412.3 |
| B | 7 | 220 | 323785 | 780.17 | 2159 | 2101 | 412.3 |
| B | 0 | 197 | 280943 | 676.26 | 2159 | 2101 | 412.3 |
| C | 14 | 238 | 326861 | 660.26 | 2109 | 2122 | 491.8 |
| C | 3 | 233 | 166401 | 334.01 | 2109 | 2122 | 491.8 |
| C | 9 | 54 | 70139 | 138.29 | 2109 | 2122 | 491.8 |
| D | 1 | 52 | 8199144 | 15951.65 | 2116 | 2054 | 513.9 |
| D | 2 | 234 | 99653 | 189.93 | 2116 | 2054 | 513.9 |
| D | 5 | 222 | 73793 | 139.61 | 2116 | 2054 | 513.9 |
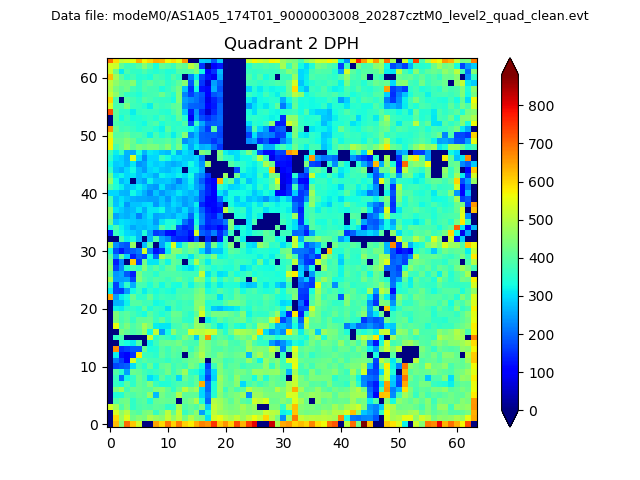
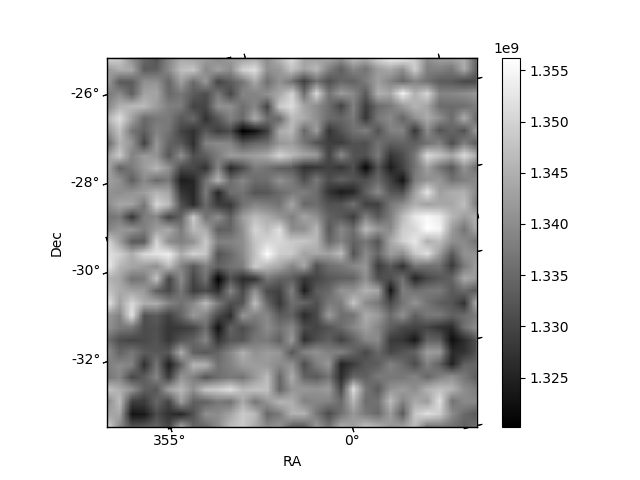
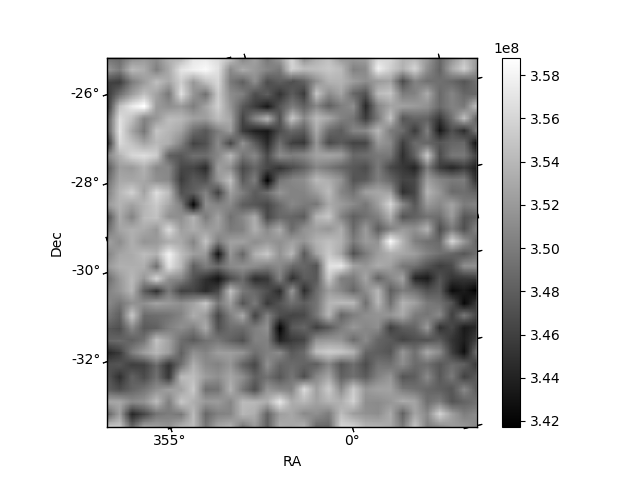
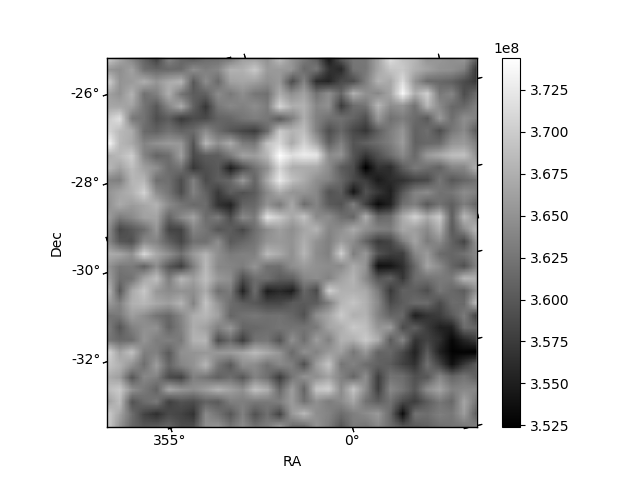
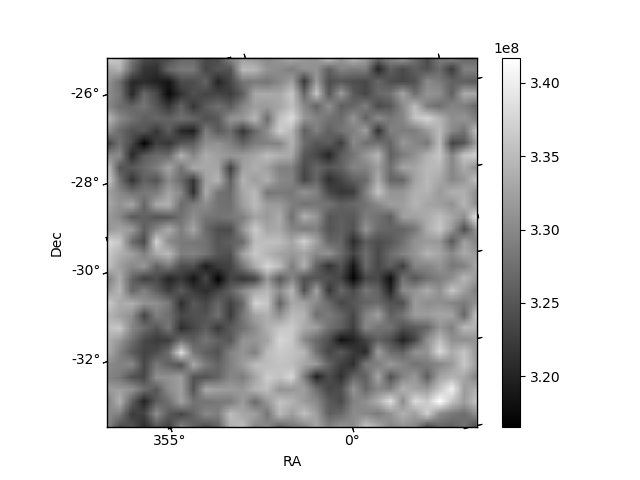
Histogram calculated using DETX and DETY for each event in the final _common_clean file
| Quadrant A | 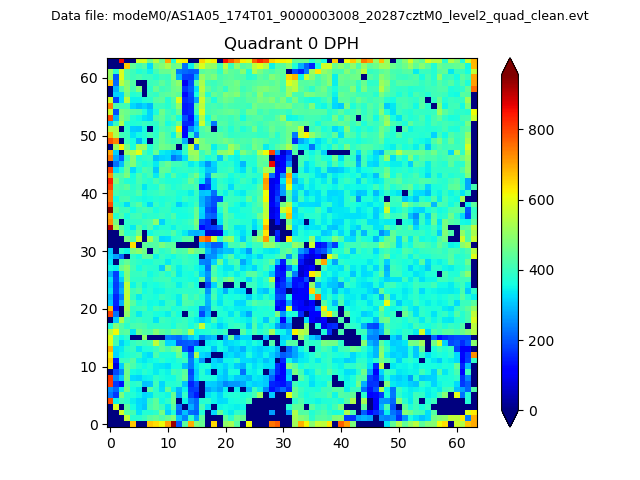 |
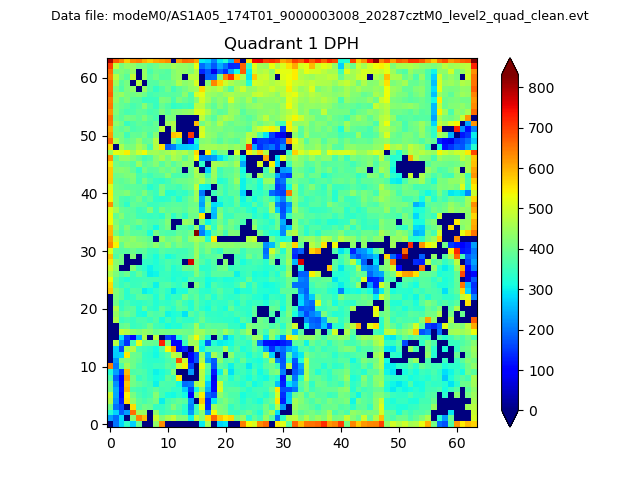 |
Quadrant B |
|---|---|---|---|
| Quadrant D | 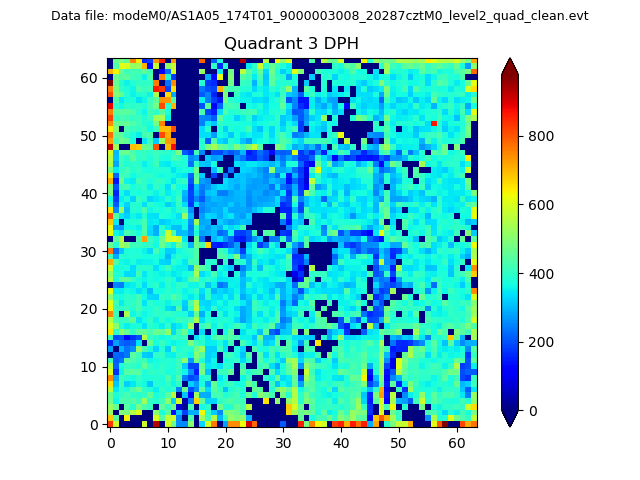 |
 |
Quadrant C |
| Plot type | Count rate plots | Images |
|---|---|---|
| Comparison with Poisson distribution Blue bars denote a histogram of data divided into 1 sec bins. Red curve is a Poisson curve with rate = median count rate of data. |
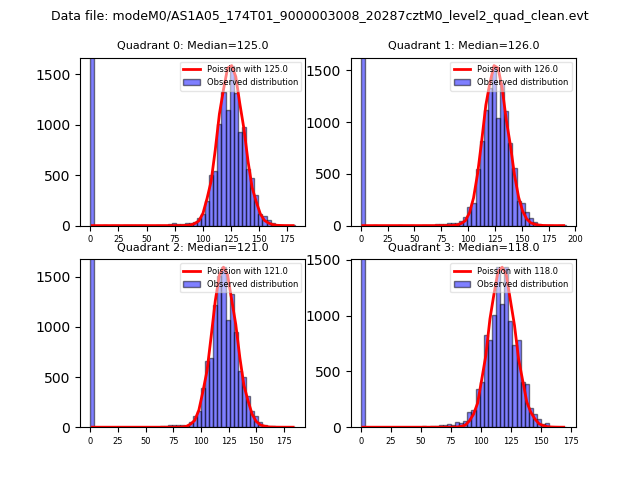 |
 |
| Quadrant-wise count rates Data is divided into 100 sec bins |
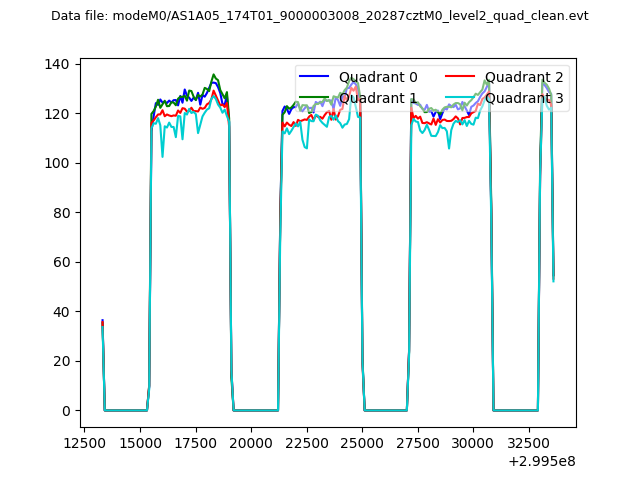 |
|
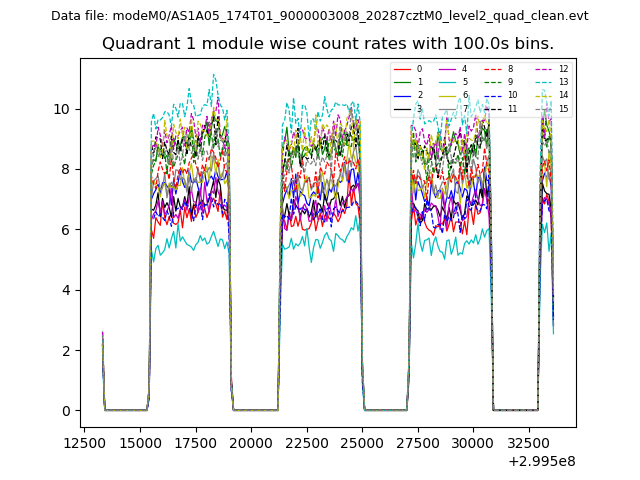
| Module-wise count rates for Quadrant A Data is divided into 100 sec bins |
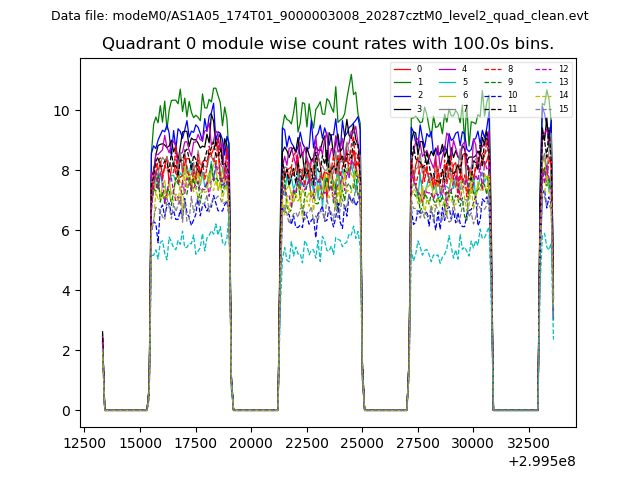 |
 |
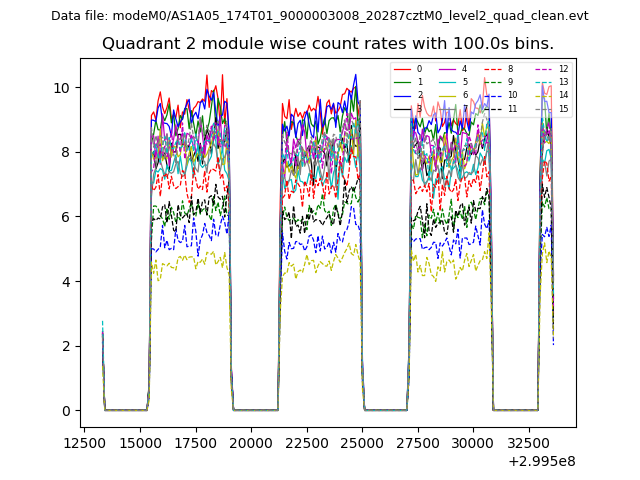
| Module-wise count rates for Quadrant B Data is divided into 100 sec bins |
 |
 |
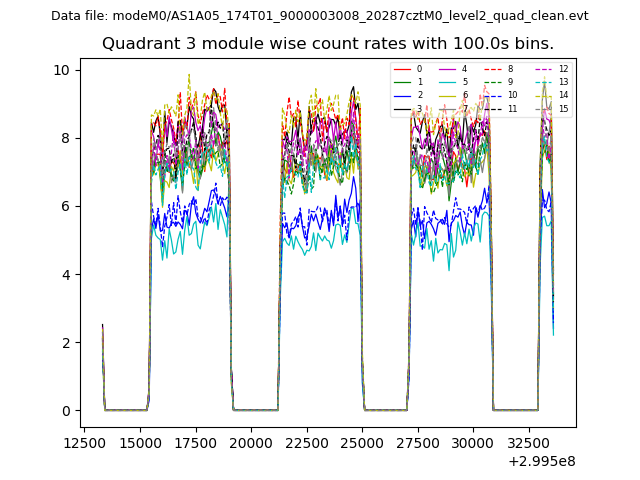
| Module-wise count rates for Quadrant C Data is divided into 100 sec bins |
 |
 |
| Module-wise count rates for Quadrant D Data is divided into 100 sec bins |
 |
 |
| Parameter | Plot |
|---|---|
| CZT HV Monitor | 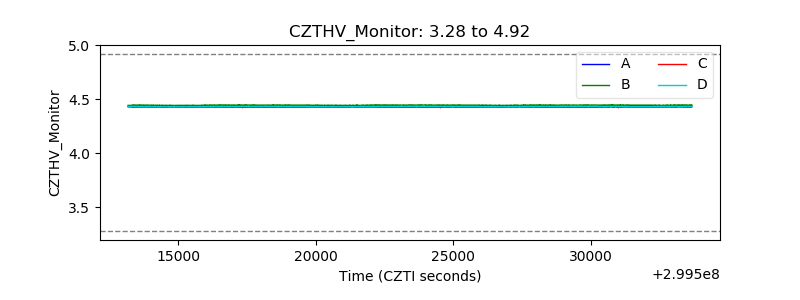 |
| D_VDD | 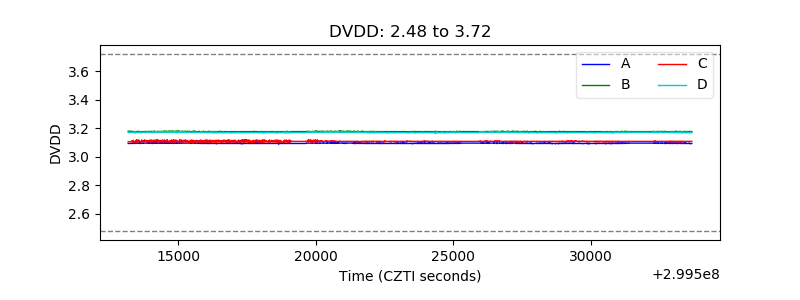 |
| Temperature 1 | 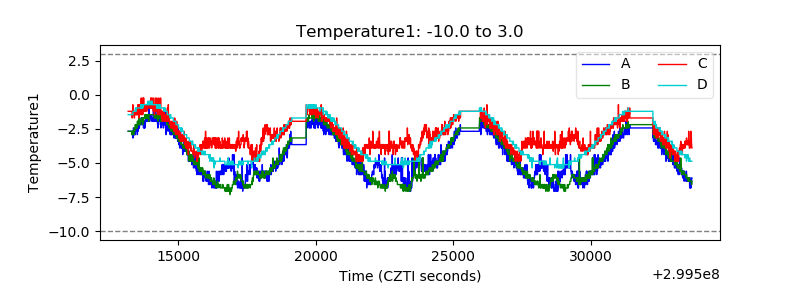 |
| Veto HV Monitor | 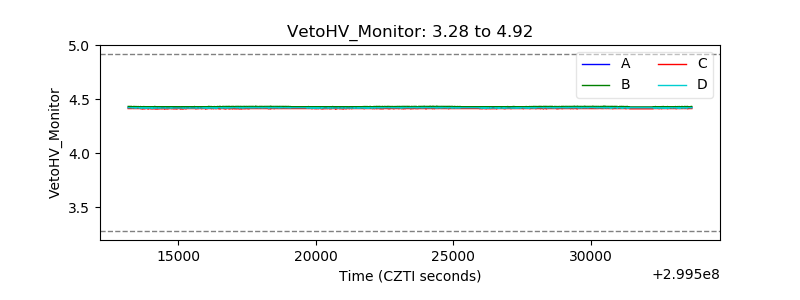 |
| Veto LLD | 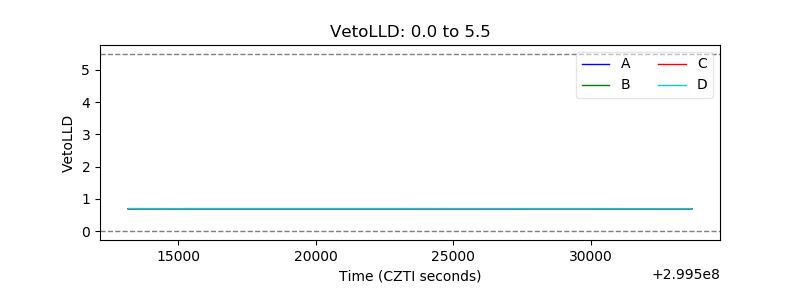 |
| Alpha Counter | 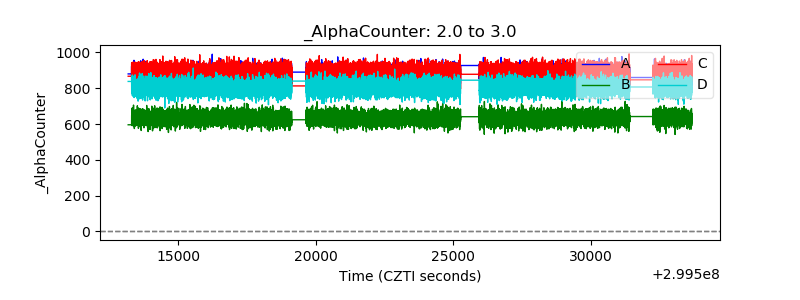 |
| _CPM_Rate | 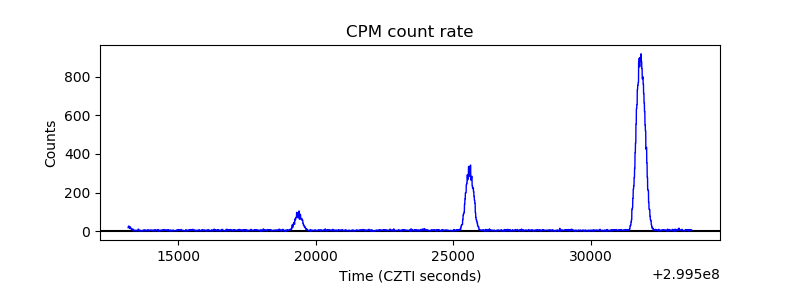 |
| CZT Counter | 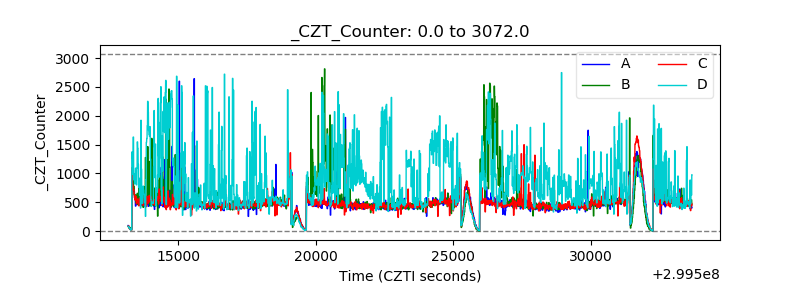 |
| +2.5 Volts monitor |  |
| +5 Volts monitor |  |
| _ROLL_ROT | 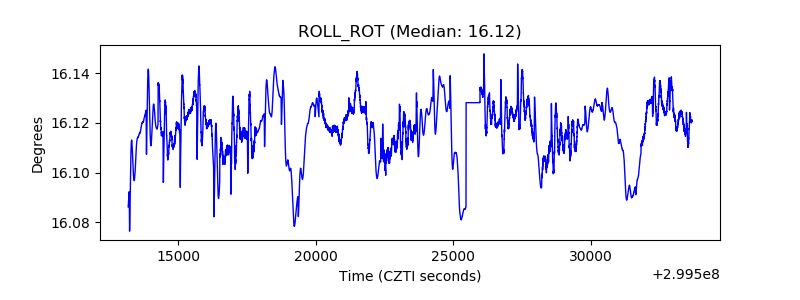 |
| _Roll_DEC | 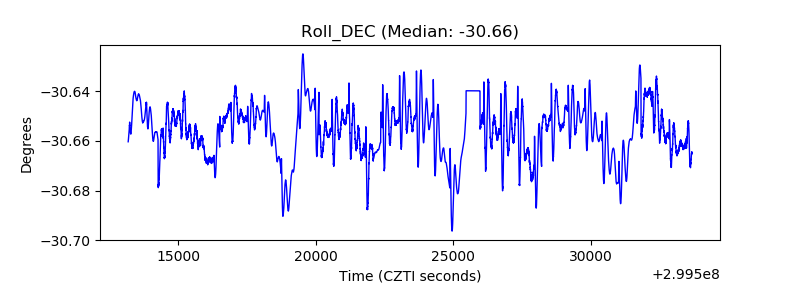 |
| _Roll_RA | 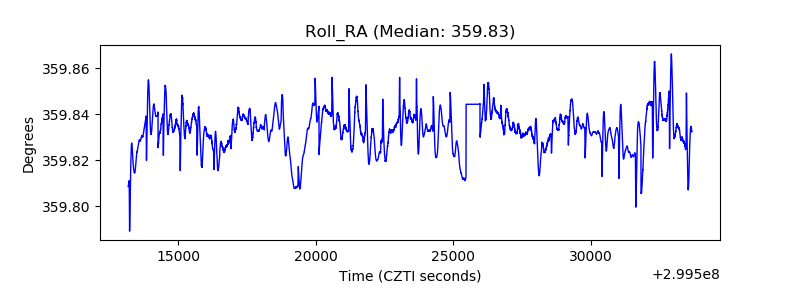 |
| Veto Counter | 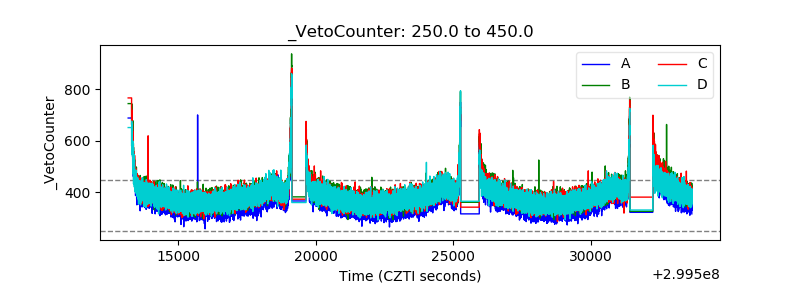 |