| Param | Original file | Final file |
|---|---|---|
| Filename | modeM0/AS1A05_174T01_9000003008_20288cztM0_level2.evt | modeM0/AS1A05_174T01_9000003008_20288cztM0_level2_quad_clean.evt |
| Size (bytes) | 573,554,880 | 96,868,800 |
| Size | 547.0 MB | 92.4 MB |
| Events in quadrant A | 3,620,398 | 615,663 |
| Events in quadrant B | 3,808,885 | 626,187 |
| Events in quadrant C | 3,589,169 | 600,255 |
| Events in quadrant D | 5,854,455 | 580,677 |
| Mode M9 | |||
|---|---|---|---|
| Quadrant | BADHDUFLAG | Total packets | Discarded packets |
| A | 0 | 18 | 0 |
| B | 0 | 18 | 0 |
| C | 0 | 18 | 0 |
| D | 0 | 18 | 0 |
| Mode M0 | |||
|---|---|---|---|
| Quadrant | BADHDUFLAG | Total packets | Discarded packets |
| A | 0 | 15270 | 2 |
| B | 0 | 16008 | 2 |
| C | 0 | 15155 | 2 |
| D | 0 | 22323 | 2 |
| Mode SS | |||
|---|---|---|---|
| Quadrant | BADHDUFLAG | Total packets | Discarded packets |
| A | 0 | 152 | 0 |
| B | 0 | 152 | 0 |
| C | 0 | 152 | 0 |
| D | 0 | 152 | 0 |
| Quadrant | Total seconds | Saturated seconds | Saturation percentage |
|---|---|---|---|
| A | 7333 | 59 | 0.804582% |
| B | 7334 | 105 | 1.431688% |
| C | 7334 | 94 | 1.281702% |
| D | 7334 | 300 | 4.090537% |
Noise dominated data is calculated using 1-second bins in cleaned event files. If a bin has >2000 counts, and if more than 50% of those come from <1% of pixels, then it is considered to be noise-dominated and hence unusable.
| Quadrant | # 1 sec bins | Bins with >0 counts | Bins with >2000 counts | High rate bins dominated by noise | Noise dominated (total time) | Noise dominated (detector-on time) | Marked lightcurve |
|---|---|---|---|---|---|---|---|
| A | 9153 | 7335 | 2 | 2 | 0.02% | 0.03% | 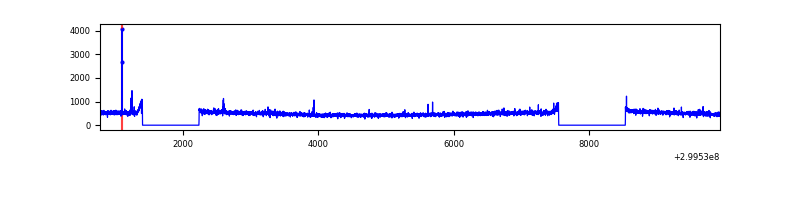 |
| B | 9154 | 7336 | 9 | 9 | 0.10% | 0.12% | 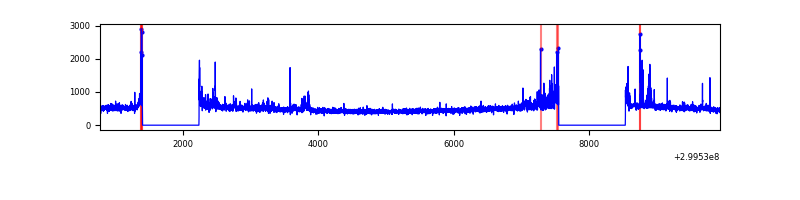 |
| C | 9154 | 7336 | 0 | 0 | 0.00% | 0.00% | 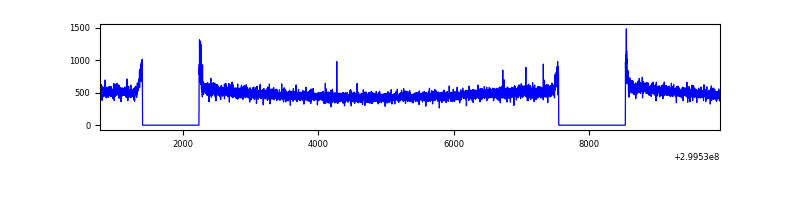 |
| D | 9154 | 7336 | 167 | 167 | 1.82% | 2.28% | 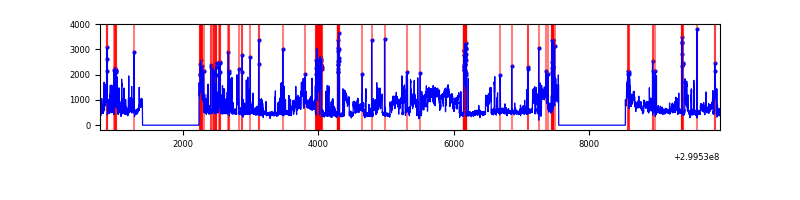 |
Top three noisy pixels from each quadrant. If the there are fewer than three noisy pixels in the level2.evt file, extra rows are filled as -1
| Pixel properties | Quadrant properties | ||||||
|---|---|---|---|---|---|---|---|
| Quadrant | DetID | PixID | Counts | Sigma | Mean | Median | Sigma |
| A | 8 | 205 | 93682 | 507.01 | 906 | 885 | 183.0 |
| A | 4 | 2 | 13934 | 71.3 | 906 | 885 | 183.0 |
| A | 14 | 238 | 12056 | 61.03 | 906 | 885 | 183.0 |
| B | 7 | 220 | 83262 | 476.45 | 904 | 880 | 172.9 |
| B | 0 | 197 | 71822 | 410.28 | 904 | 880 | 172.9 |
| B | 4 | 142 | 49372 | 280.45 | 904 | 880 | 172.9 |
| C | 14 | 238 | 136926 | 662.5 | 875 | 879 | 205.4 |
| C | 0 | 207 | 18812 | 87.33 | 875 | 879 | 205.4 |
| C | 3 | 233 | 17752 | 82.16 | 875 | 879 | 205.4 |
| D | 1 | 52 | 2419532 | 11281.33 | 877 | 852 | 214.4 |
| D | 2 | 234 | 36763 | 167.5 | 877 | 852 | 214.4 |
| D | 15 | 0 | 32702 | 148.56 | 877 | 852 | 214.4 |
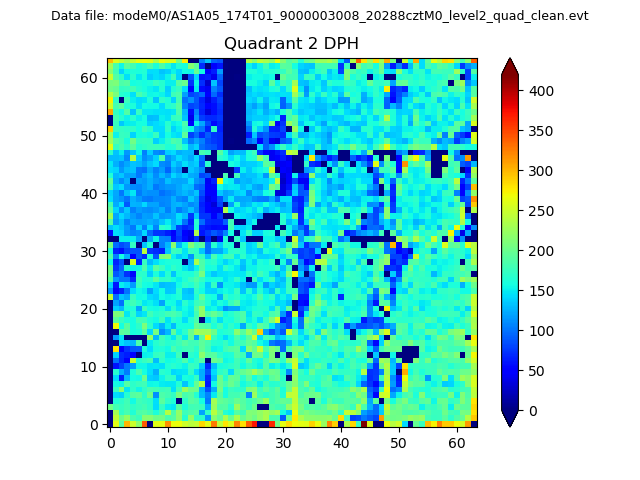
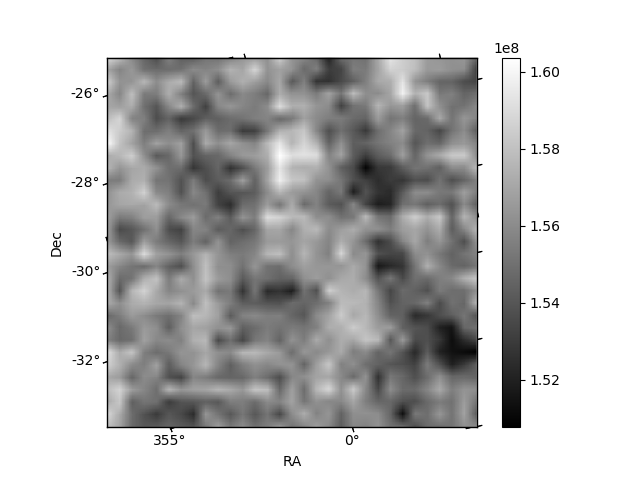
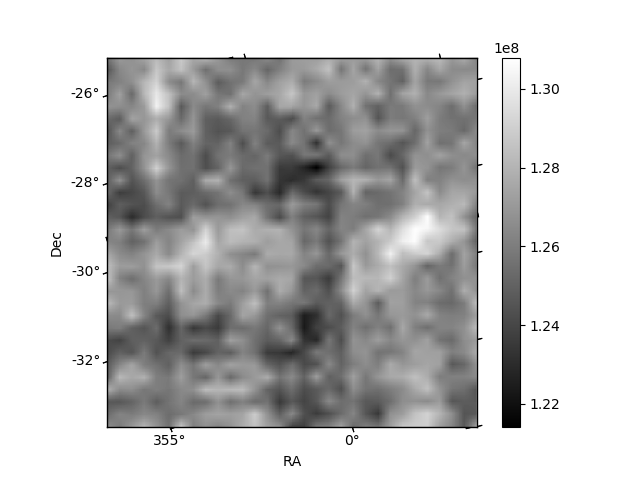
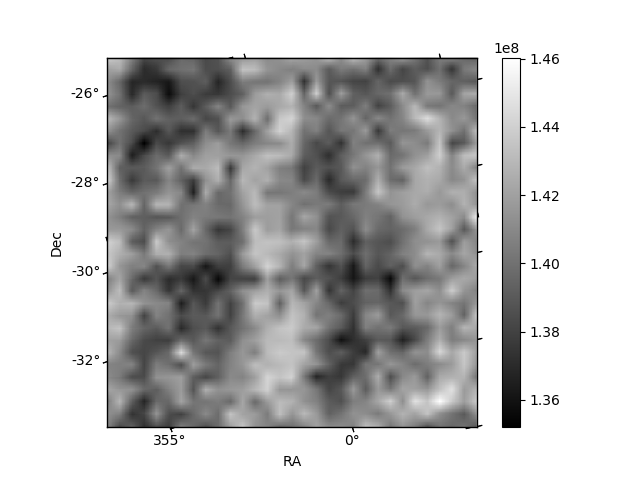
Histogram calculated using DETX and DETY for each event in the final _common_clean file
| Quadrant A | 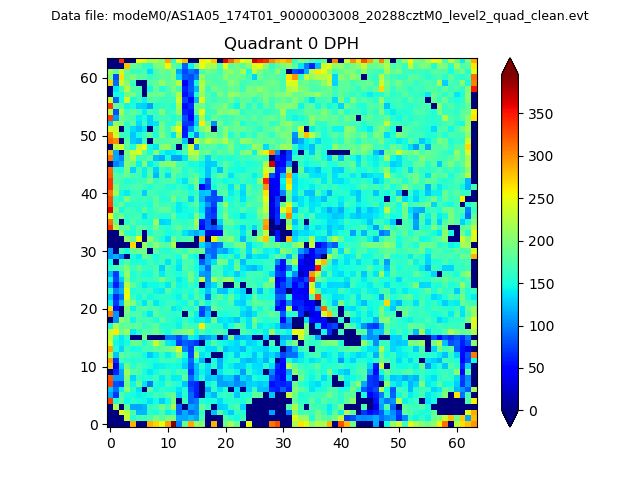 |
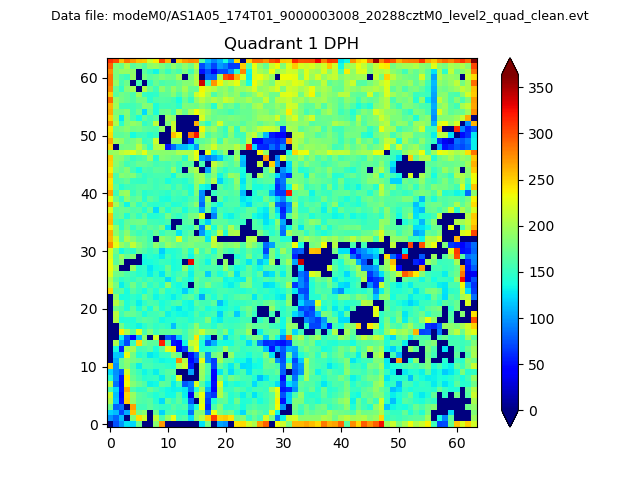 |
Quadrant B |
|---|---|---|---|
| Quadrant D | 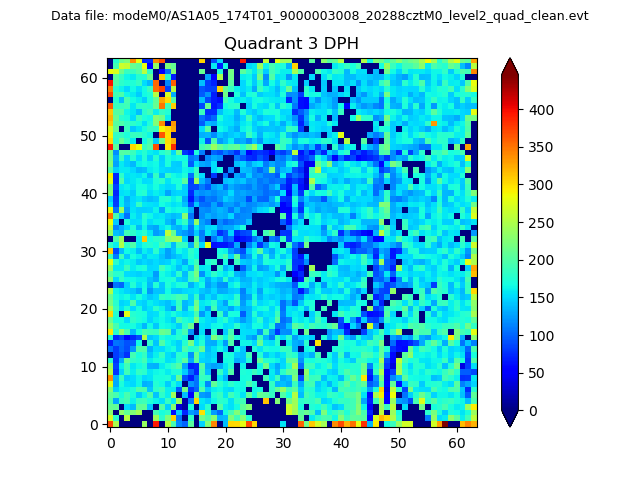 |
 |
Quadrant C |
| Plot type | Count rate plots | Images |
|---|---|---|
| Comparison with Poisson distribution Blue bars denote a histogram of data divided into 1 sec bins. Red curve is a Poisson curve with rate = median count rate of data. |
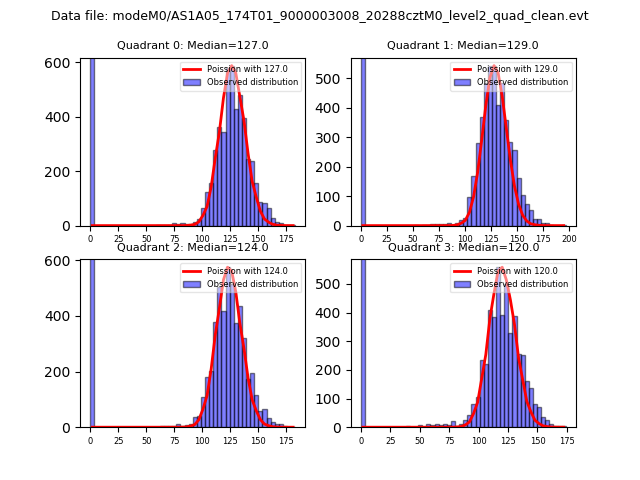 |
 |
| Quadrant-wise count rates Data is divided into 100 sec bins |
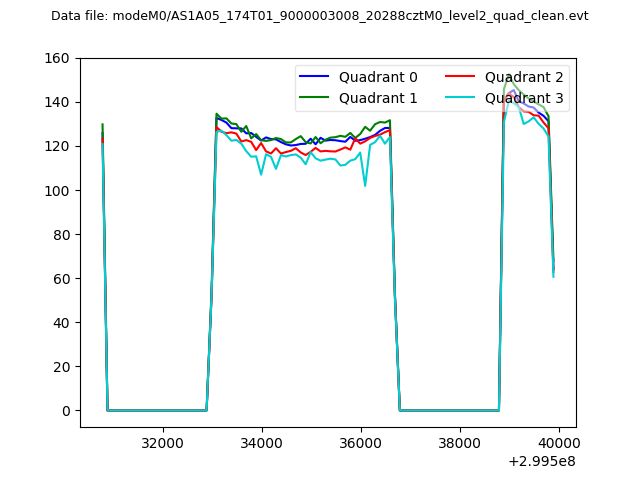 |
|
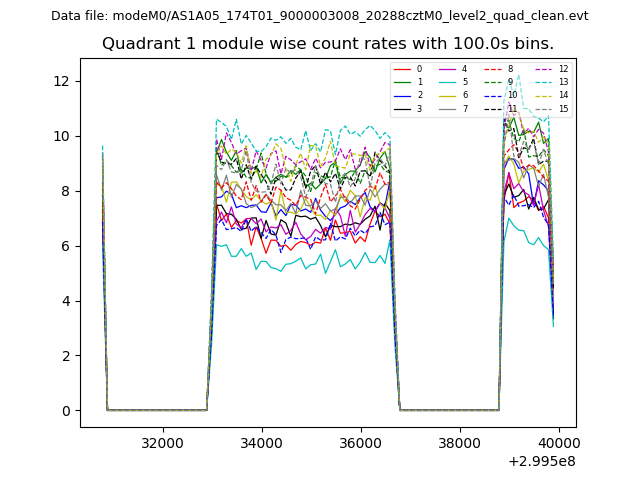
| Module-wise count rates for Quadrant A Data is divided into 100 sec bins |
 |
 |
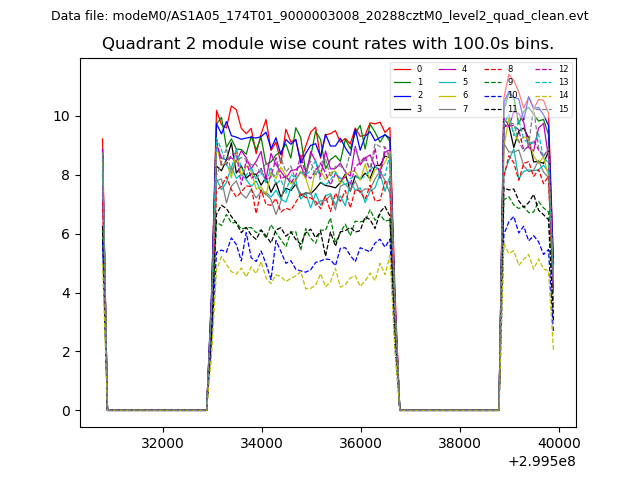
| Module-wise count rates for Quadrant B Data is divided into 100 sec bins |
 |
 |
| Module-wise count rates for Quadrant C Data is divided into 100 sec bins |
 |
 |
| Module-wise count rates for Quadrant D Data is divided into 100 sec bins |
 |
 |
| Parameter | Plot |
|---|---|
| CZT HV Monitor | 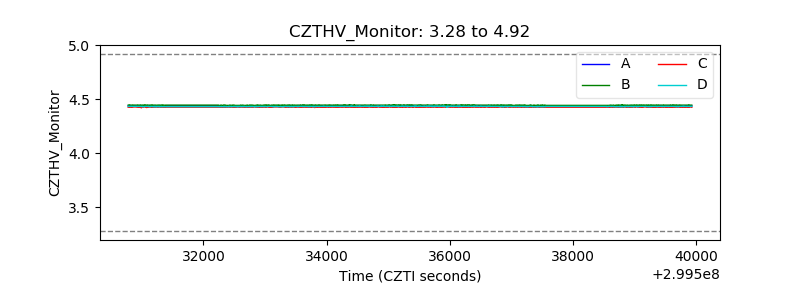 |
| D_VDD | 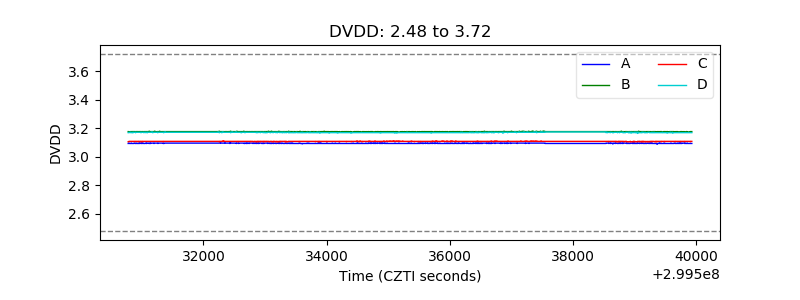 |
| Temperature 1 | 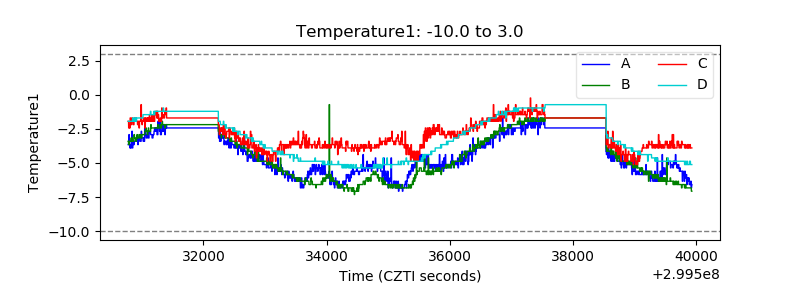 |
| Veto HV Monitor | 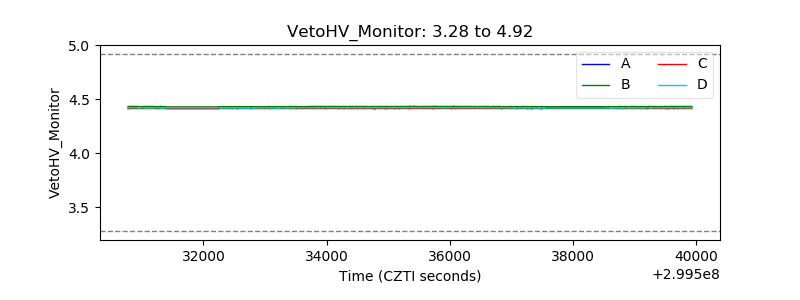 |
| Veto LLD | 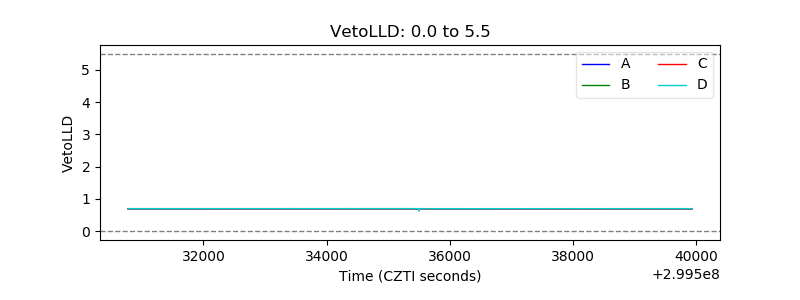 |
| Alpha Counter | 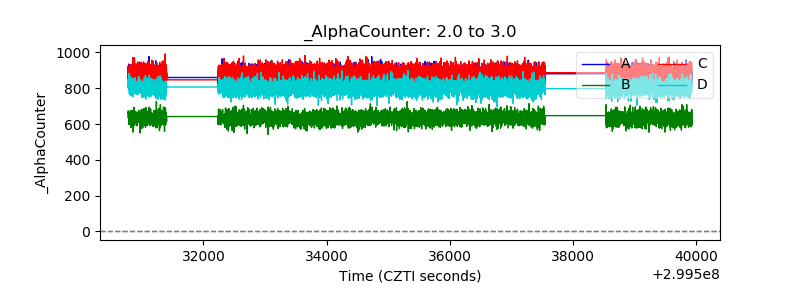 |
| _CPM_Rate | 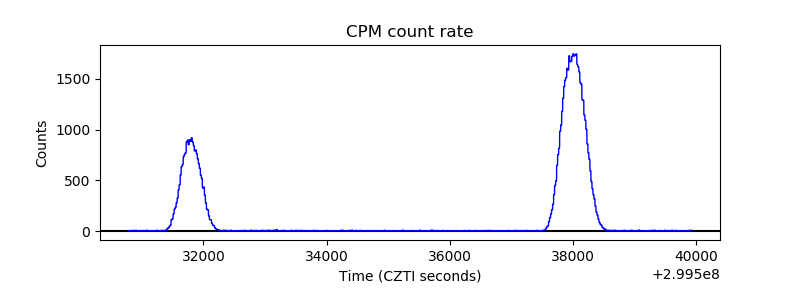 |
| CZT Counter | 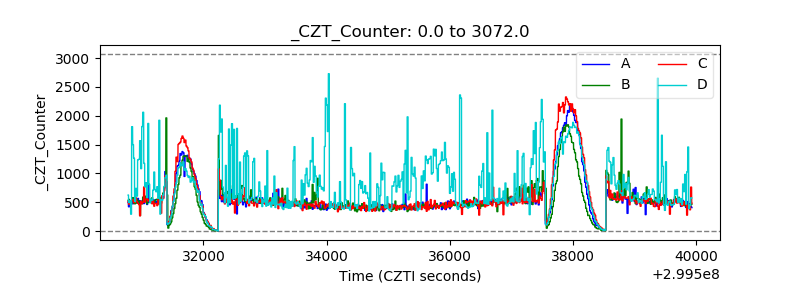 |
| +2.5 Volts monitor |  |
| +5 Volts monitor | 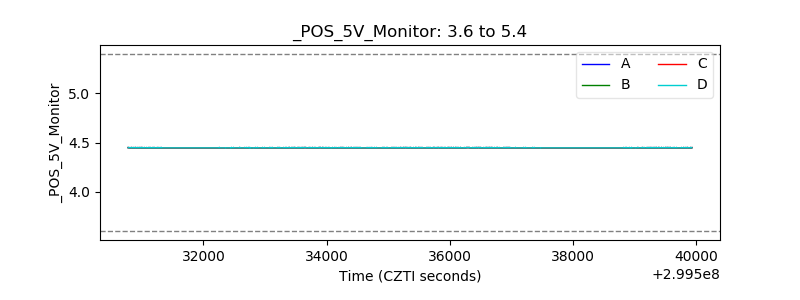 |
| _ROLL_ROT | 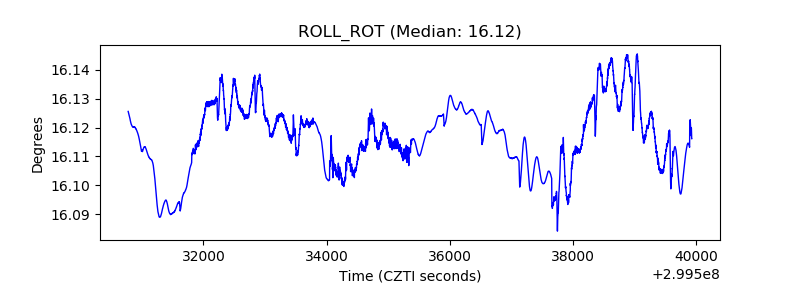 |
| _Roll_DEC | 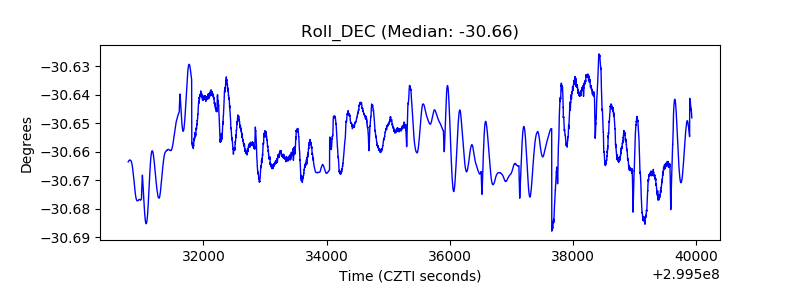 |
| _Roll_RA | 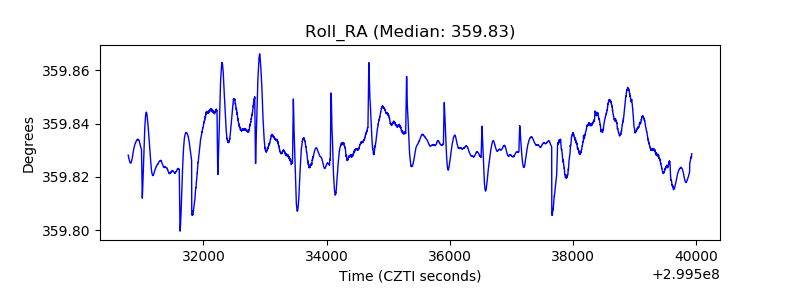 |
| Veto Counter | 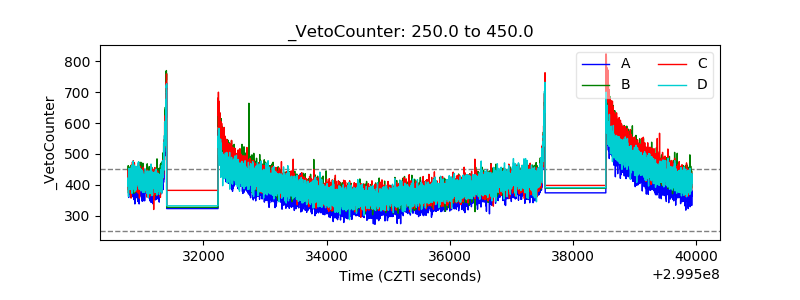 |