| Param | Original file | Final file |
|---|---|---|
| Filename | modeM0/AS1A05_174T01_9000003008_20290cztM0_level2.evt | modeM0/AS1A05_174T01_9000003008_20290cztM0_level2_quad_clean.evt |
| Size (bytes) | 555,580,800 | 102,983,040 |
| Size | 529.8 MB | 98.2 MB |
| Events in quadrant A | 3,531,502 | 661,743 |
| Events in quadrant B | 3,854,868 | 680,906 |
| Events in quadrant C | 3,535,596 | 655,065 |
| Events in quadrant D | 5,425,009 | 629,252 |
| Mode M9 | |||
|---|---|---|---|
| Quadrant | BADHDUFLAG | Total packets | Discarded packets |
| A | 0 | 21 | 0 |
| B | 0 | 21 | 0 |
| C | 0 | 21 | 0 |
| D | 0 | 21 | 0 |
| Mode M0 | |||
|---|---|---|---|
| Quadrant | BADHDUFLAG | Total packets | Discarded packets |
| A | 0 | 14875 | 2 |
| B | 0 | 16072 | 2 |
| C | 0 | 14836 | 2 |
| D | 0 | 20782 | 2 |
| Mode SS | |||
|---|---|---|---|
| Quadrant | BADHDUFLAG | Total packets | Discarded packets |
| A | 0 | 146 | 0 |
| B | 0 | 146 | 0 |
| C | 0 | 146 | 0 |
| D | 0 | 146 | 0 |
| Quadrant | Total seconds | Saturated seconds | Saturation percentage |
|---|---|---|---|
| A | 7059 | 53 | 0.750815% |
| B | 7059 | 137 | 1.940785% |
| C | 7059 | 96 | 1.359966% |
| D | 7059 | 387 | 5.482363% |
Noise dominated data is calculated using 1-second bins in cleaned event files. If a bin has >2000 counts, and if more than 50% of those come from <1% of pixels, then it is considered to be noise-dominated and hence unusable.
| Quadrant | # 1 sec bins | Bins with >0 counts | Bins with >2000 counts | High rate bins dominated by noise | Noise dominated (total time) | Noise dominated (detector-on time) | Marked lightcurve |
|---|---|---|---|---|---|---|---|
| A | 9154 | 7061 | 3 | 3 | 0.03% | 0.04% | 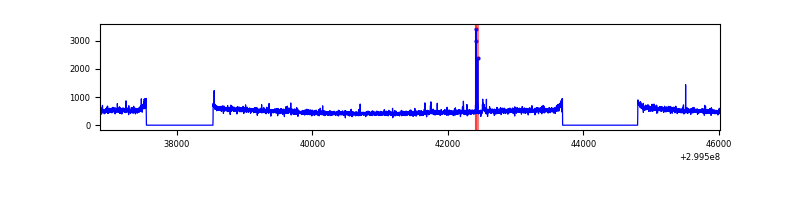 |
| B | 9154 | 7061 | 26 | 26 | 0.28% | 0.37% | 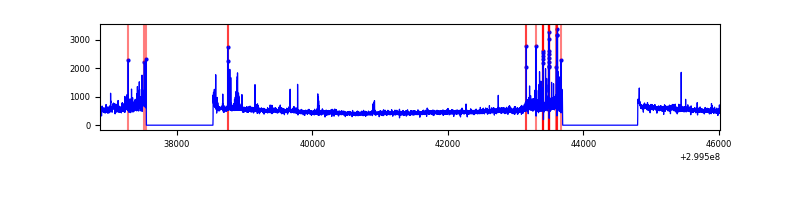 |
| C | 9154 | 7061 | 0 | 0 | 0.00% | 0.00% | 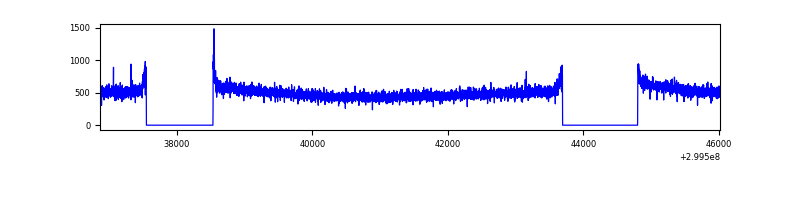 |
| D | 9154 | 7061 | 253 | 253 | 2.76% | 3.58% | 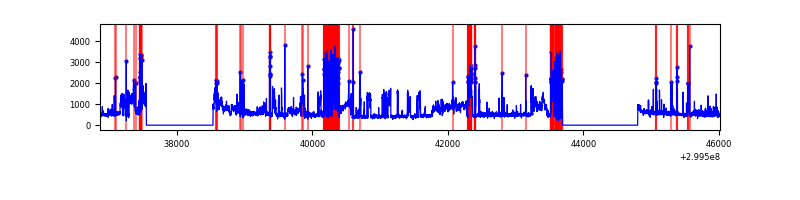 |
Top three noisy pixels from each quadrant. If the there are fewer than three noisy pixels in the level2.evt file, extra rows are filled as -1
| Pixel properties | Quadrant properties | ||||||
|---|---|---|---|---|---|---|---|
| Quadrant | DetID | PixID | Counts | Sigma | Mean | Median | Sigma |
| A | 8 | 205 | 70505 | 387.03 | 888 | 869 | 179.9 |
| A | 14 | 238 | 25178 | 135.11 | 888 | 869 | 179.9 |
| A | 9 | 143 | 12293 | 63.49 | 888 | 869 | 179.9 |
| B | 7 | 220 | 219341 | 1293.67 | 888 | 865 | 168.9 |
| B | 0 | 197 | 41289 | 239.36 | 888 | 865 | 168.9 |
| B | 4 | 142 | 36169 | 209.05 | 888 | 865 | 168.9 |
| C | 14 | 238 | 135060 | 659.57 | 866 | 872 | 203.4 |
| C | 0 | 207 | 11493 | 52.21 | 866 | 872 | 203.4 |
| C | 3 | 233 | 10801 | 48.8 | 866 | 872 | 203.4 |
| D | 1 | 52 | 2064403 | 9879.78 | 859 | 833 | 208.9 |
| D | 2 | 234 | 36989 | 173.1 | 859 | 833 | 208.9 |
| D | 5 | 222 | 31477 | 146.71 | 859 | 833 | 208.9 |
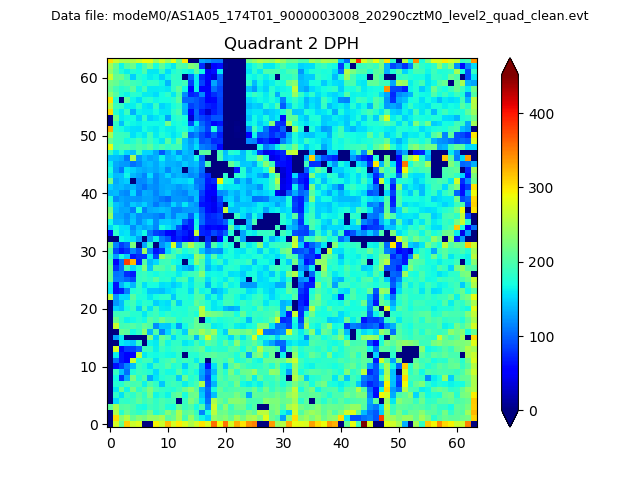
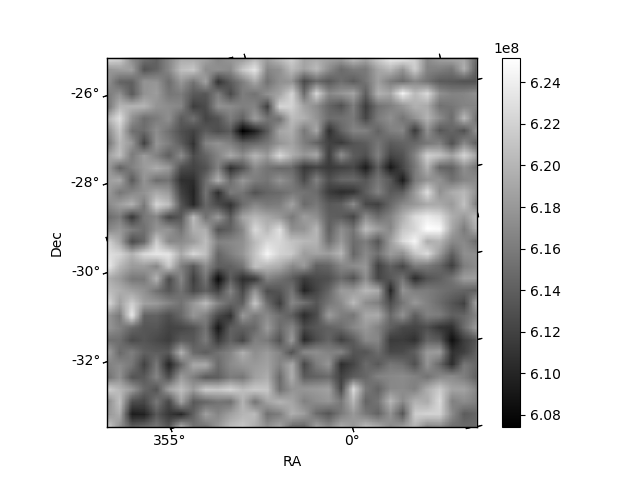
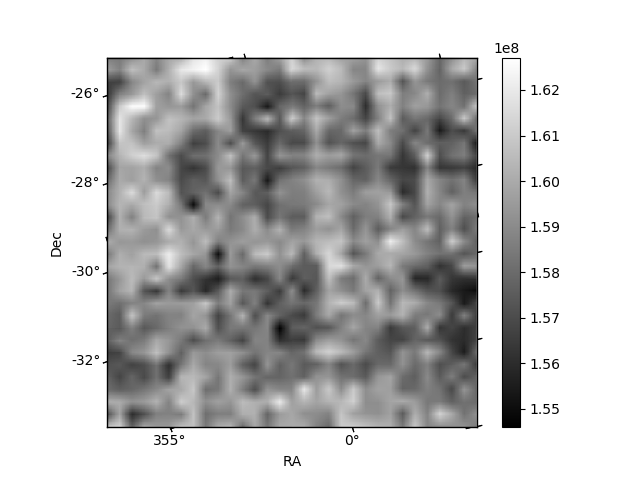
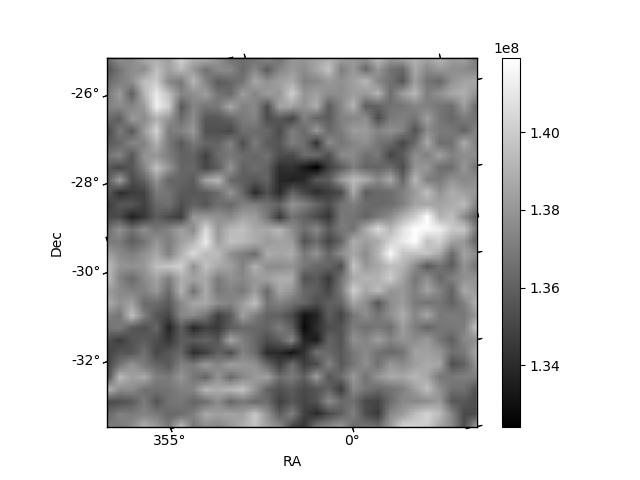
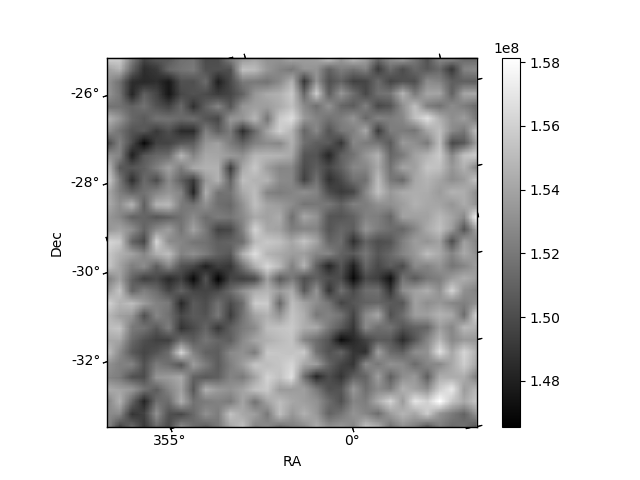
Histogram calculated using DETX and DETY for each event in the final _common_clean file
| Quadrant A | 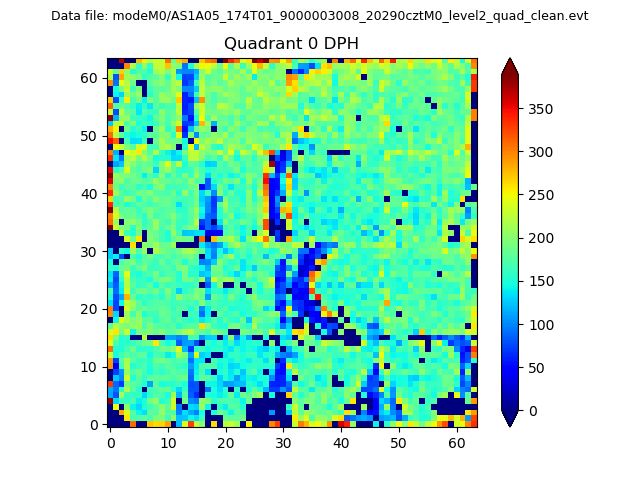 |
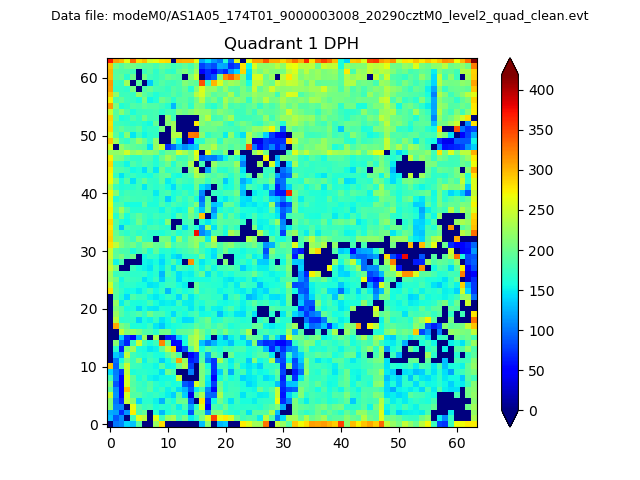 |
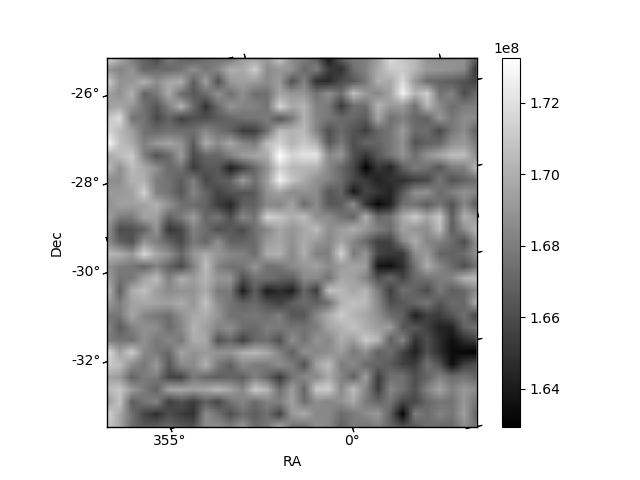
Quadrant B |
|---|---|---|---|
| Quadrant D | 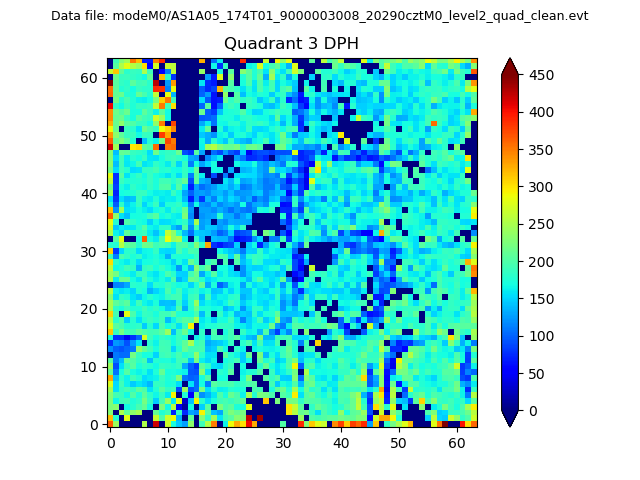 |
 |
Quadrant C |
| Plot type | Count rate plots | Images |
|---|---|---|
| Comparison with Poisson distribution Blue bars denote a histogram of data divided into 1 sec bins. Red curve is a Poisson curve with rate = median count rate of data. |
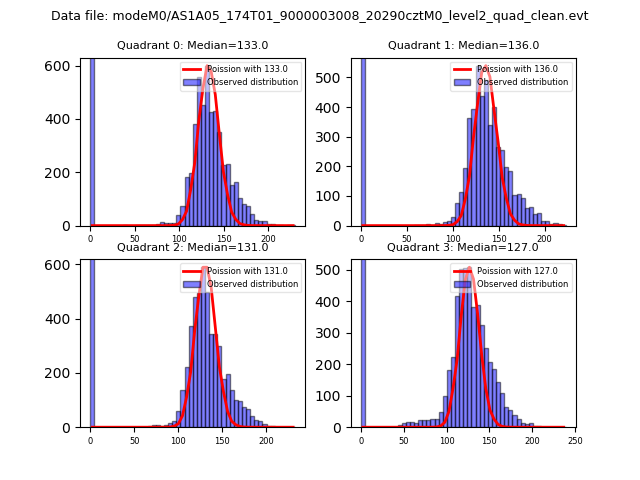 |
 |
| Quadrant-wise count rates Data is divided into 100 sec bins |
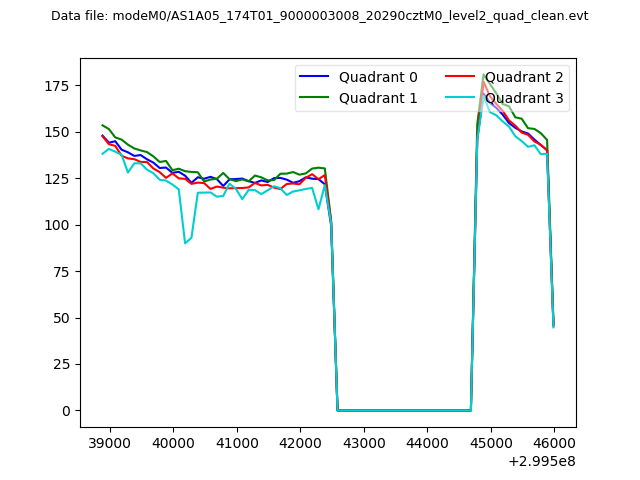 |
|
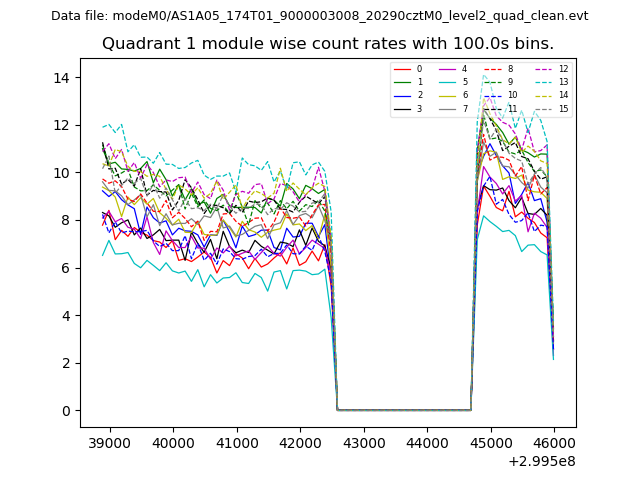
| Module-wise count rates for Quadrant A Data is divided into 100 sec bins |
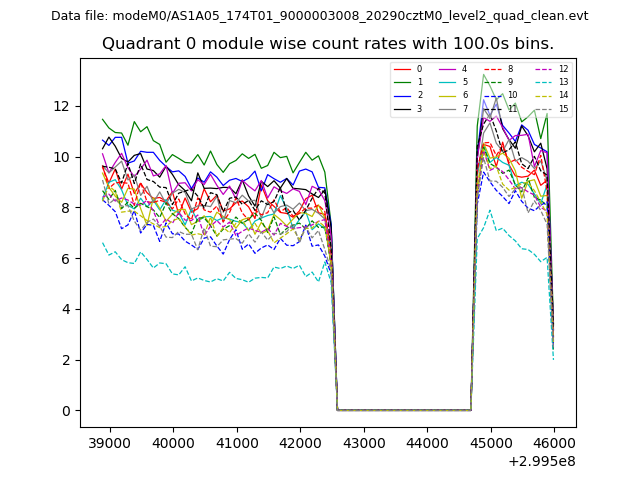 |
 |
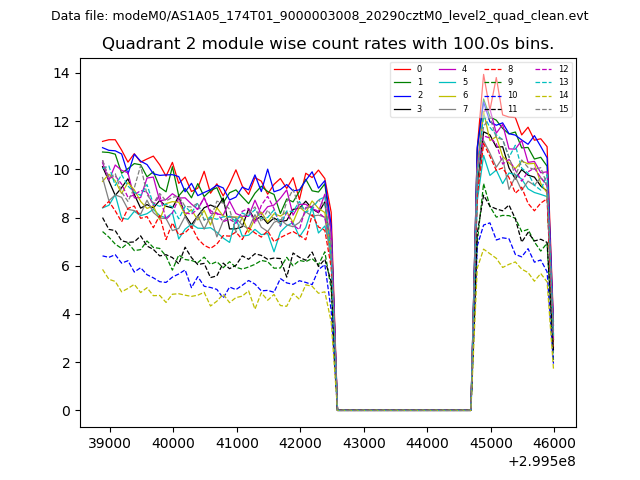
| Module-wise count rates for Quadrant B Data is divided into 100 sec bins |
 |
 |
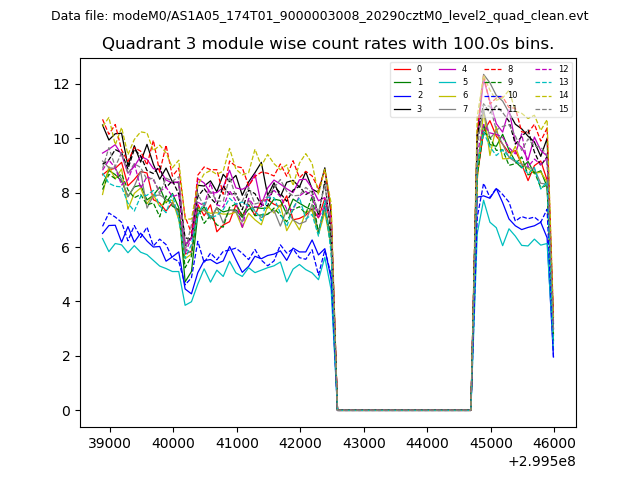
| Module-wise count rates for Quadrant C Data is divided into 100 sec bins |
 |
 |
| Module-wise count rates for Quadrant D Data is divided into 100 sec bins |
 |
 |
| Parameter | Plot |
|---|---|
| CZT HV Monitor | 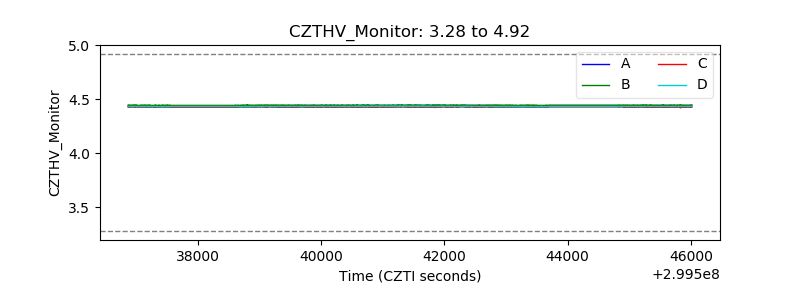 |
| D_VDD | 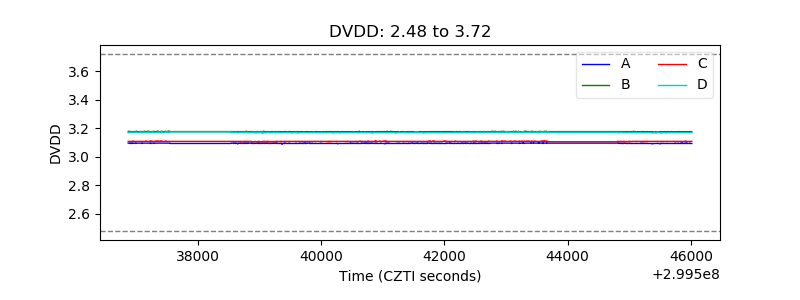 |
| Temperature 1 |  |
| Veto HV Monitor | 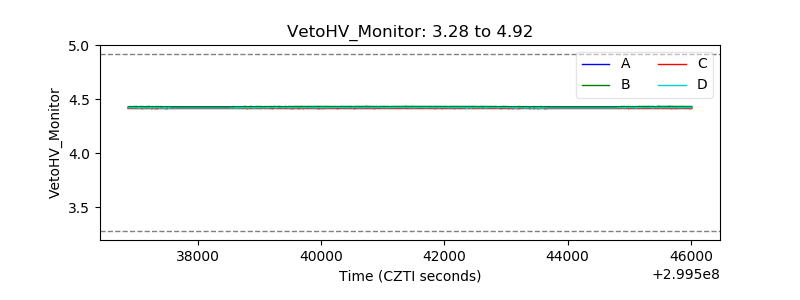 |
| Veto LLD | 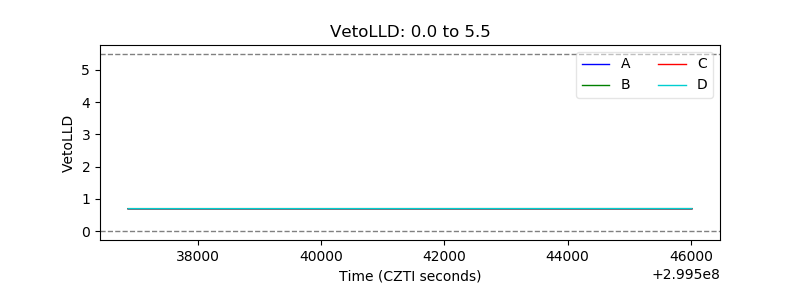 |
| Alpha Counter | 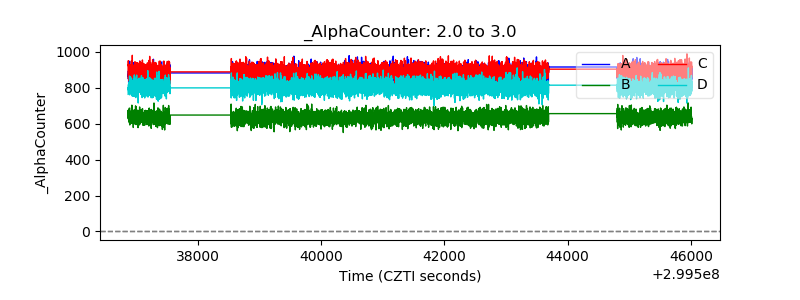 |
| _CPM_Rate | 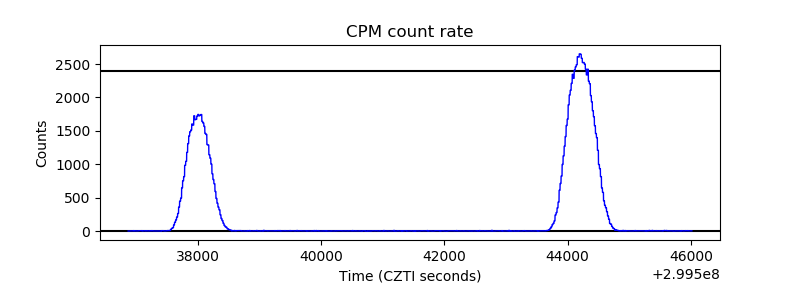 |
| CZT Counter | 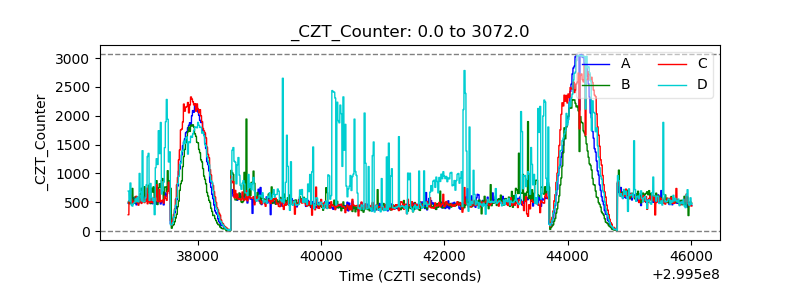 |
| +2.5 Volts monitor |  |
| +5 Volts monitor |  |
| _ROLL_ROT | 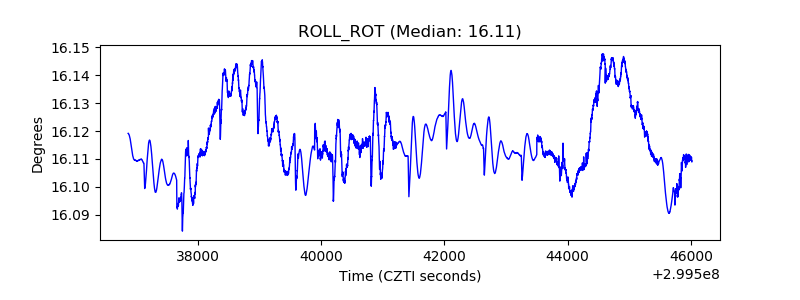 |
| _Roll_DEC |  |
| _Roll_RA | 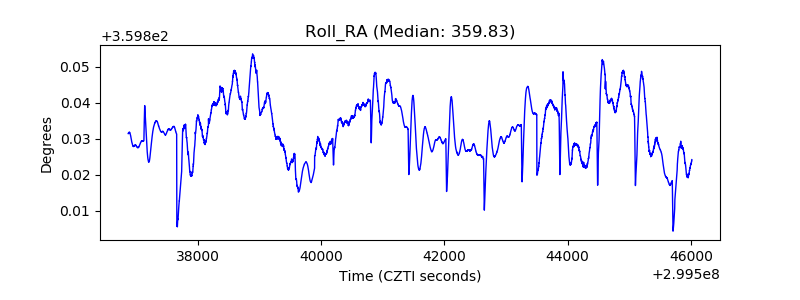 |
| Veto Counter | 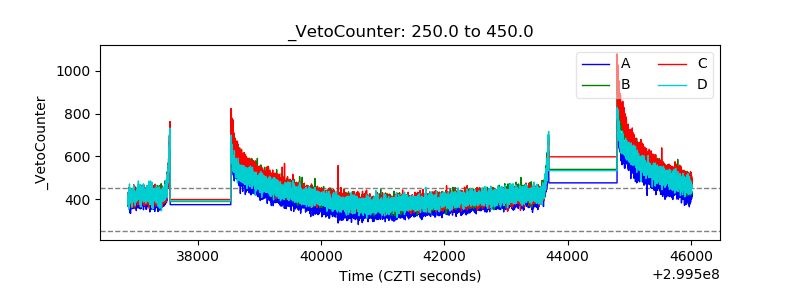 |