| Param | Original file | Final file |
|---|---|---|
| Filename | modeM0/AS1A05_174T01_9000003008_20292cztM0_level2.evt | modeM0/AS1A05_174T01_9000003008_20292cztM0_level2_quad_clean.evt |
| Size (bytes) | 466,309,440 | 104,774,400 |
| Size | 444.7 MB | 99.9 MB |
| Events in quadrant A | 3,441,364 | 681,120 |
| Events in quadrant B | 3,414,595 | 706,339 |
| Events in quadrant C | 3,303,421 | 685,461 |
| Events in quadrant D | 3,540,882 | 666,335 |
| Mode M9 | |||
|---|---|---|---|
| Quadrant | BADHDUFLAG | Total packets | Discarded packets |
| A | 0 | 19 | 0 |
| B | 0 | 20 | 0 |
| C | 0 | 20 | 0 |
| D | 0 | 20 | 0 |
| Mode M0 | |||
|---|---|---|---|
| Quadrant | BADHDUFLAG | Total packets | Discarded packets |
| A | 0 | 14012 | 2 |
| B | 0 | 14092 | 2 |
| C | 0 | 13611 | 2 |
| D | 0 | 14468 | 2 |
| Mode SS | |||
|---|---|---|---|
| Quadrant | BADHDUFLAG | Total packets | Discarded packets |
| A | 0 | 126 | 0 |
| B | 0 | 126 | 0 |
| C | 0 | 126 | 0 |
| D | 0 | 126 | 0 |
| Quadrant | Total seconds | Saturated seconds | Saturation percentage |
|---|---|---|---|
| A | 6218 | 53 | 0.852364% |
| B | 6218 | 100 | 1.608234% |
| C | 6217 | 98 | 1.576323% |
| D | 6217 | 75 | 1.206370% |
Noise dominated data is calculated using 1-second bins in cleaned event files. If a bin has >2000 counts, and if more than 50% of those come from <1% of pixels, then it is considered to be noise-dominated and hence unusable.
| Quadrant | # 1 sec bins | Bins with >0 counts | Bins with >2000 counts | High rate bins dominated by noise | Noise dominated (total time) | Noise dominated (detector-on time) | Marked lightcurve |
|---|---|---|---|---|---|---|---|
| A | 7493 | 6219 | 7 | 7 | 0.09% | 0.11% | 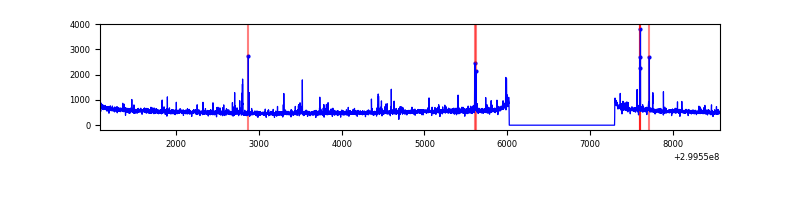 |
| B | 7493 | 6219 | 10 | 10 | 0.13% | 0.16% | 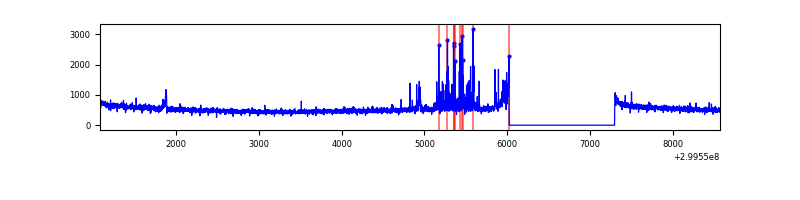 |
| C | 7492 | 6218 | 0 | 0 | 0.00% | 0.00% | 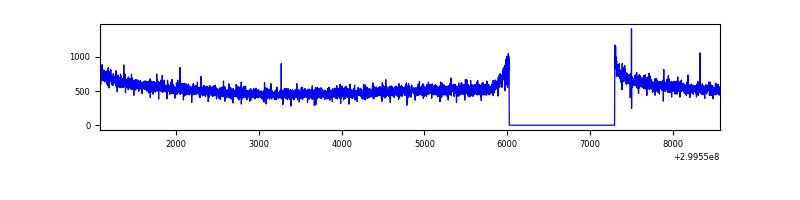 |
| D | 7492 | 6218 | 24 | 24 | 0.32% | 0.39% | 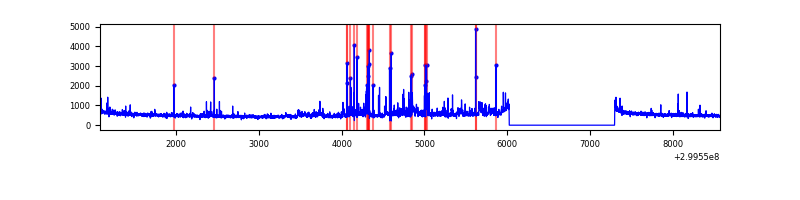 |
Top three noisy pixels from each quadrant. If the there are fewer than three noisy pixels in the level2.evt file, extra rows are filled as -1
| Pixel properties | Quadrant properties | ||||||
|---|---|---|---|---|---|---|---|
| Quadrant | DetID | PixID | Counts | Sigma | Mean | Median | Sigma |
| A | 8 | 205 | 132990 | 806.22 | 818 | 802 | 164.0 |
| A | 4 | 2 | 116964 | 708.48 | 818 | 802 | 164.0 |
| A | 12 | 96 | 34956 | 208.31 | 818 | 802 | 164.0 |
| B | 7 | 220 | 84310 | 544.41 | 820 | 801 | 153.4 |
| B | 4 | 142 | 77716 | 501.42 | 820 | 801 | 153.4 |
| B | 3 | 64 | 19374 | 121.08 | 820 | 801 | 153.4 |
| C | 14 | 238 | 127069 | 670.25 | 809 | 817 | 188.4 |
| C | 0 | 207 | 12596 | 62.53 | 809 | 817 | 188.4 |
| C | 13 | 61 | 5579 | 25.28 | 809 | 817 | 188.4 |
| D | 1 | 52 | 411656 | 2092.33 | 816 | 796 | 196.4 |
| D | 2 | 234 | 28743 | 142.32 | 816 | 796 | 196.4 |
| D | 2 | 120 | 25161 | 124.08 | 816 | 796 | 196.4 |
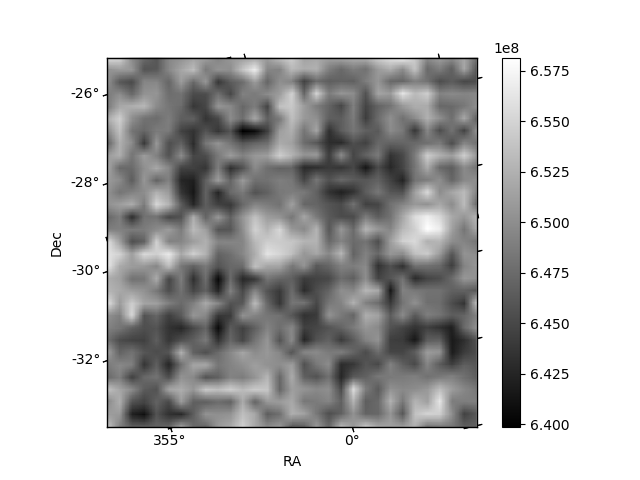
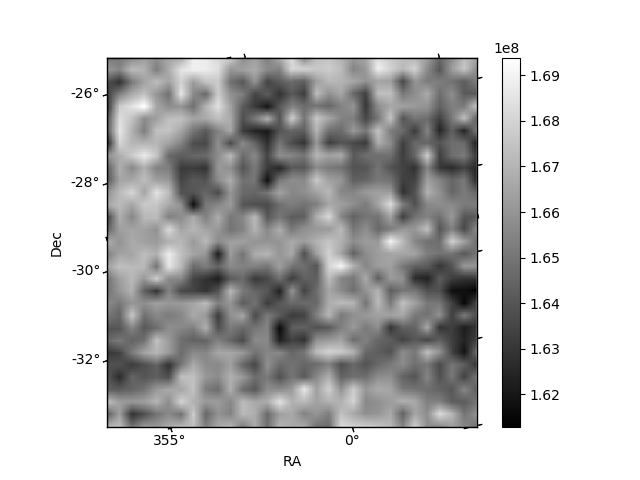
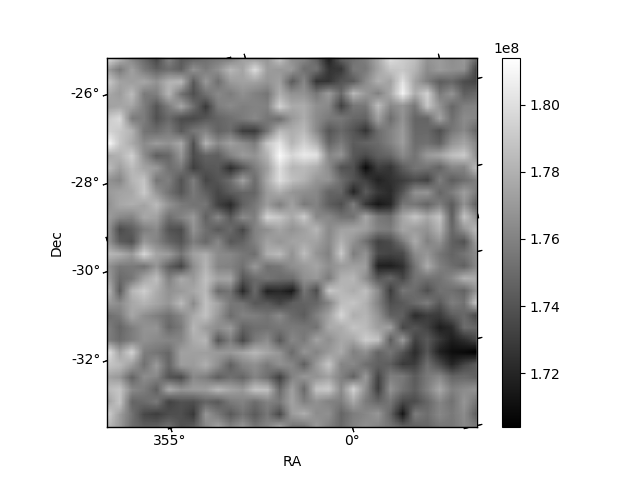
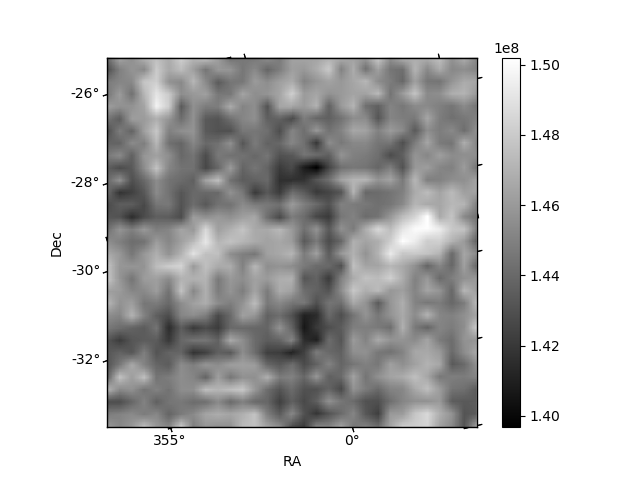
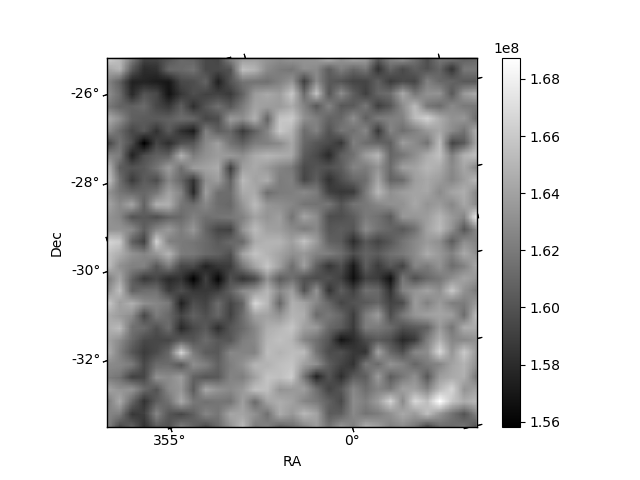
Histogram calculated using DETX and DETY for each event in the final _common_clean file
| Quadrant A | 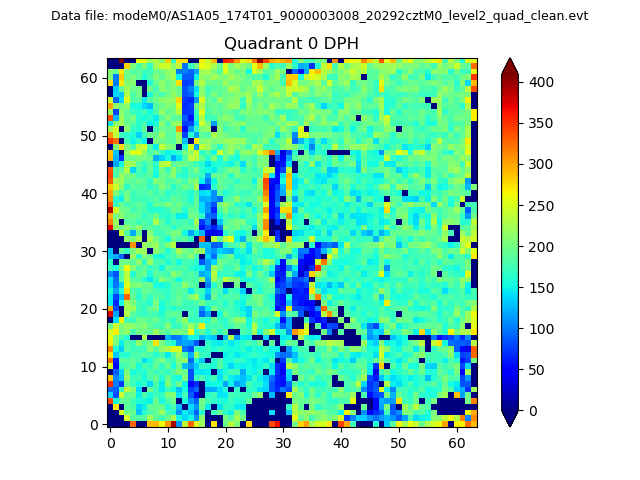 |
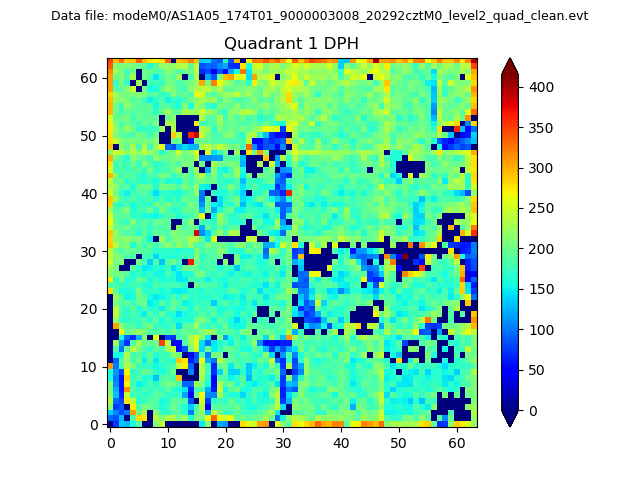 |
Quadrant B |
|---|---|---|---|
| Quadrant D | 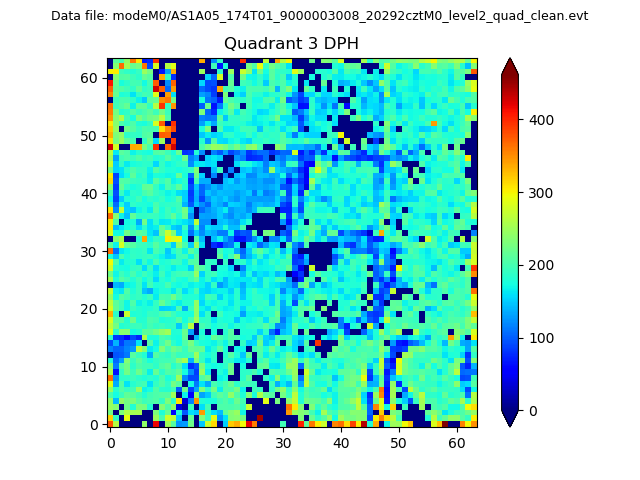 |
 |
Quadrant C |
| Plot type | Count rate plots | Images |
|---|---|---|
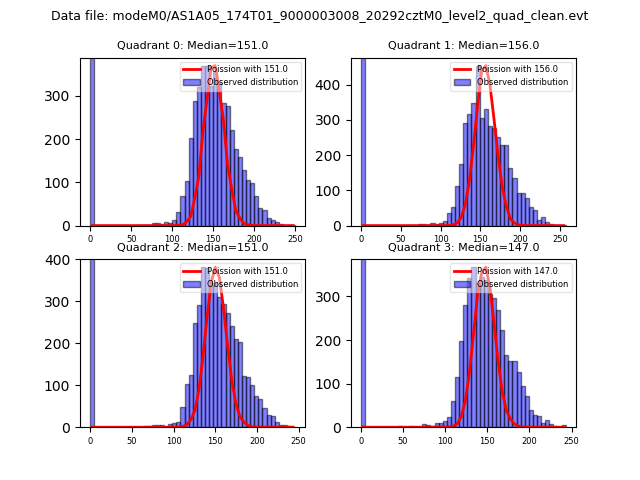
| Comparison with Poisson distribution Blue bars denote a histogram of data divided into 1 sec bins. Red curve is a Poisson curve with rate = median count rate of data. |
 |
 |
| Quadrant-wise count rates Data is divided into 100 sec bins |
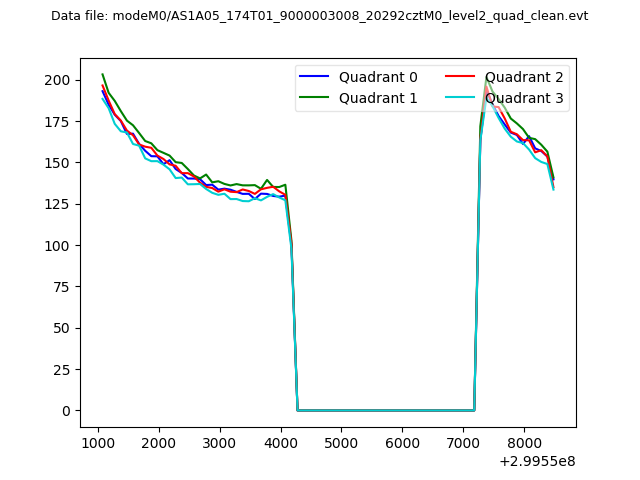 |
|
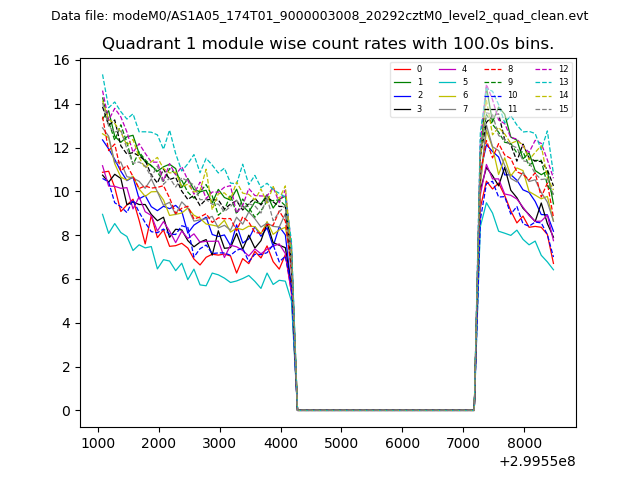
| Module-wise count rates for Quadrant A Data is divided into 100 sec bins |
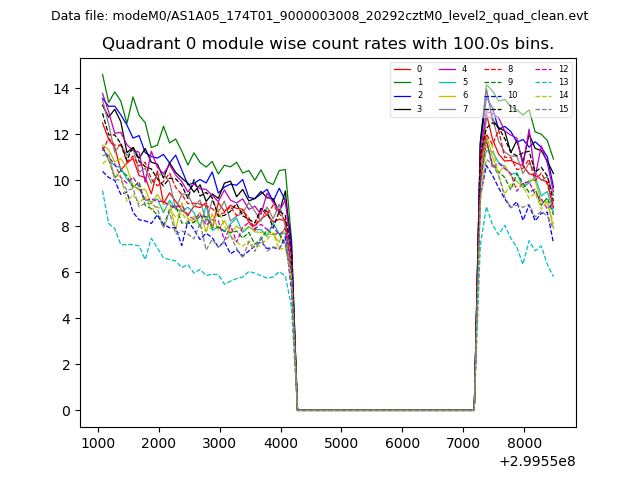 |
 |
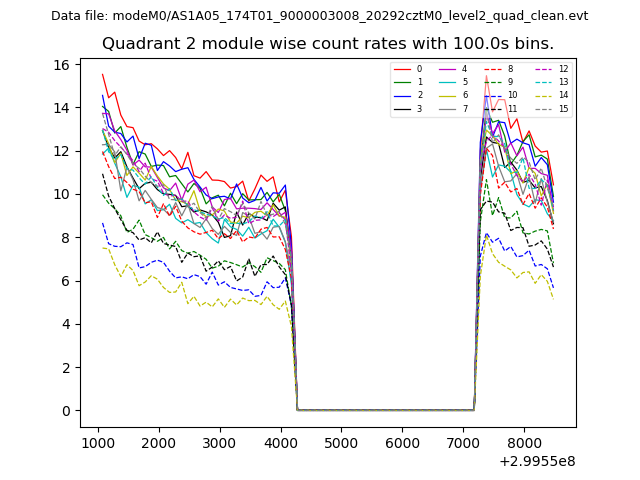
| Module-wise count rates for Quadrant B Data is divided into 100 sec bins |
 |
 |
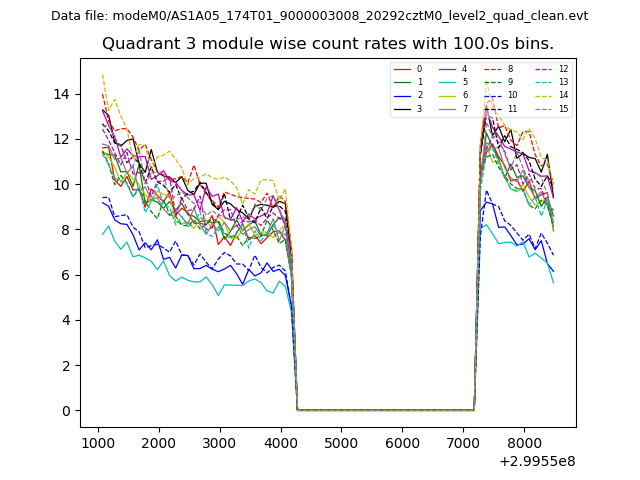
| Module-wise count rates for Quadrant C Data is divided into 100 sec bins |
 |
 |
| Module-wise count rates for Quadrant D Data is divided into 100 sec bins |
 |
 |
| Parameter | Plot |
|---|---|
| CZT HV Monitor | 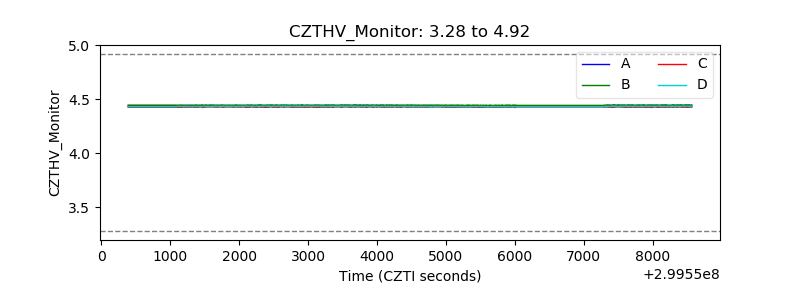 |
| D_VDD |  |
| Temperature 1 | 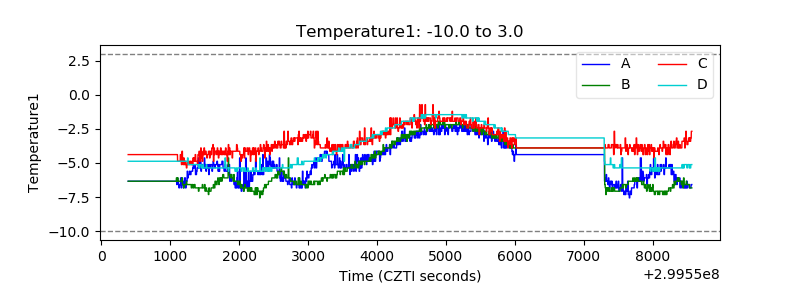 |
| Veto HV Monitor |  |
| Veto LLD | 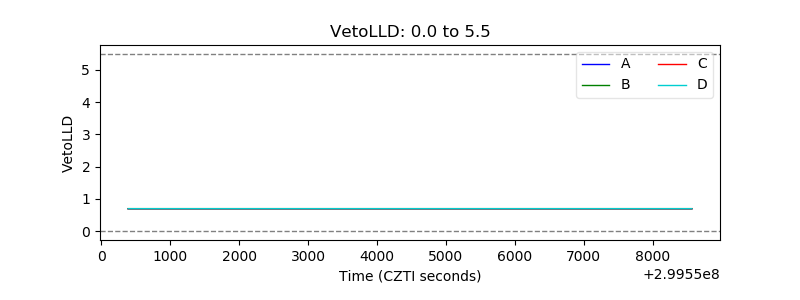 |
| Alpha Counter | 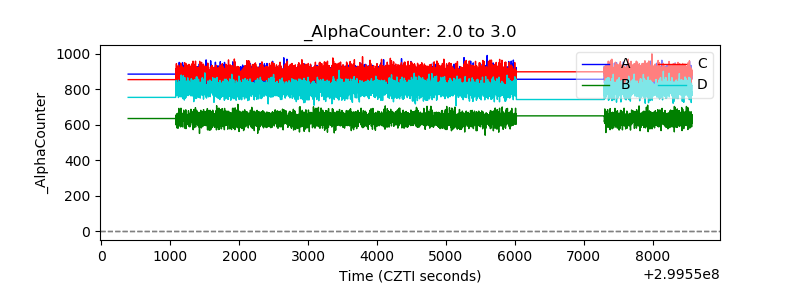 |
| _CPM_Rate | 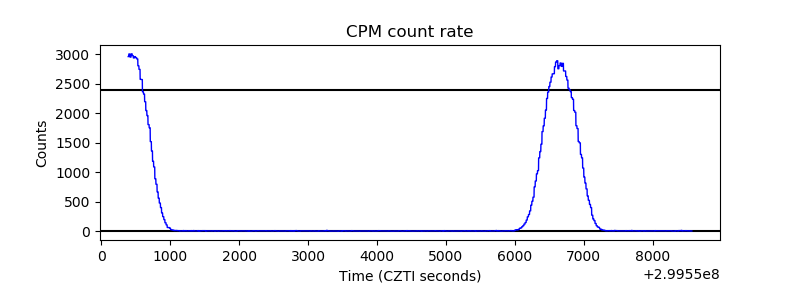 |
| CZT Counter |  |
| +2.5 Volts monitor |  |
| +5 Volts monitor |  |
| _ROLL_ROT | 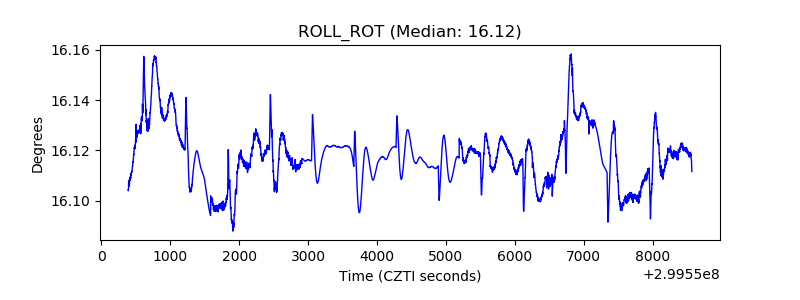 |
| _Roll_DEC | 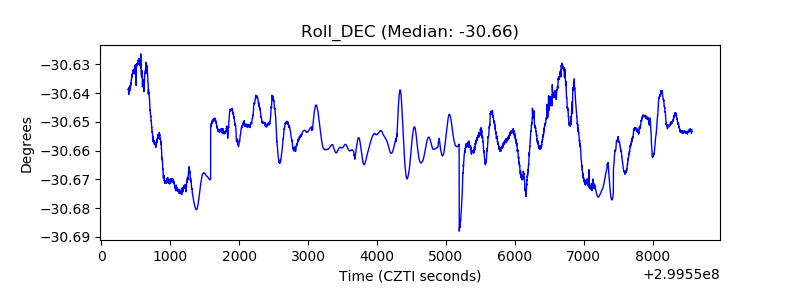 |
| _Roll_RA | 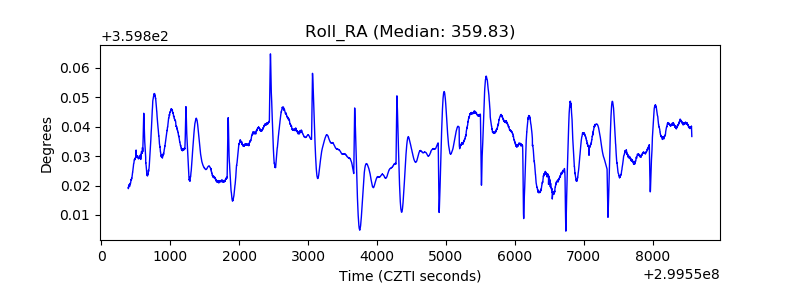 |
| Veto Counter | 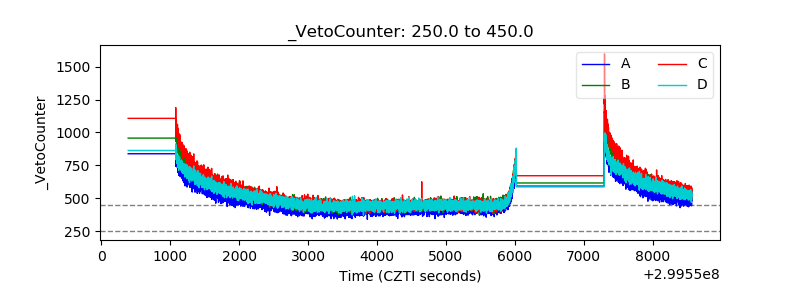 |