| Param | Original file | Final file |
|---|---|---|
| Filename | modeM0/AS1A05_174T01_9000003008_20293cztM0_level2.evt | modeM0/AS1A05_174T01_9000003008_20293cztM0_level2_quad_clean.evt |
| Size (bytes) | 456,390,720 | 100,275,840 |
| Size | 435.2 MB | 95.6 MB |
| Events in quadrant A | 3,415,085 | 649,999 |
| Events in quadrant B | 3,365,195 | 669,067 |
| Events in quadrant C | 3,357,373 | 647,243 |
| Events in quadrant D | 3,258,292 | 632,925 |
| Mode M9 | |||
|---|---|---|---|
| Quadrant | BADHDUFLAG | Total packets | Discarded packets |
| A | 0 | 22 | 0 |
| B | 0 | 23 | 0 |
| C | 0 | 23 | 0 |
| D | 0 | 23 | 0 |
| Mode M0 | |||
|---|---|---|---|
| Quadrant | BADHDUFLAG | Total packets | Discarded packets |
| A | 0 | 13812 | 2 |
| B | 0 | 13783 | 2 |
| C | 0 | 13712 | 2 |
| D | 0 | 13517 | 2 |
| Mode SS | |||
|---|---|---|---|
| Quadrant | BADHDUFLAG | Total packets | Discarded packets |
| A | 0 | 128 | 0 |
| B | 0 | 128 | 0 |
| C | 0 | 128 | 0 |
| D | 0 | 128 | 0 |
| Quadrant | Total seconds | Saturated seconds | Saturation percentage |
|---|---|---|---|
| A | 6269 | 46 | 0.733769% |
| B | 6269 | 76 | 1.212315% |
| C | 6269 | 96 | 1.531345% |
| D | 6269 | 46 | 0.733769% |
Noise dominated data is calculated using 1-second bins in cleaned event files. If a bin has >2000 counts, and if more than 50% of those come from <1% of pixels, then it is considered to be noise-dominated and hence unusable.
| Quadrant | # 1 sec bins | Bins with >0 counts | Bins with >2000 counts | High rate bins dominated by noise | Noise dominated (total time) | Noise dominated (detector-on time) | Marked lightcurve |
|---|---|---|---|---|---|---|---|
| A | 7594 | 6270 | 8 | 8 | 0.11% | 0.13% | 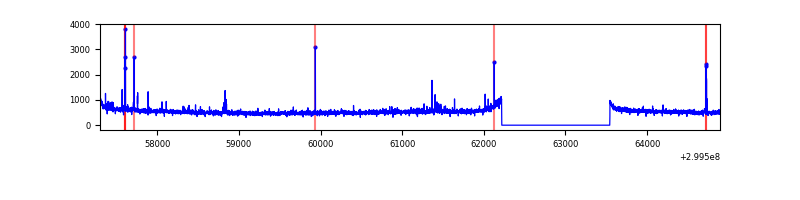 |
| B | 7594 | 6270 | 10 | 10 | 0.13% | 0.16% | 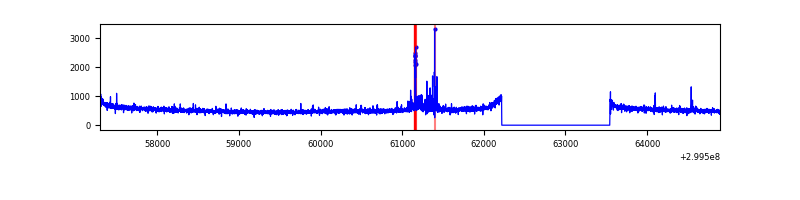 |
| C | 7594 | 6270 | 0 | 0 | 0.00% | 0.00% | 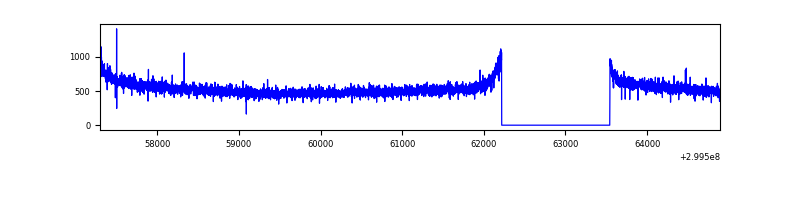 |
| D | 7594 | 6270 | 4 | 4 | 0.05% | 0.06% | 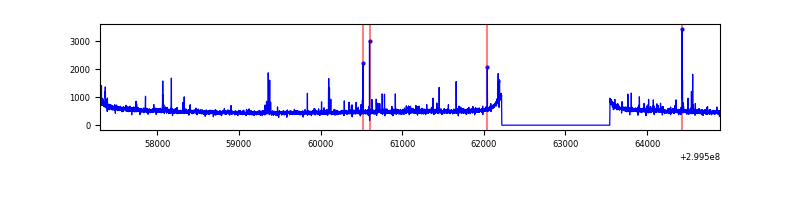 |
Top three noisy pixels from each quadrant. If the there are fewer than three noisy pixels in the level2.evt file, extra rows are filled as -1
| Pixel properties | Quadrant properties | ||||||
|---|---|---|---|---|---|---|---|
| Quadrant | DetID | PixID | Counts | Sigma | Mean | Median | Sigma |
| A | 8 | 205 | 113871 | 680.1 | 834 | 819 | 166.2 |
| A | 4 | 2 | 41516 | 244.83 | 834 | 819 | 166.2 |
| A | 14 | 238 | 24326 | 141.41 | 834 | 819 | 166.2 |
| B | 7 | 220 | 84197 | 539.42 | 832 | 811 | 154.6 |
| B | 12 | 111 | 17901 | 110.55 | 832 | 811 | 154.6 |
| B | 11 | 111 | 15710 | 96.38 | 832 | 811 | 154.6 |
| C | 14 | 238 | 129922 | 680.45 | 819 | 827 | 189.7 |
| C | 0 | 207 | 10090 | 48.82 | 819 | 827 | 189.7 |
| C | 3 | 233 | 9655 | 46.53 | 819 | 827 | 189.7 |
| D | 1 | 52 | 81437 | 399.17 | 831 | 810 | 202.0 |
| D | 2 | 120 | 29020 | 139.66 | 831 | 810 | 202.0 |
| D | 2 | 234 | 24552 | 117.54 | 831 | 810 | 202.0 |
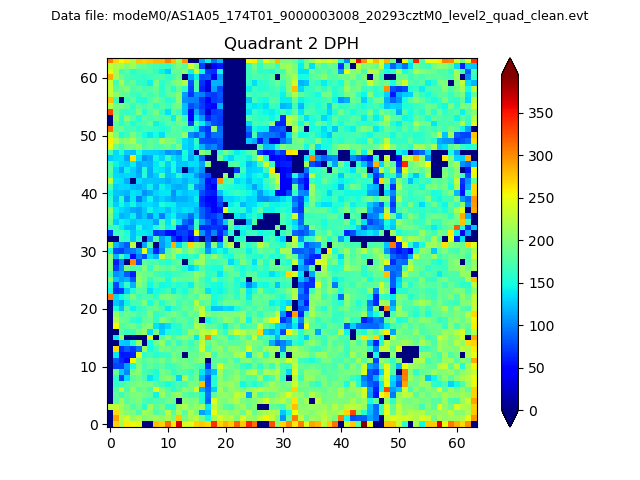
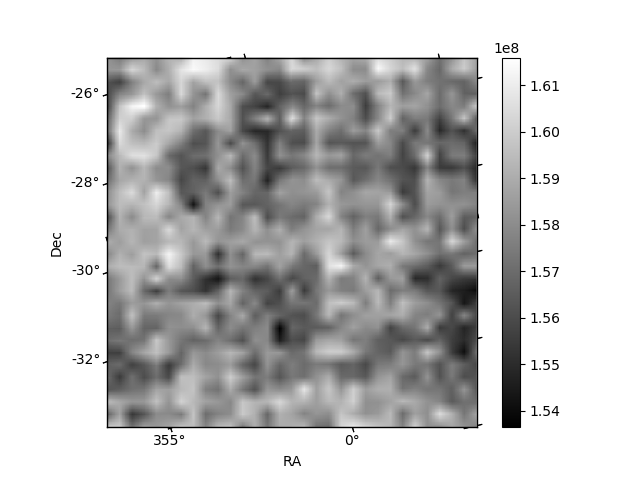
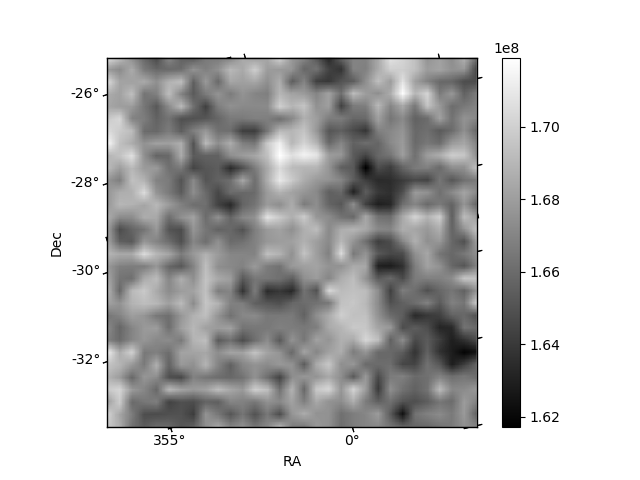
Histogram calculated using DETX and DETY for each event in the final _common_clean file
| Quadrant A | 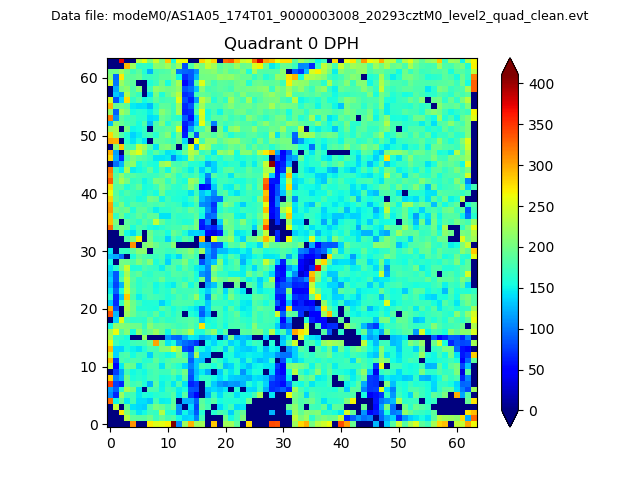 |
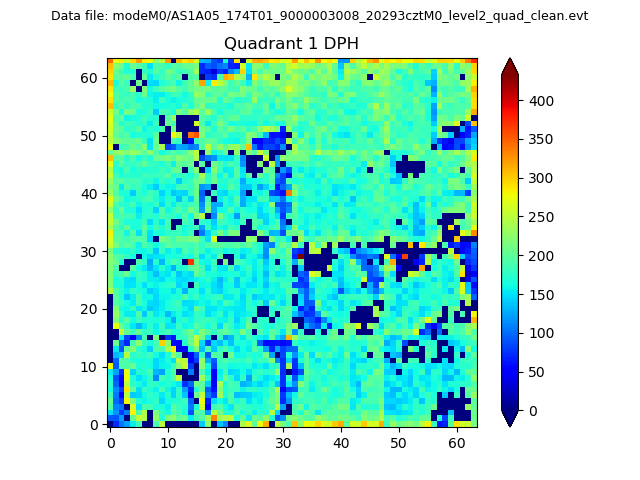 |
Quadrant B |
|---|---|---|---|
| Quadrant D | 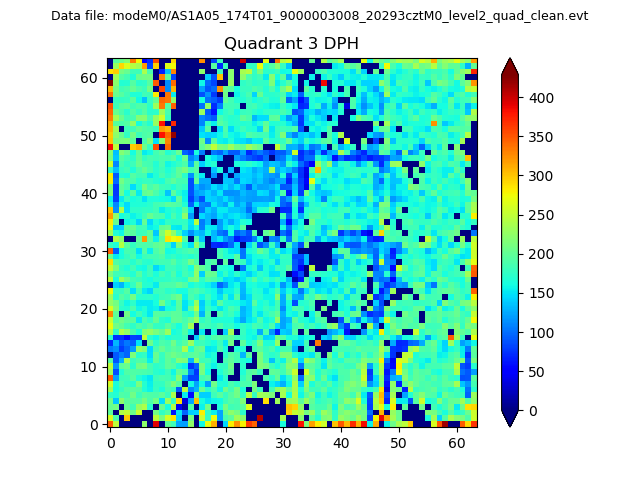 |
 |
Quadrant C |
| Plot type | Count rate plots | Images |
|---|---|---|
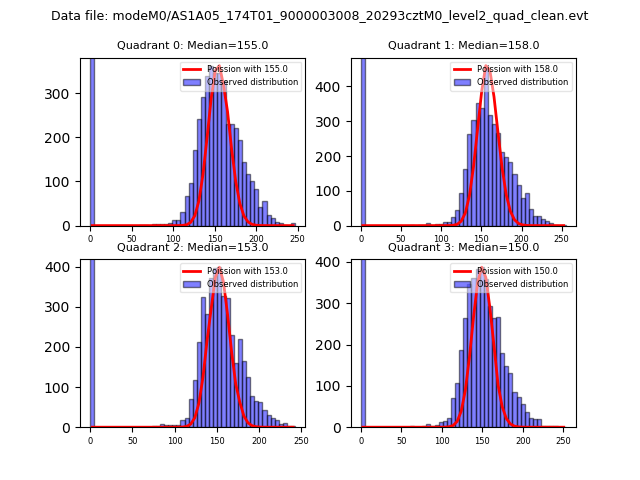
| Comparison with Poisson distribution Blue bars denote a histogram of data divided into 1 sec bins. Red curve is a Poisson curve with rate = median count rate of data. |
 |
 |
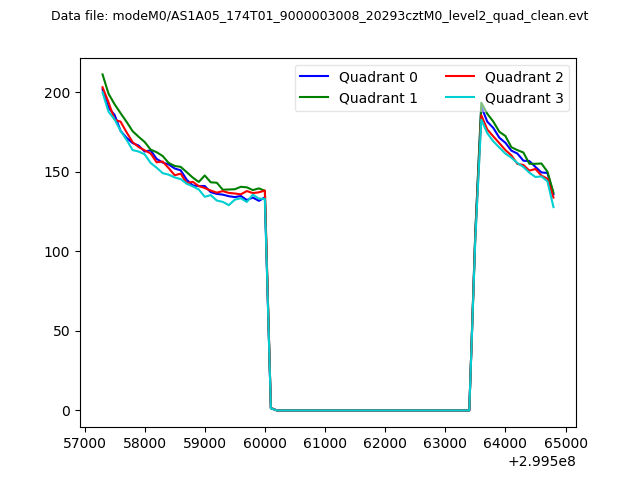
| Quadrant-wise count rates Data is divided into 100 sec bins |
 |
|
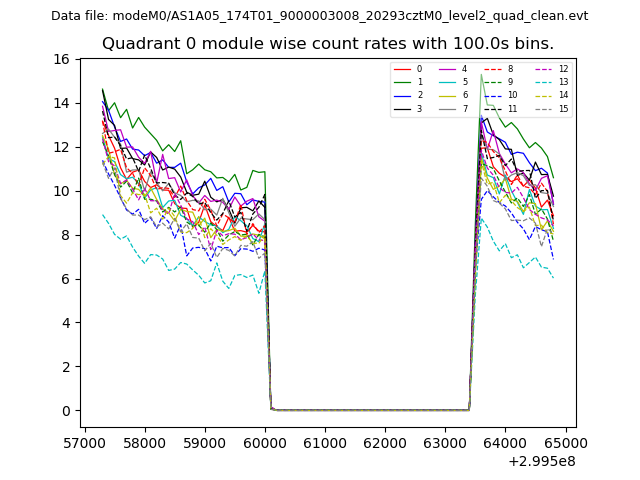
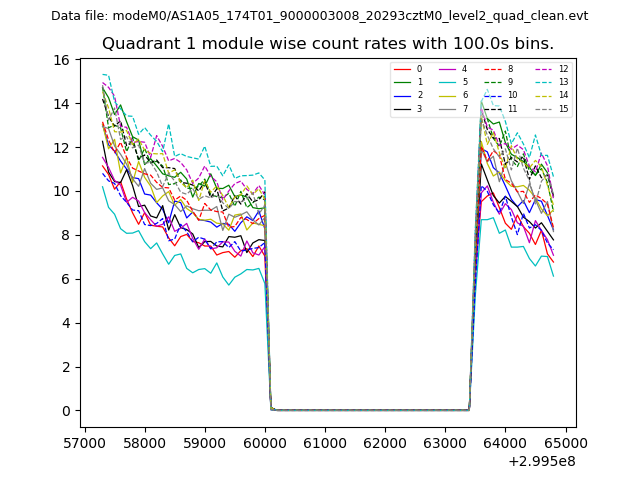
| Module-wise count rates for Quadrant A Data is divided into 100 sec bins |
 |
 |
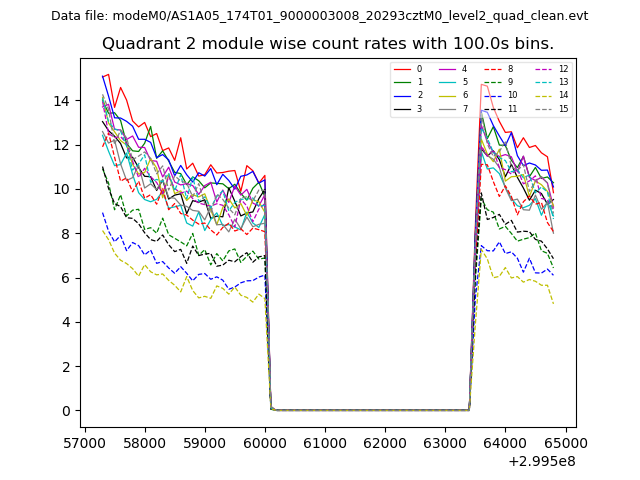
| Module-wise count rates for Quadrant B Data is divided into 100 sec bins |
 |
 |
| Module-wise count rates for Quadrant C Data is divided into 100 sec bins |
 |
 |
| Module-wise count rates for Quadrant D Data is divided into 100 sec bins |
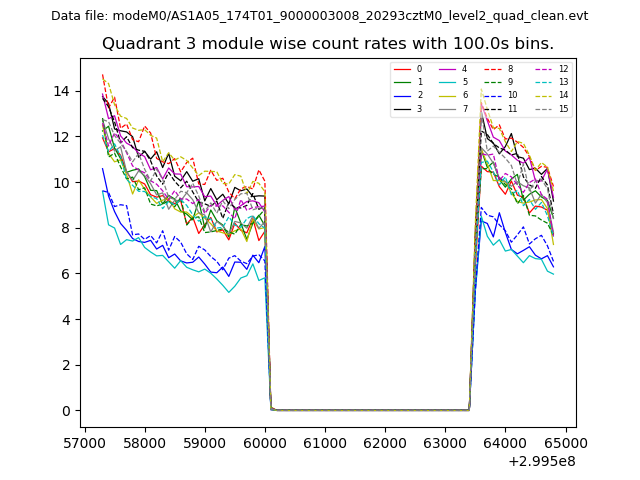 |
 |
| Parameter | Plot |
|---|---|
| CZT HV Monitor | 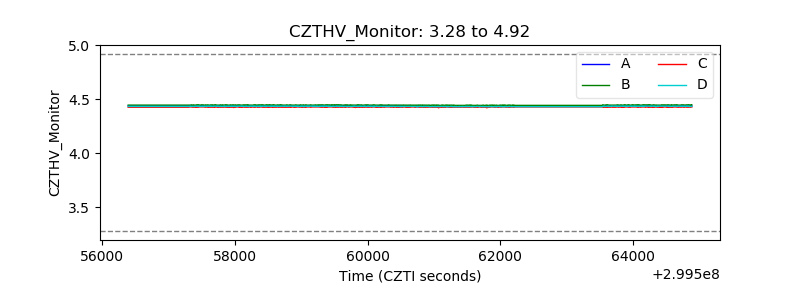 |
| D_VDD | 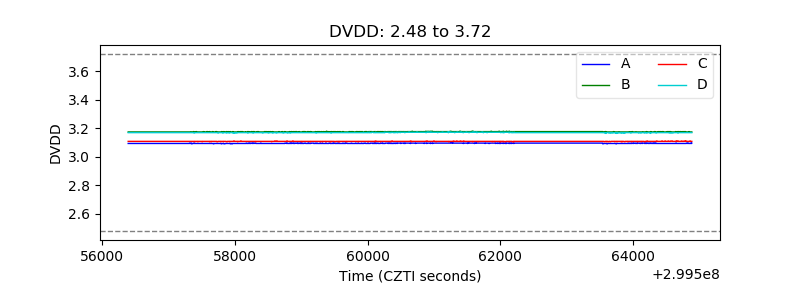 |
| Temperature 1 | 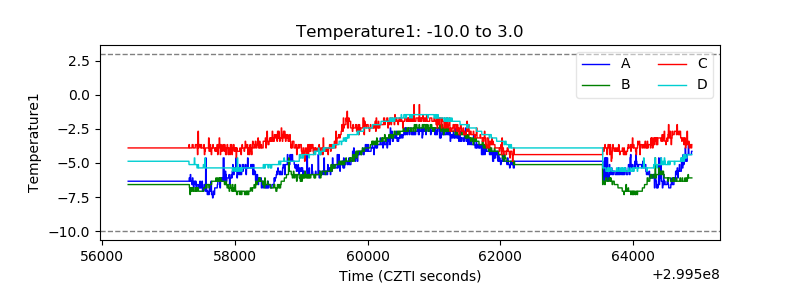 |
| Veto HV Monitor | 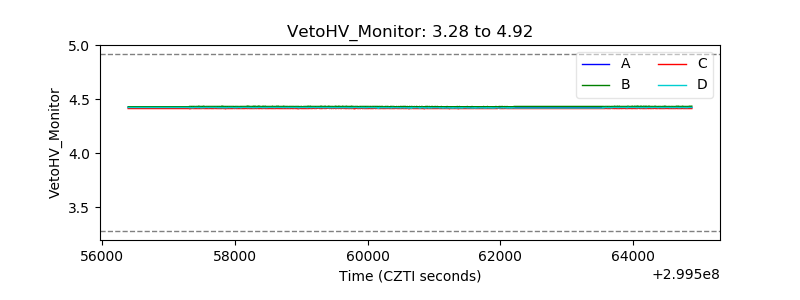 |
| Veto LLD | 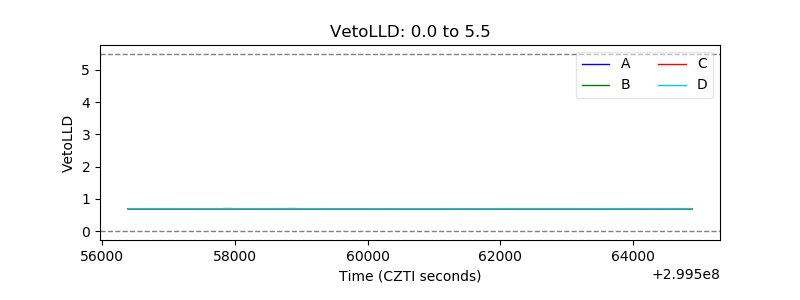 |
| Alpha Counter |  |
| _CPM_Rate | 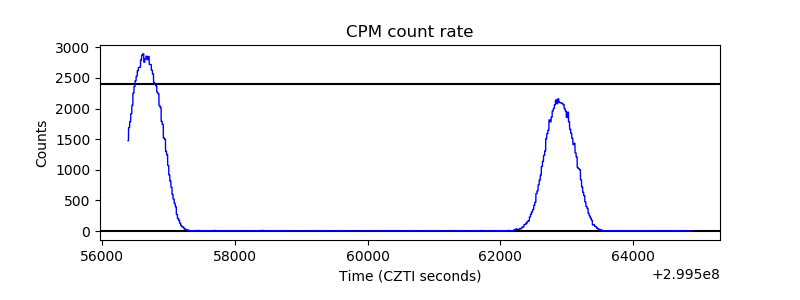 |
| CZT Counter | 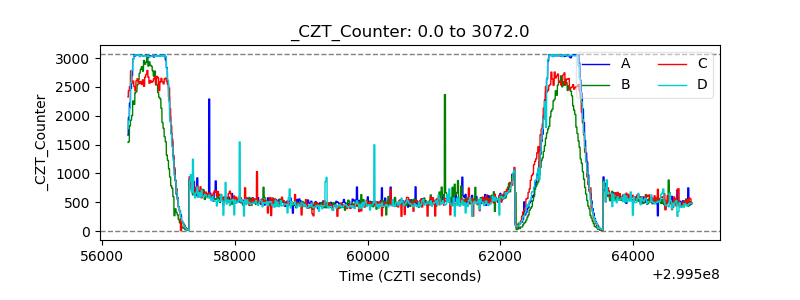 |
| +2.5 Volts monitor |  |
| +5 Volts monitor |  |
| _ROLL_ROT | 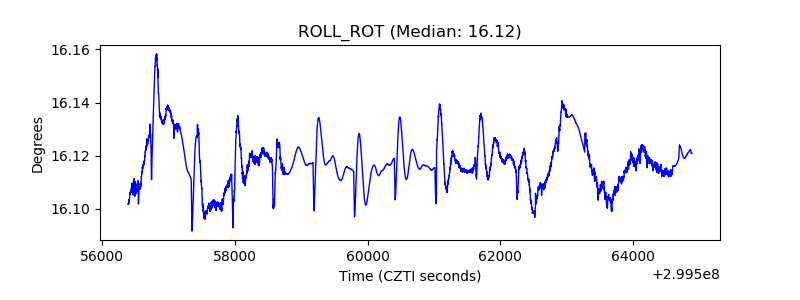 |
| _Roll_DEC | 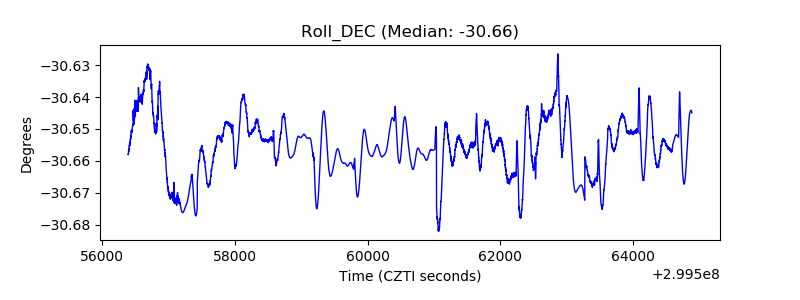 |
| _Roll_RA | 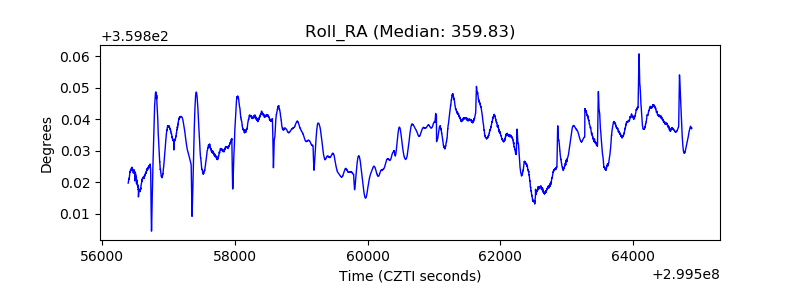 |
| Veto Counter | 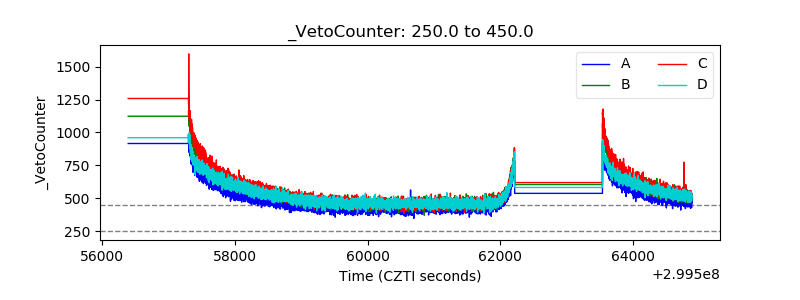 |