| Param | Original file | Final file |
|---|---|---|
| Filename | modeM0/AS1A05_174T01_9000003008_20294cztM0_level2.evt | modeM0/AS1A05_174T01_9000003008_20294cztM0_level2_quad_clean.evt |
| Size (bytes) | 471,672,000 | 97,534,080 |
| Size | 449.8 MB | 93.0 MB |
| Events in quadrant A | 3,368,891 | 632,877 |
| Events in quadrant B | 3,344,828 | 647,237 |
| Events in quadrant C | 3,361,936 | 623,013 |
| Events in quadrant D | 3,779,264 | 609,228 |
| Mode M9 | |||
|---|---|---|---|
| Quadrant | BADHDUFLAG | Total packets | Discarded packets |
| A | 0 | 15 | 0 |
| B | 0 | 16 | 0 |
| C | 0 | 16 | 0 |
| D | 0 | 16 | 0 |
| Mode M0 | |||
|---|---|---|---|
| Quadrant | BADHDUFLAG | Total packets | Discarded packets |
| A | 0 | 13672 | 2 |
| B | 0 | 13696 | 2 |
| C | 0 | 13737 | 2 |
| D | 0 | 15179 | 2 |
| Mode SS | |||
|---|---|---|---|
| Quadrant | BADHDUFLAG | Total packets | Discarded packets |
| A | 0 | 130 | 0 |
| B | 0 | 130 | 0 |
| C | 0 | 130 | 0 |
| D | 0 | 130 | 0 |
| Quadrant | Total seconds | Saturated seconds | Saturation percentage |
|---|---|---|---|
| A | 6328 | 61 | 0.963970% |
| B | 6328 | 86 | 1.359039% |
| C | 6328 | 97 | 1.532870% |
| D | 6328 | 244 | 3.855879% |
Noise dominated data is calculated using 1-second bins in cleaned event files. If a bin has >2000 counts, and if more than 50% of those come from <1% of pixels, then it is considered to be noise-dominated and hence unusable.
| Quadrant | # 1 sec bins | Bins with >0 counts | Bins with >2000 counts | High rate bins dominated by noise | Noise dominated (total time) | Noise dominated (detector-on time) | Marked lightcurve |
|---|---|---|---|---|---|---|---|
| A | 7618 | 6330 | 7 | 7 | 0.09% | 0.11% | 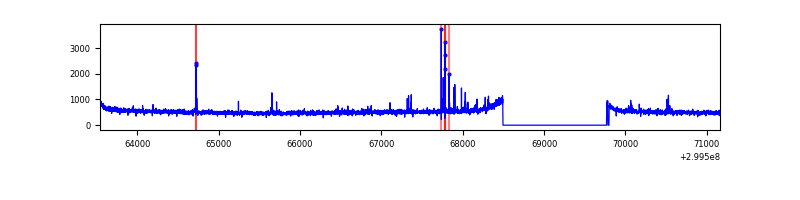 |
| B | 7618 | 6330 | 5 | 5 | 0.07% | 0.08% | 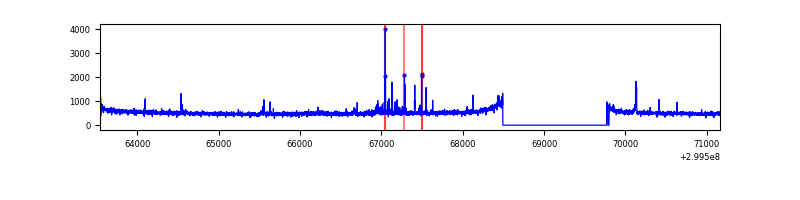 |
| C | 7618 | 6330 | 0 | 0 | 0.00% | 0.00% | 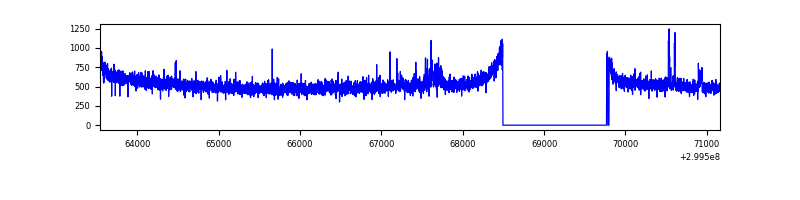 |
| D | 7618 | 6330 | 186 | 186 | 2.44% | 2.94% | 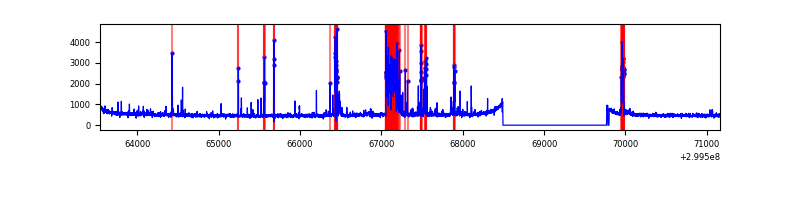 |
Top three noisy pixels from each quadrant. If the there are fewer than three noisy pixels in the level2.evt file, extra rows are filled as -1
| Pixel properties | Quadrant properties | ||||||
|---|---|---|---|---|---|---|---|
| Quadrant | DetID | PixID | Counts | Sigma | Mean | Median | Sigma |
| A | 8 | 205 | 88281 | 527.17 | 830 | 815 | 165.9 |
| A | 14 | 238 | 52973 | 314.36 | 830 | 815 | 165.9 |
| A | 9 | 143 | 12770 | 72.05 | 830 | 815 | 165.9 |
| B | 7 | 220 | 54707 | 350.84 | 823 | 804 | 153.6 |
| B | 0 | 230 | 47559 | 304.31 | 823 | 804 | 153.6 |
| B | 12 | 111 | 18028 | 112.1 | 823 | 804 | 153.6 |
| C | 14 | 238 | 127324 | 674.43 | 807 | 815 | 187.6 |
| C | 3 | 247 | 56538 | 297.07 | 807 | 815 | 187.6 |
| C | 3 | 9 | 13413 | 67.16 | 807 | 815 | 187.6 |
| D | 1 | 52 | 657491 | 3386.97 | 809 | 789 | 193.9 |
| D | 2 | 120 | 23508 | 117.17 | 809 | 789 | 193.9 |
| D | 2 | 234 | 22887 | 113.97 | 809 | 789 | 193.9 |
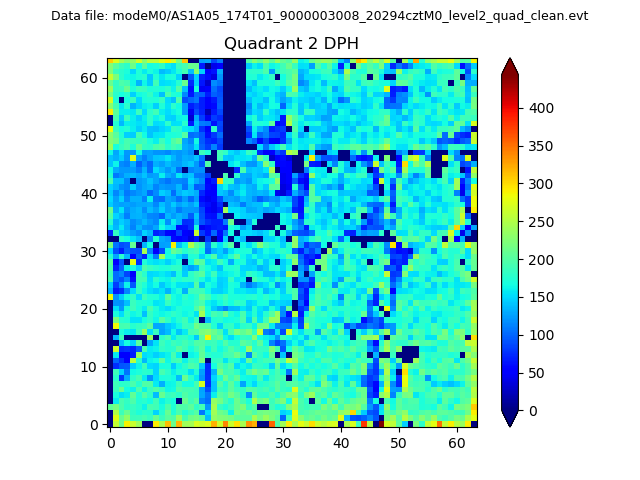
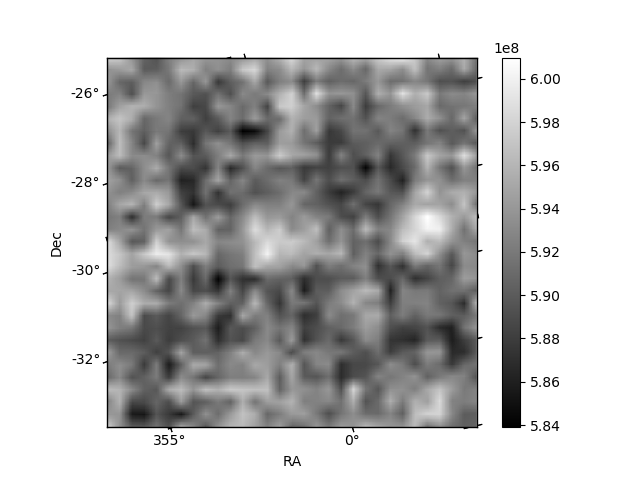
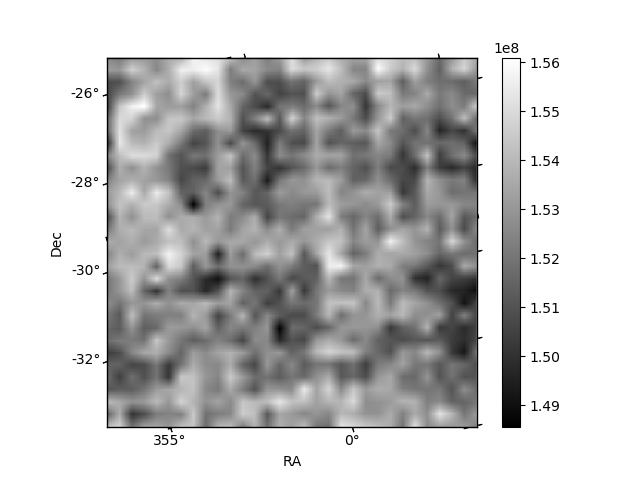
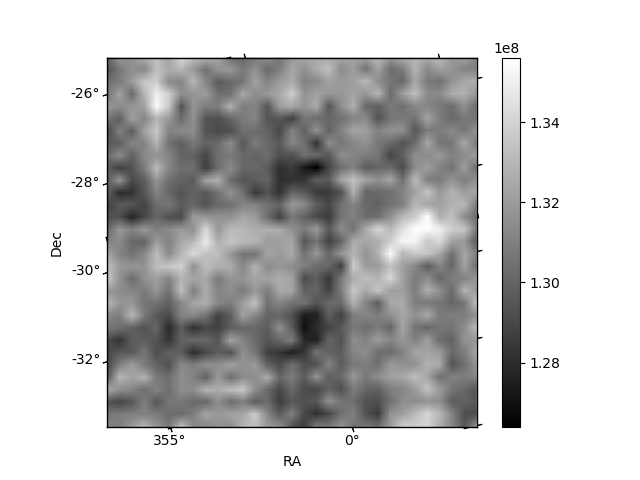
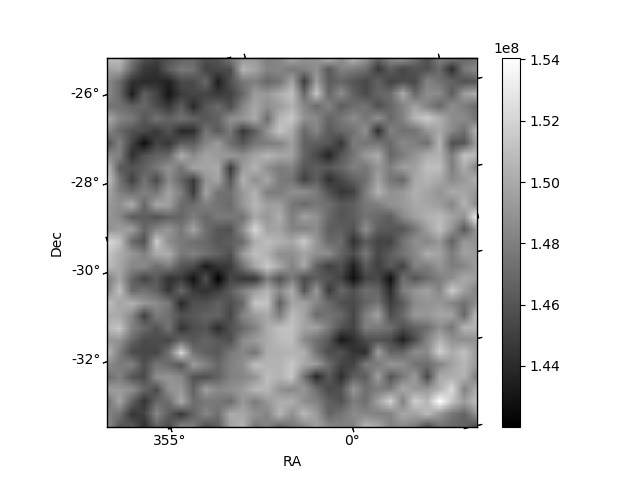
Histogram calculated using DETX and DETY for each event in the final _common_clean file
| Quadrant A | 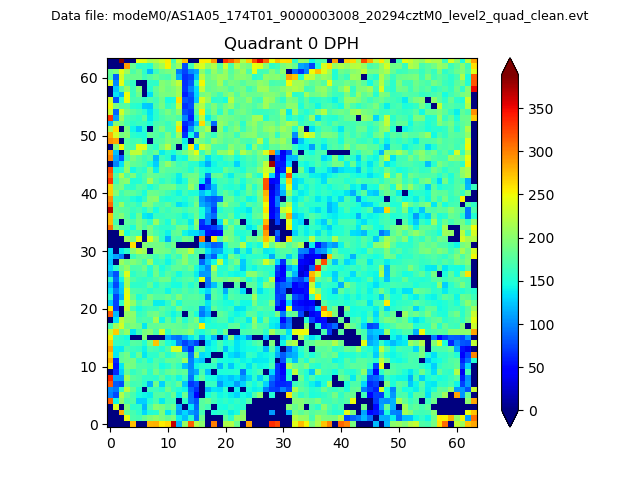 |
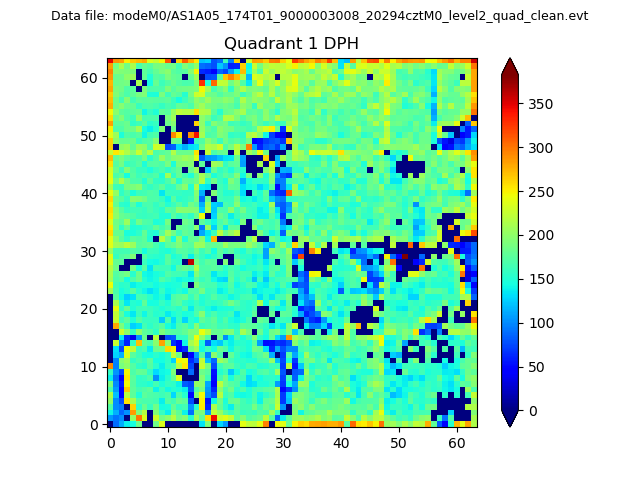 |
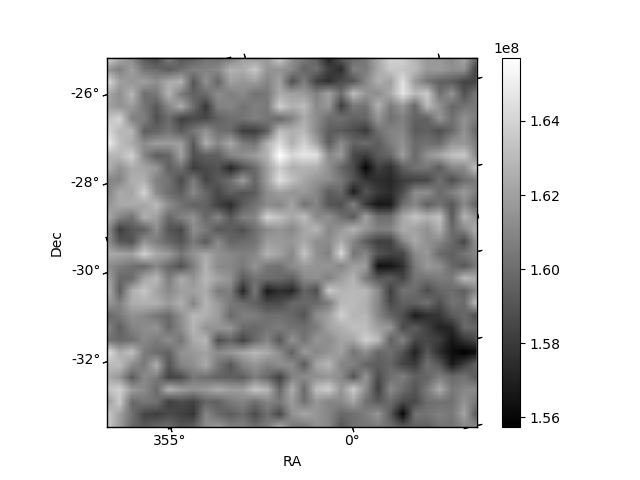
Quadrant B |
|---|---|---|---|
| Quadrant D | 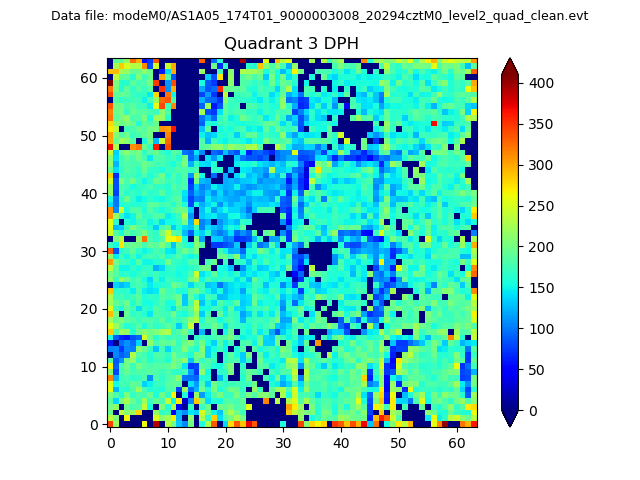 |
 |
Quadrant C |
| Plot type | Count rate plots | Images |
|---|---|---|
| Comparison with Poisson distribution Blue bars denote a histogram of data divided into 1 sec bins. Red curve is a Poisson curve with rate = median count rate of data. |
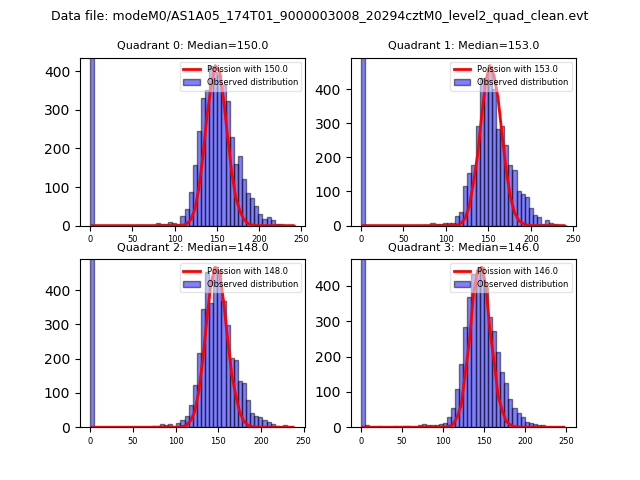 |
 |
| Quadrant-wise count rates Data is divided into 100 sec bins |
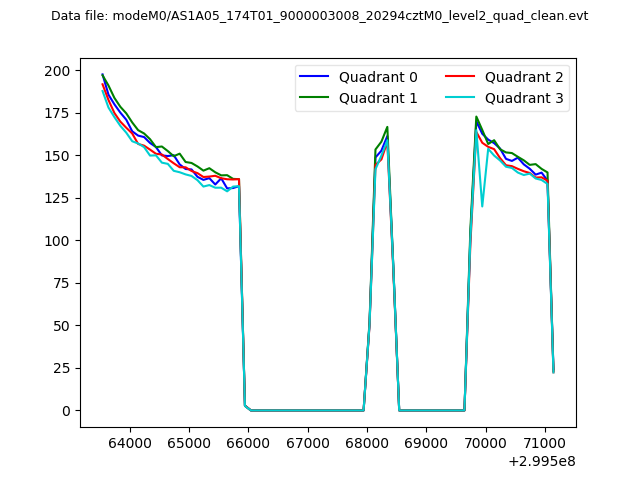 |
|
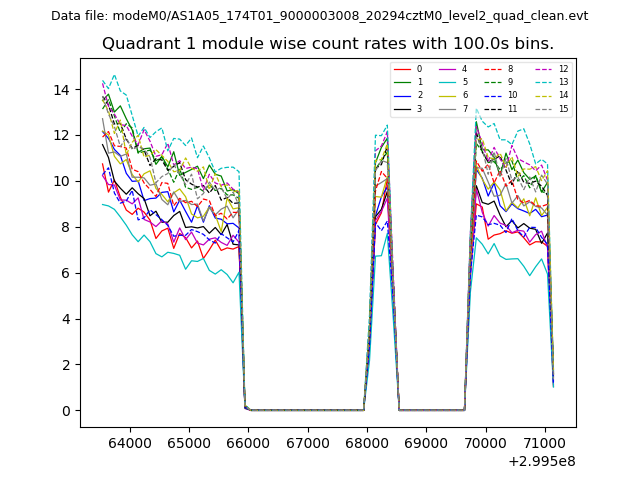
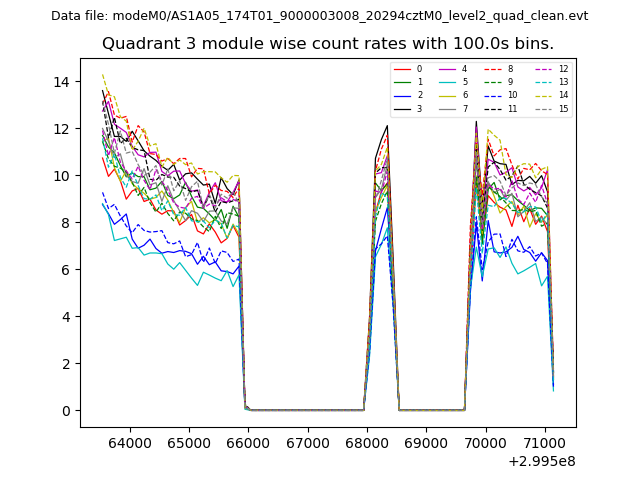
| Module-wise count rates for Quadrant A Data is divided into 100 sec bins |
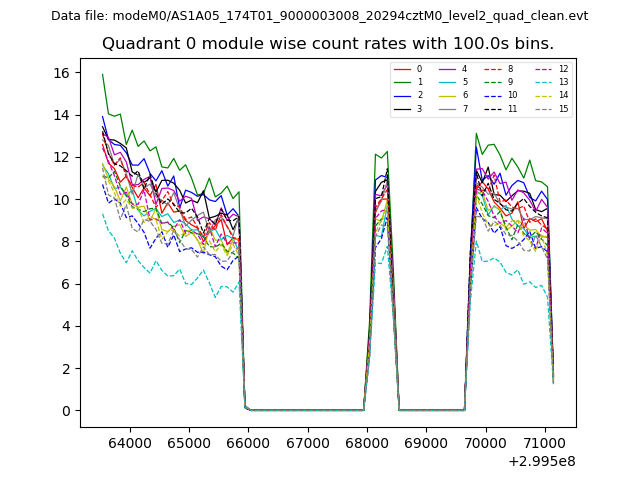 |
 |
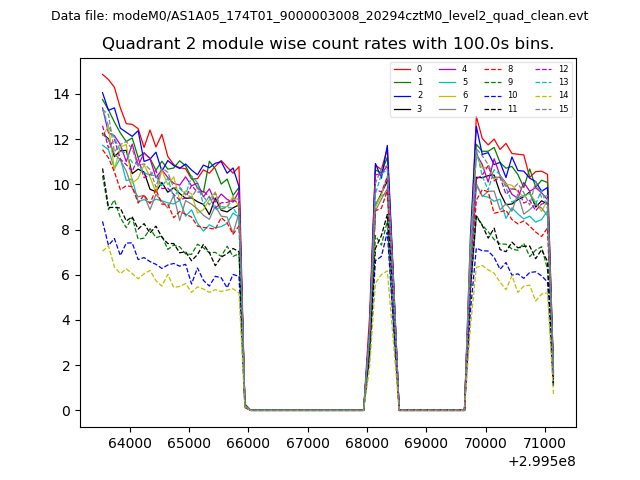
| Module-wise count rates for Quadrant B Data is divided into 100 sec bins |
 |
 |
| Module-wise count rates for Quadrant C Data is divided into 100 sec bins |
 |
 |
| Module-wise count rates for Quadrant D Data is divided into 100 sec bins |
 |
 |
| Parameter | Plot |
|---|---|
| CZT HV Monitor | 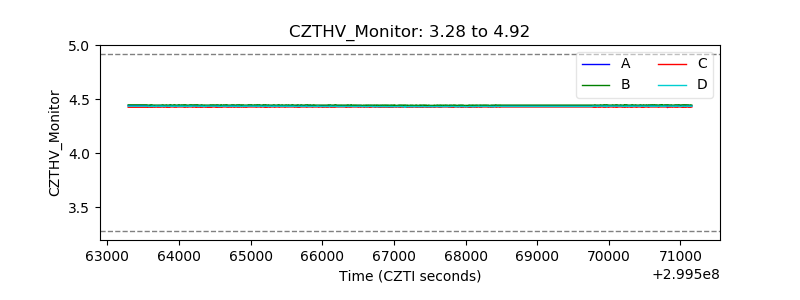 |
| D_VDD | 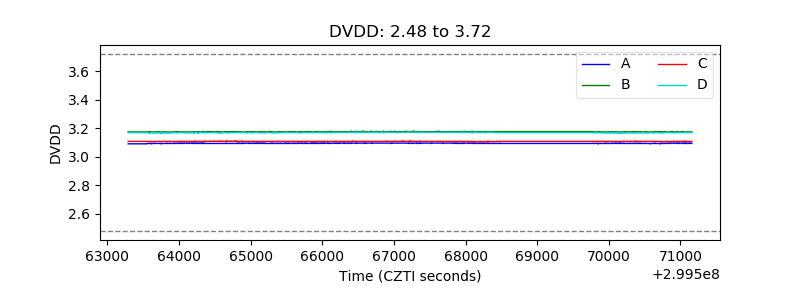 |
| Temperature 1 | 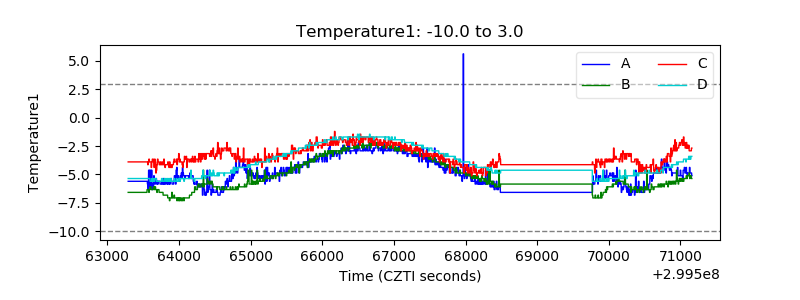 |
| Veto HV Monitor | 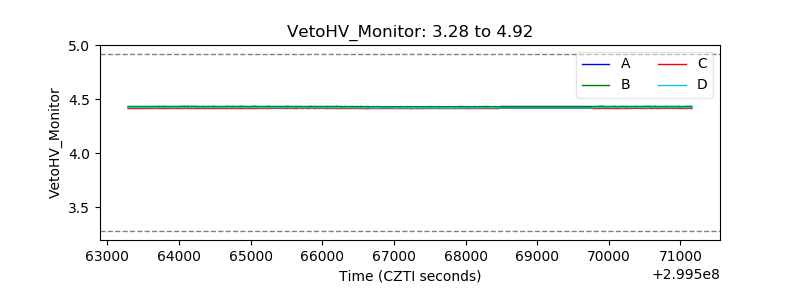 |
| Veto LLD | 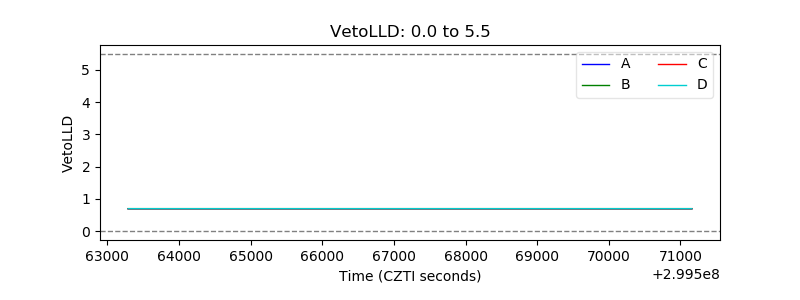 |
| Alpha Counter | 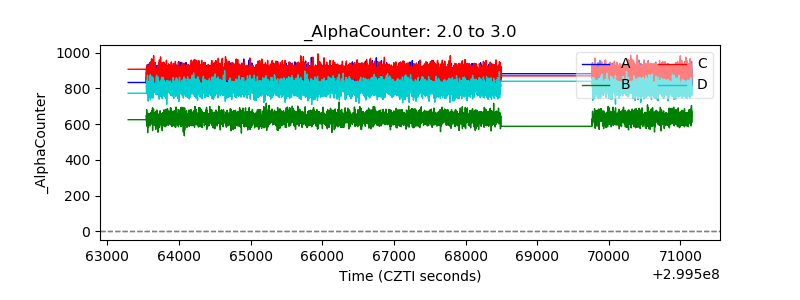 |
| _CPM_Rate | 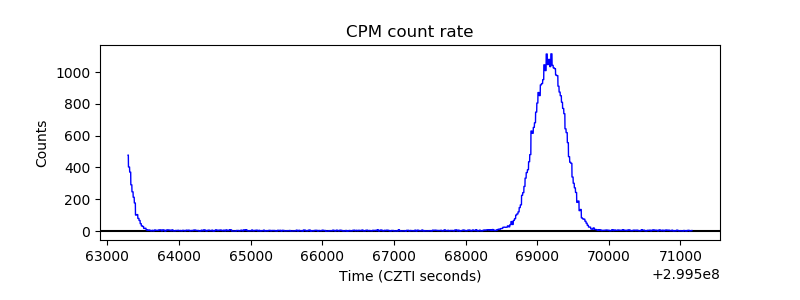 |
| CZT Counter | 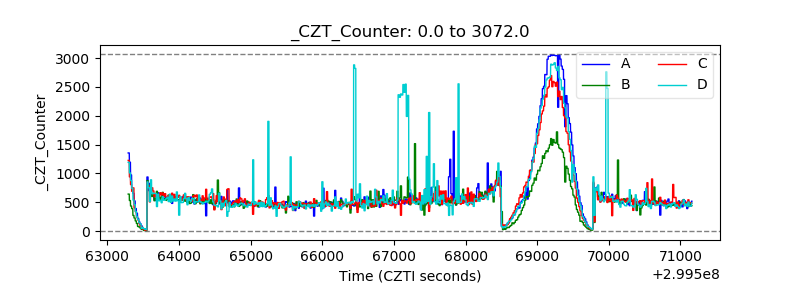 |
| +2.5 Volts monitor | 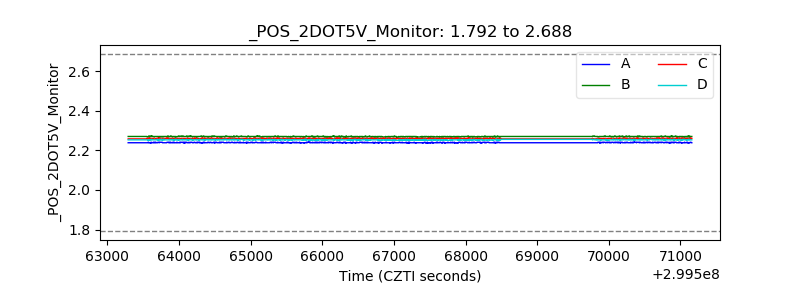 |
| +5 Volts monitor | 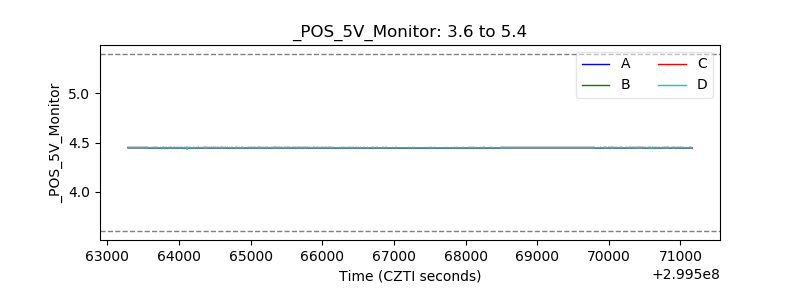 |
| _ROLL_ROT | 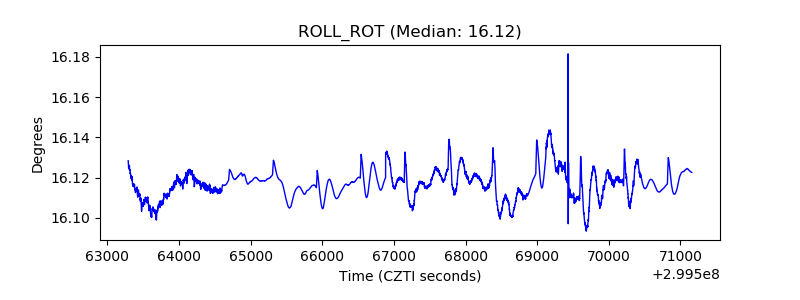 |
| _Roll_DEC | 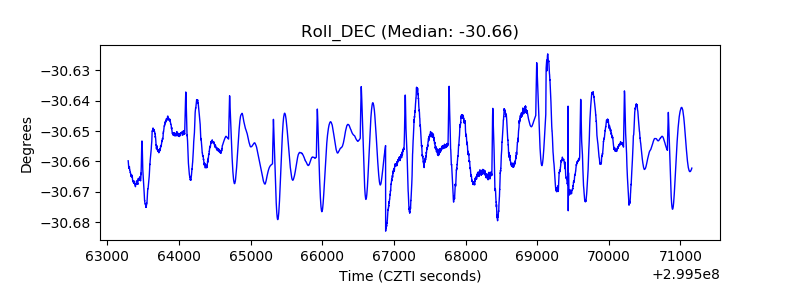 |
| _Roll_RA | 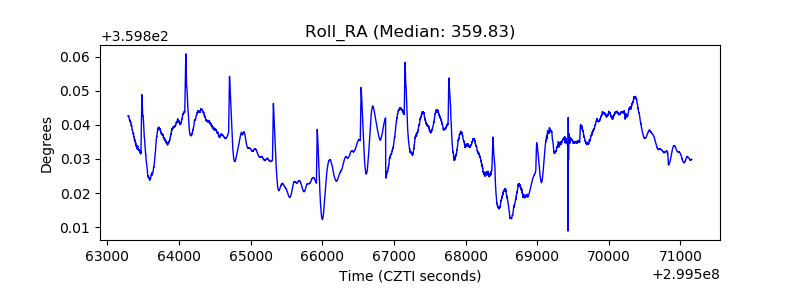 |
| Veto Counter | 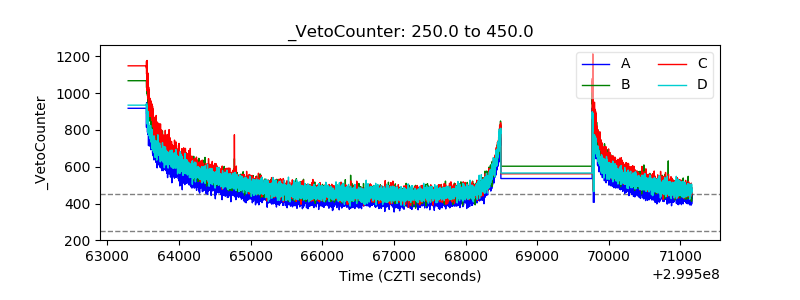 |