| Param | Original file | Final file |
|---|---|---|
| Filename | modeM0/AS1A05_174T01_9000003008_20298cztM0_level2.evt | modeM0/AS1A05_174T01_9000003008_20298cztM0_level2_quad_clean.evt |
| Size (bytes) | 529,741,440 | 83,528,640 |
| Size | 505.2 MB | 79.7 MB |
| Events in quadrant A | 3,503,483 | 508,261 |
| Events in quadrant B | 4,663,445 | 515,814 |
| Events in quadrant C | 3,577,038 | 499,458 |
| Events in quadrant D | 3,800,378 | 494,364 |
| Mode M9 | |||
|---|---|---|---|
| Quadrant | BADHDUFLAG | Total packets | Discarded packets |
| A | 0 | 2 | 0 |
| B | 0 | 2 | 0 |
| C | 0 | 2 | 0 |
| D | 0 | 2 | 0 |
| Mode M0 | |||
|---|---|---|---|
| Quadrant | BADHDUFLAG | Total packets | Discarded packets |
| A | 0 | 15238 | 1 |
| B | 0 | 18561 | 1 |
| C | 0 | 15180 | 1 |
| D | 0 | 16200 | 1 |
| Mode SS | |||
|---|---|---|---|
| Quadrant | BADHDUFLAG | Total packets | Discarded packets |
| A | 0 | 150 | 0 |
| B | 0 | 150 | 0 |
| C | 0 | 150 | 0 |
| D | 0 | 150 | 0 |
| Quadrant | Total seconds | Saturated seconds | Saturation percentage |
|---|---|---|---|
| A | 7340 | 160 | 2.179837% |
| B | 7341 | 509 | 6.933660% |
| C | 7341 | 170 | 2.315761% |
| D | 7341 | 126 | 1.716387% |
Noise dominated data is calculated using 1-second bins in cleaned event files. If a bin has >2000 counts, and if more than 50% of those come from <1% of pixels, then it is considered to be noise-dominated and hence unusable.
| Quadrant | # 1 sec bins | Bins with >0 counts | Bins with >2000 counts | High rate bins dominated by noise | Noise dominated (total time) | Noise dominated (detector-on time) | Marked lightcurve |
|---|---|---|---|---|---|---|---|
| A | 7595 | 7341 | 3 | 3 | 0.04% | 0.04% | 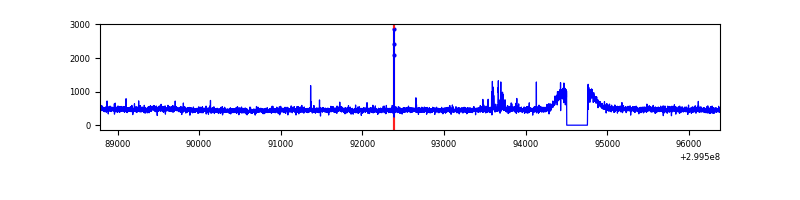 |
| B | 7596 | 7342 | 243 | 243 | 3.20% | 3.31% | 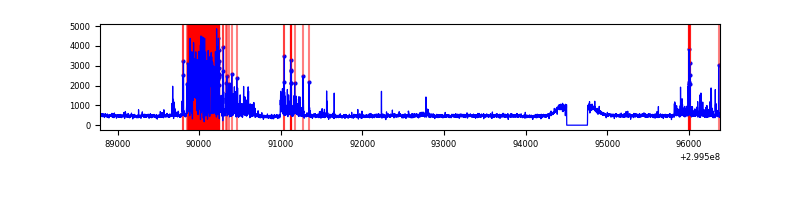 |
| C | 7596 | 7342 | 0 | 0 | 0.00% | 0.00% | 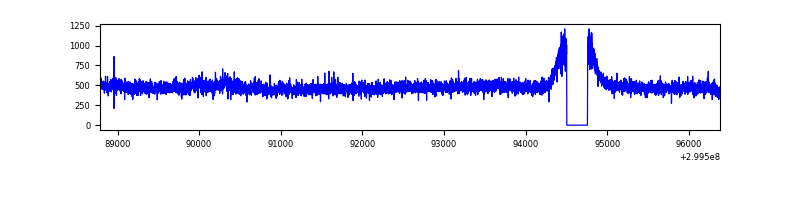 |
| D | 7596 | 7342 | 6 | 6 | 0.08% | 0.08% | 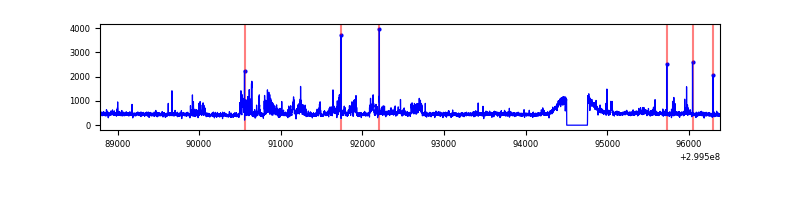 |
Top three noisy pixels from each quadrant. If the there are fewer than three noisy pixels in the level2.evt file, extra rows are filled as -1
| Pixel properties | Quadrant properties | ||||||
|---|---|---|---|---|---|---|---|
| Quadrant | DetID | PixID | Counts | Sigma | Mean | Median | Sigma |
| A | 14 | 238 | 35672 | 191.34 | 895 | 872 | 181.9 |
| A | 11 | 29 | 15335 | 79.52 | 895 | 872 | 181.9 |
| A | 13 | 254 | 10573 | 53.34 | 895 | 872 | 181.9 |
| B | 4 | 142 | 675977 | 4012.12 | 868 | 848 | 168.3 |
| B | 7 | 220 | 245242 | 1452.37 | 868 | 848 | 168.3 |
| B | 0 | 197 | 234550 | 1388.83 | 868 | 848 | 168.3 |
| C | 14 | 238 | 132755 | 650.13 | 859 | 864 | 202.9 |
| C | 0 | 207 | 68765 | 334.7 | 859 | 864 | 202.9 |
| C | 3 | 233 | 20553 | 97.05 | 859 | 864 | 202.9 |
| D | 1 | 52 | 406160 | 1898.68 | 880 | 855 | 213.5 |
| D | 2 | 234 | 33844 | 154.54 | 880 | 855 | 213.5 |
| D | 7 | 223 | 23483 | 106.0 | 880 | 855 | 213.5 |
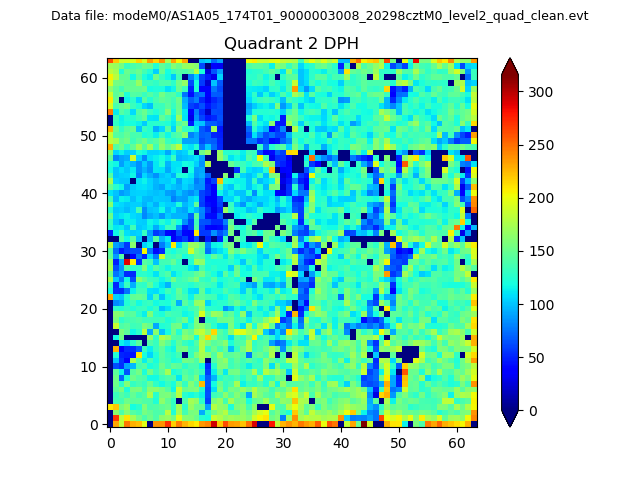
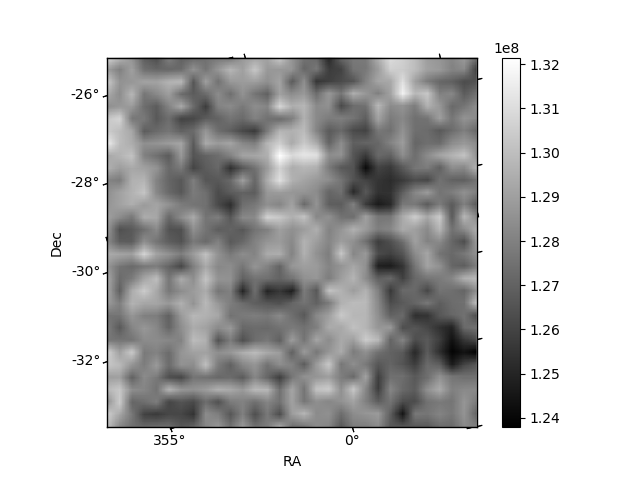
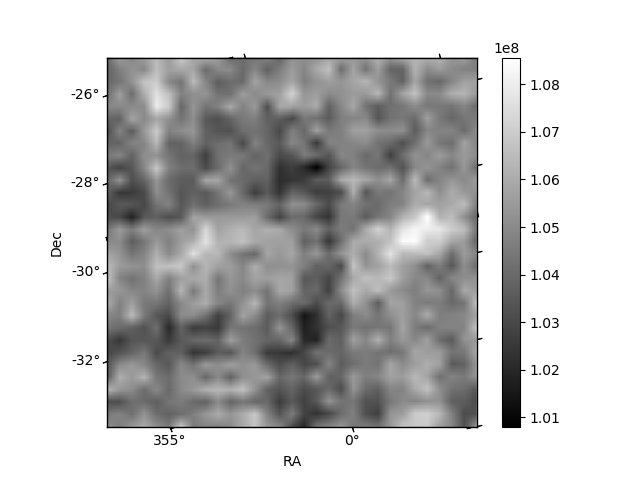
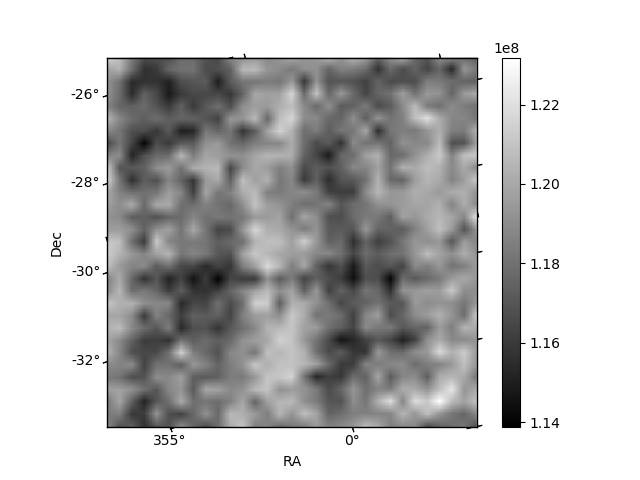
Histogram calculated using DETX and DETY for each event in the final _common_clean file
| Quadrant A | 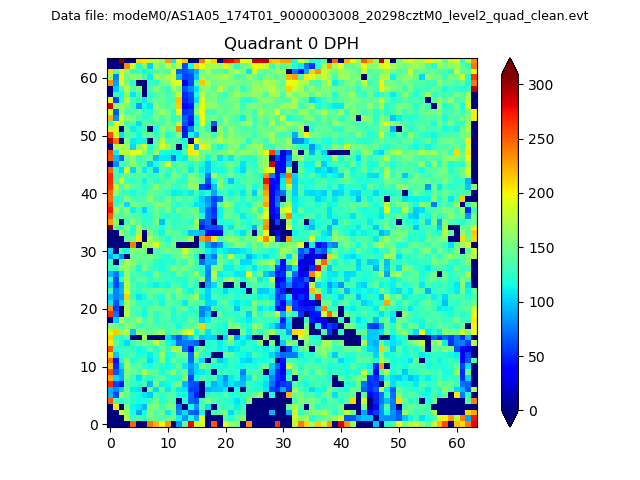 |
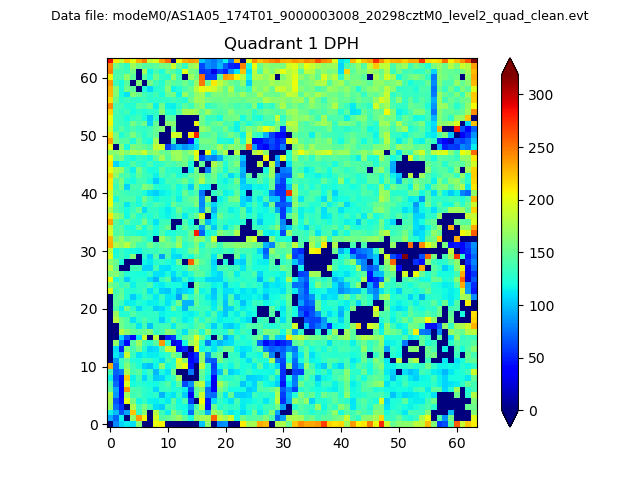 |
Quadrant B |
|---|---|---|---|
| Quadrant D | 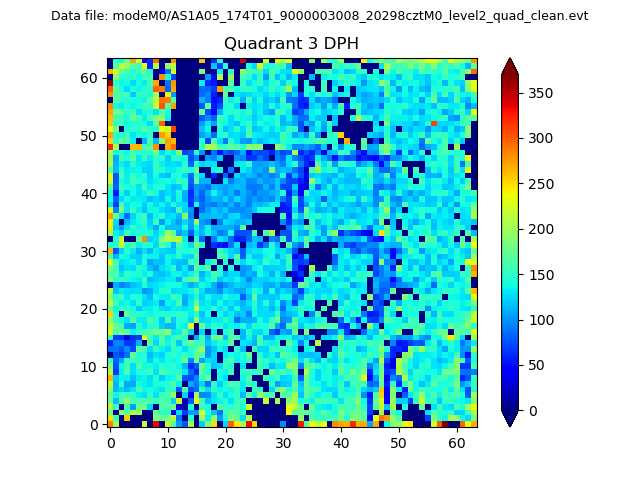 |
 |
Quadrant C |
| Plot type | Count rate plots | Images |
|---|---|---|
| Comparison with Poisson distribution Blue bars denote a histogram of data divided into 1 sec bins. Red curve is a Poisson curve with rate = median count rate of data. |
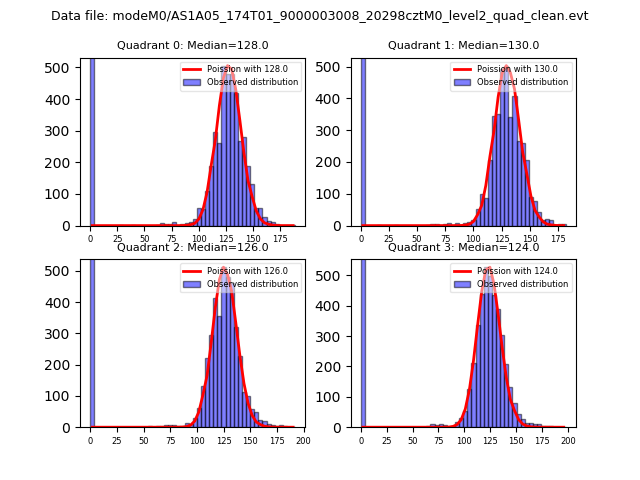 |
 |
| Quadrant-wise count rates Data is divided into 100 sec bins |
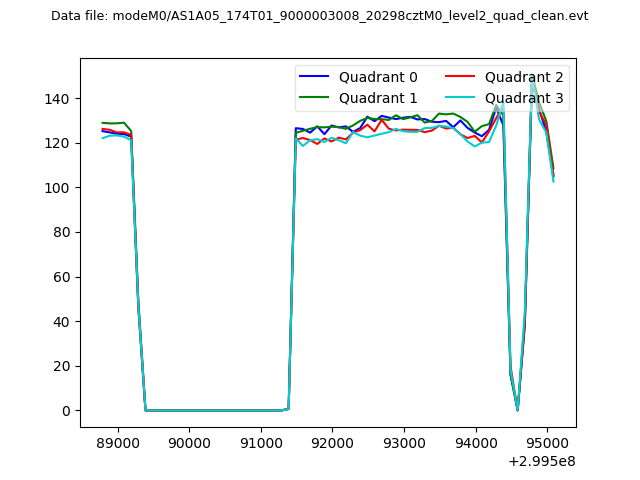 |
|
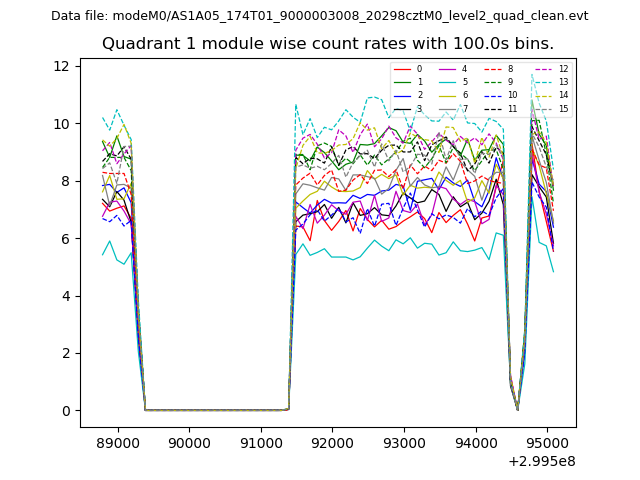
| Module-wise count rates for Quadrant A Data is divided into 100 sec bins |
 |
 |
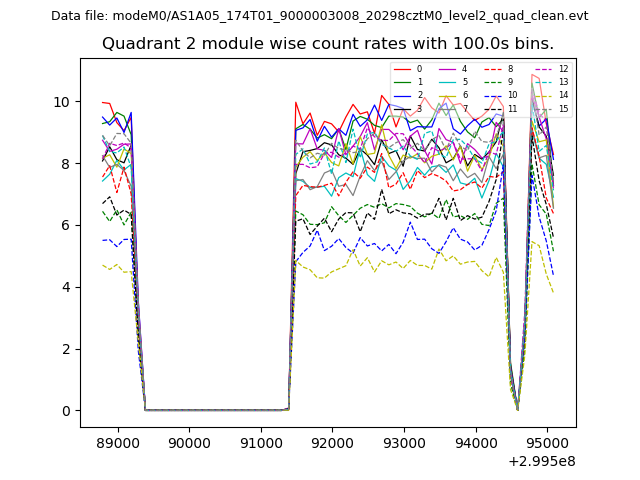
| Module-wise count rates for Quadrant B Data is divided into 100 sec bins |
 |
 |
| Module-wise count rates for Quadrant C Data is divided into 100 sec bins |
 |
 |
| Module-wise count rates for Quadrant D Data is divided into 100 sec bins |
 |
 |
| Parameter | Plot |
|---|---|
| CZT HV Monitor |  |
| D_VDD | 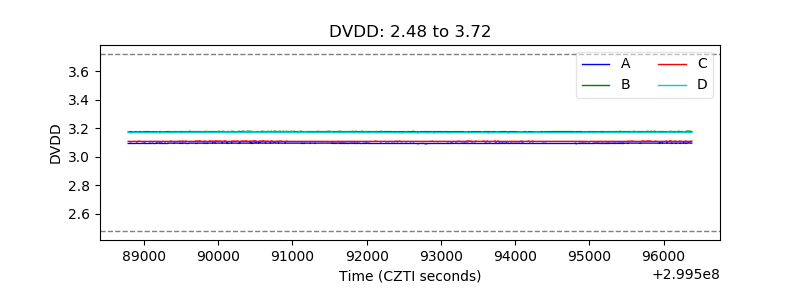 |
| Temperature 1 | 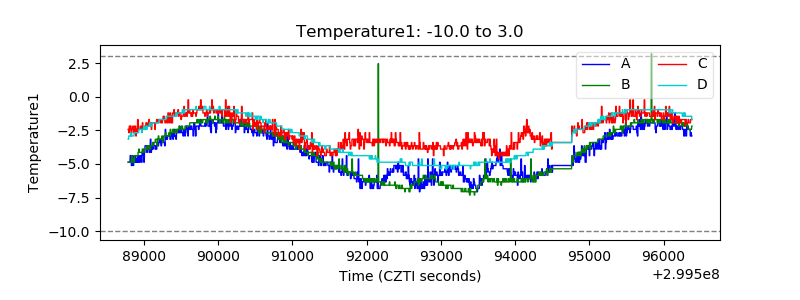 |
| Veto HV Monitor | 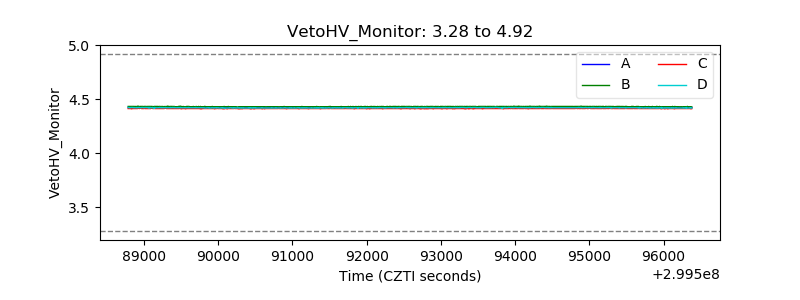 |
| Veto LLD |  |
| Alpha Counter | 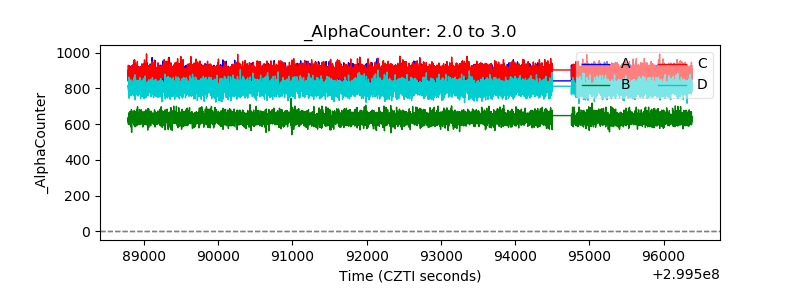 |
| _CPM_Rate | 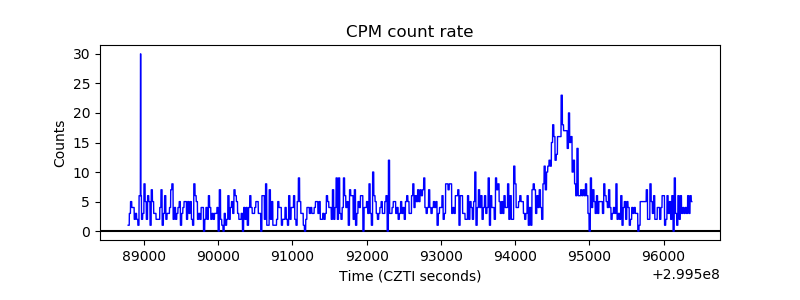 |
| CZT Counter | 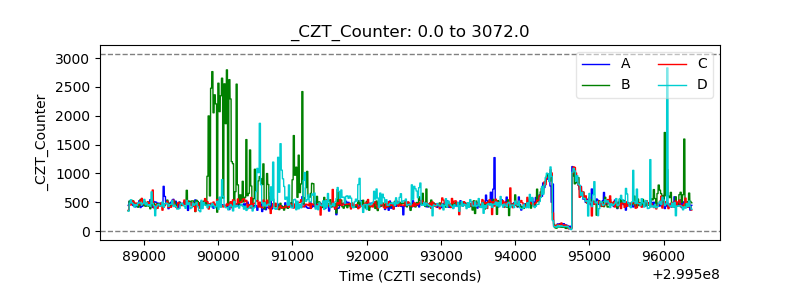 |
| +2.5 Volts monitor |  |
| +5 Volts monitor |  |
| _ROLL_ROT |  |
| _Roll_DEC | 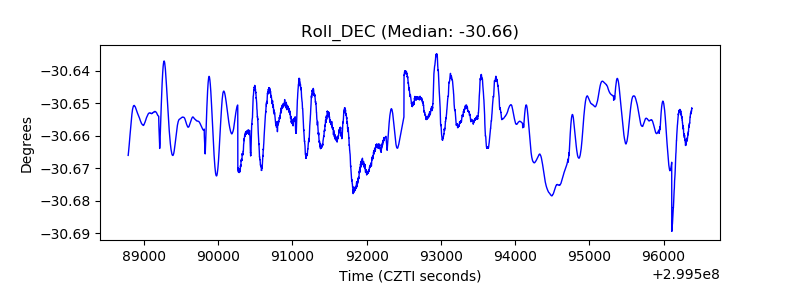 |
| _Roll_RA | 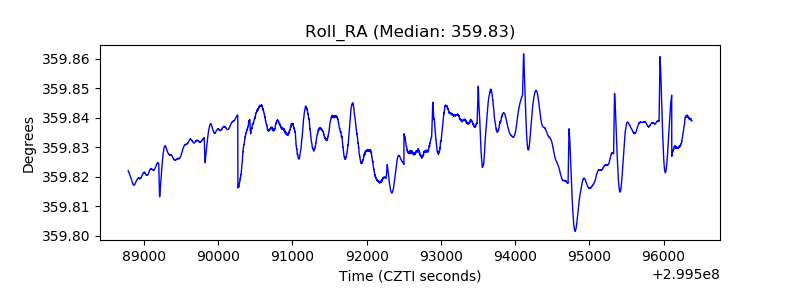 |
| Veto Counter |  |