| Param | Original file | Final file |
|---|---|---|
| Filename | modeM0/AS1A05_174T01_9000003008_20302cztM0_level2.evt | modeM0/AS1A05_174T01_9000003008_20302cztM0_level2_quad_clean.evt |
| Size (bytes) | 1,794,539,520 | 293,592,960 |
| Size | 1.7 GB | 280.0 MB |
| Events in quadrant A | 11,289,791 | 1,855,458 |
| Events in quadrant B | 13,322,150 | 1,876,673 |
| Events in quadrant C | 11,308,335 | 1,811,871 |
| Events in quadrant D | 16,848,618 | 1,738,603 |
| Mode M9 | |||
|---|---|---|---|
| Quadrant | BADHDUFLAG | Total packets | Discarded packets |
| A | 0 | 16 | 0 |
| B | 0 | 17 | 0 |
| C | 0 | 17 | 0 |
| D | 0 | 17 | 0 |
| Mode M0 | |||
|---|---|---|---|
| Quadrant | BADHDUFLAG | Total packets | Discarded packets |
| A | 0 | 48866 | 4 |
| B | 0 | 54475 | 4 |
| C | 0 | 48399 | 4 |
| D | 0 | 65772 | 5 |
| Mode SS | |||
|---|---|---|---|
| Quadrant | BADHDUFLAG | Total packets | Discarded packets |
| A | 0 | 478 | 0 |
| B | 0 | 478 | 0 |
| C | 0 | 478 | 0 |
| D | 0 | 478 | 0 |
| Quadrant | Total seconds | Saturated seconds | Saturation percentage |
|---|---|---|---|
| A | 23364 | 494 | 2.114364% |
| B | 23364 | 1173 | 5.020544% |
| C | 23364 | 532 | 2.277007% |
| D | 23363 | 1901 | 8.136798% |
Noise dominated data is calculated using 1-second bins in cleaned event files. If a bin has >2000 counts, and if more than 50% of those come from <1% of pixels, then it is considered to be noise-dominated and hence unusable.
| Quadrant | # 1 sec bins | Bins with >0 counts | Bins with >2000 counts | High rate bins dominated by noise | Noise dominated (total time) | Noise dominated (detector-on time) | Marked lightcurve |
|---|---|---|---|---|---|---|---|
| A | 37889 | 23368 | 18 | 18 | 0.05% | 0.08% | 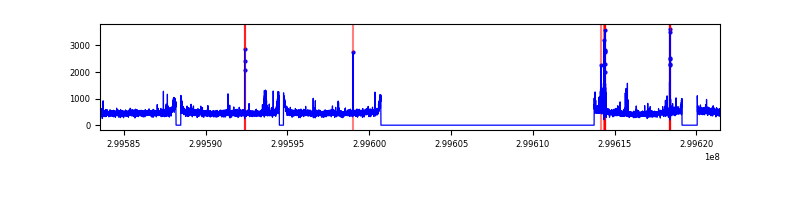 |
| B | 37889 | 23367 | 480 | 480 | 1.27% | 2.05% | 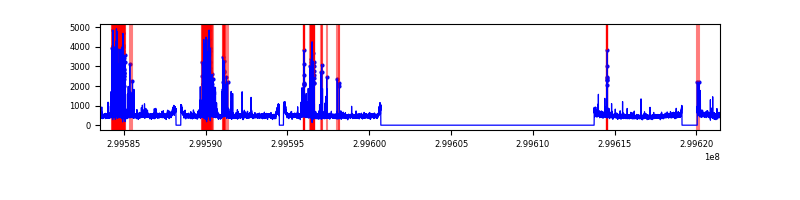 |
| C | 37889 | 23368 | 2 | 2 | 0.01% | 0.01% | 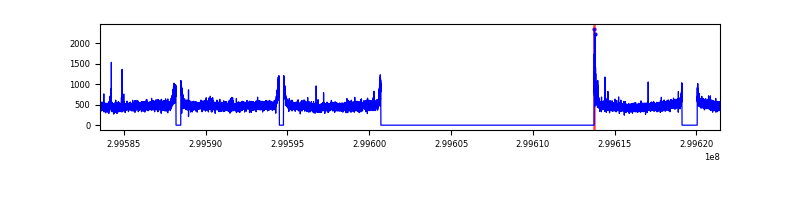 |
| D | 37888 | 23367 | 1319 | 1319 | 3.48% | 5.64% | 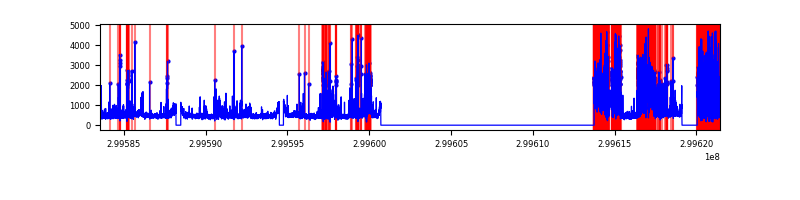 |
Top three noisy pixels from each quadrant. If the there are fewer than three noisy pixels in the level2.evt file, extra rows are filled as -1
| Pixel properties | Quadrant properties | ||||||
|---|---|---|---|---|---|---|---|
| Quadrant | DetID | PixID | Counts | Sigma | Mean | Median | Sigma |
| A | 4 | 2 | 132625 | 227.49 | 2836 | 2771 | 570.8 |
| A | 14 | 238 | 77076 | 130.17 | 2836 | 2771 | 570.8 |
| A | 8 | 205 | 60010 | 100.28 | 2836 | 2771 | 570.8 |
| B | 4 | 142 | 1406933 | 2638.97 | 2789 | 2715 | 532.1 |
| B | 7 | 220 | 429477 | 802.02 | 2789 | 2715 | 532.1 |
| B | 0 | 197 | 312490 | 582.17 | 2789 | 2715 | 532.1 |
| C | 14 | 238 | 423677 | 658.11 | 2736 | 2753 | 639.6 |
| C | 0 | 207 | 151127 | 231.98 | 2736 | 2753 | 639.6 |
| C | 3 | 233 | 42364 | 61.93 | 2736 | 2753 | 639.6 |
| D | 1 | 52 | 6086687 | 9220.92 | 2717 | 2642 | 659.8 |
| D | 2 | 184 | 170411 | 254.27 | 2717 | 2642 | 659.8 |
| D | 12 | 17 | 151442 | 225.52 | 2717 | 2642 | 659.8 |
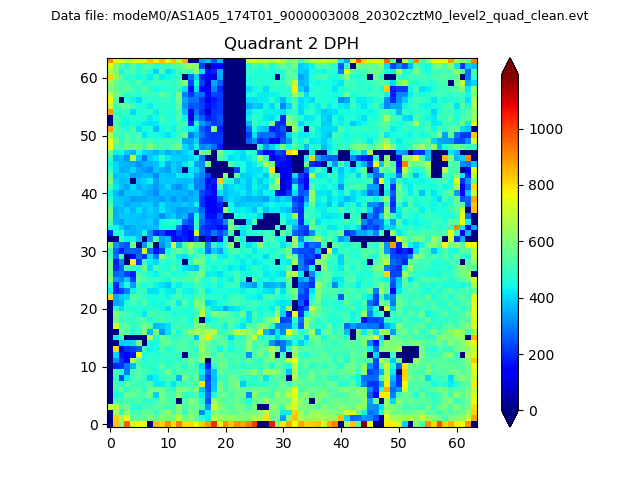
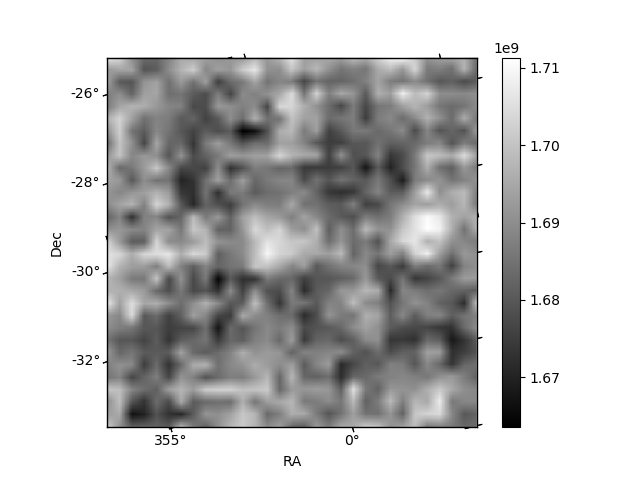
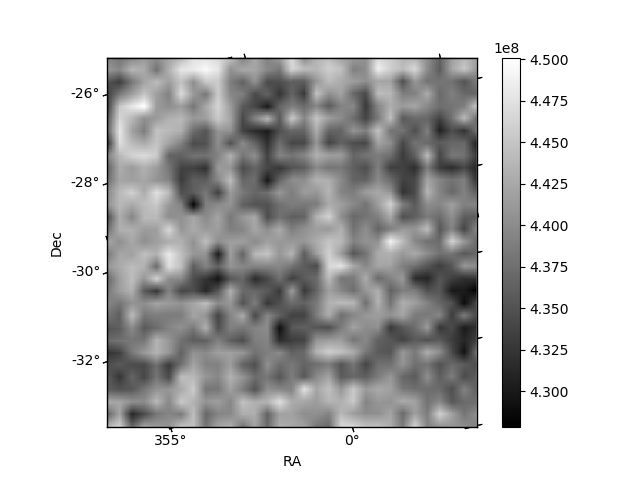
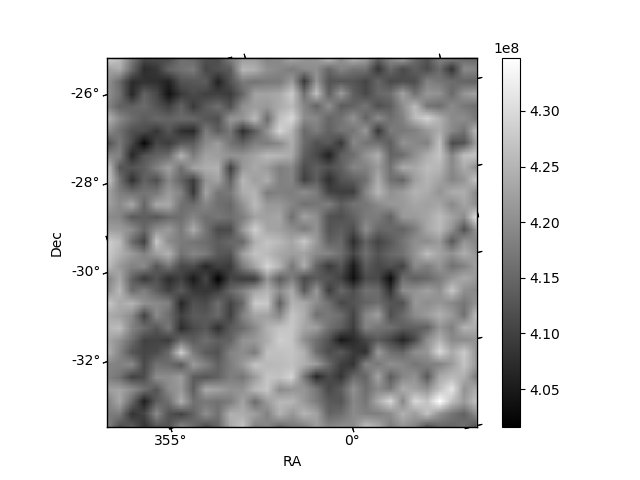
Histogram calculated using DETX and DETY for each event in the final _common_clean file
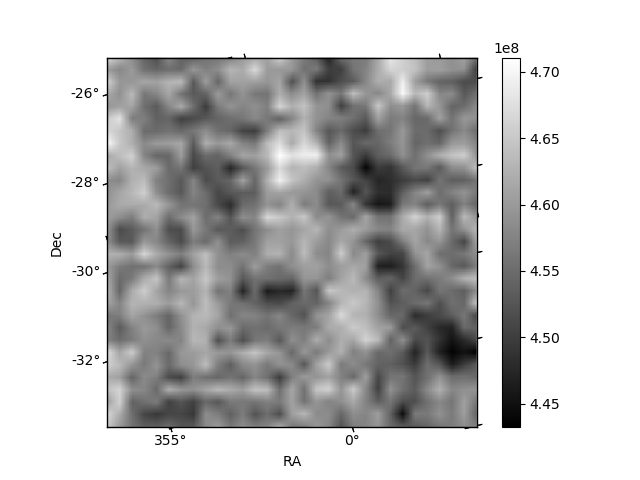
| Quadrant A | 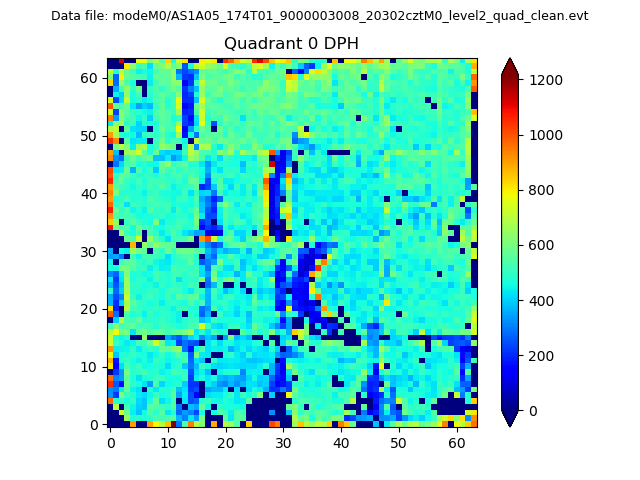 |
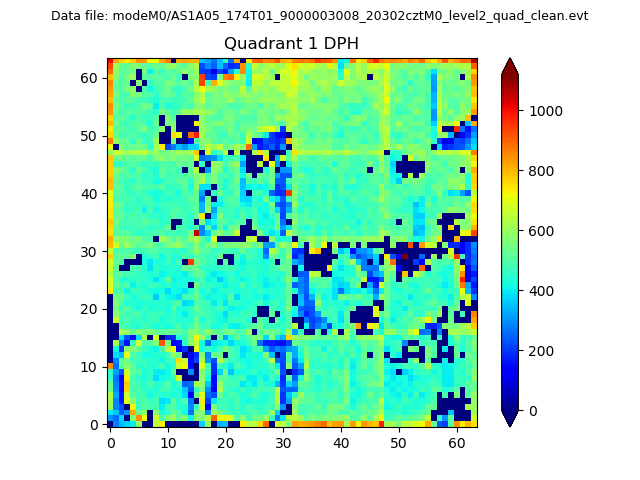 |
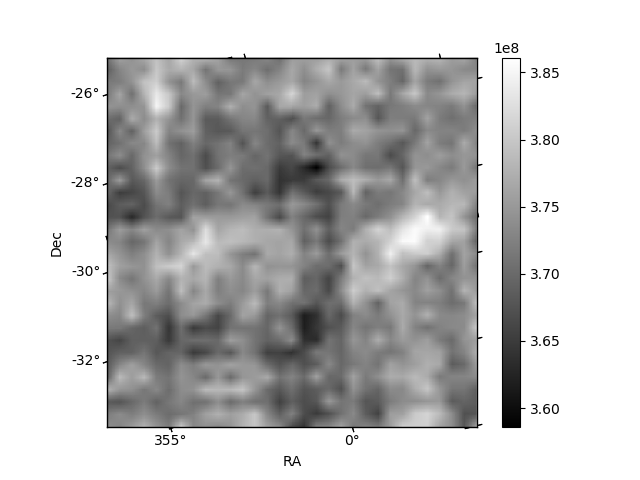
Quadrant B |
|---|---|---|---|
| Quadrant D | 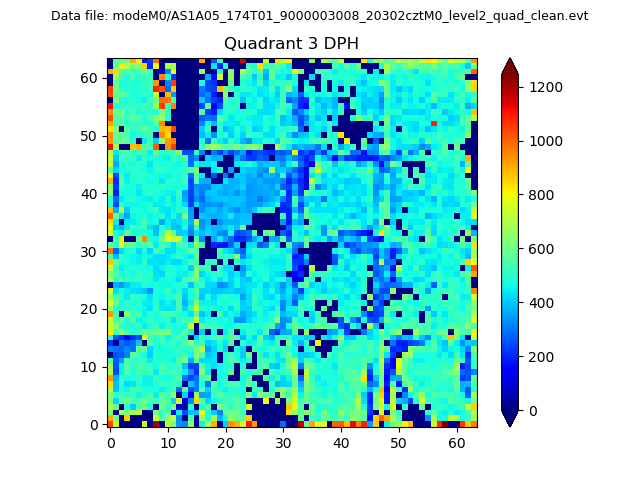 |
 |
Quadrant C |
| Plot type | Count rate plots | Images |
|---|---|---|
| Comparison with Poisson distribution Blue bars denote a histogram of data divided into 1 sec bins. Red curve is a Poisson curve with rate = median count rate of data. |
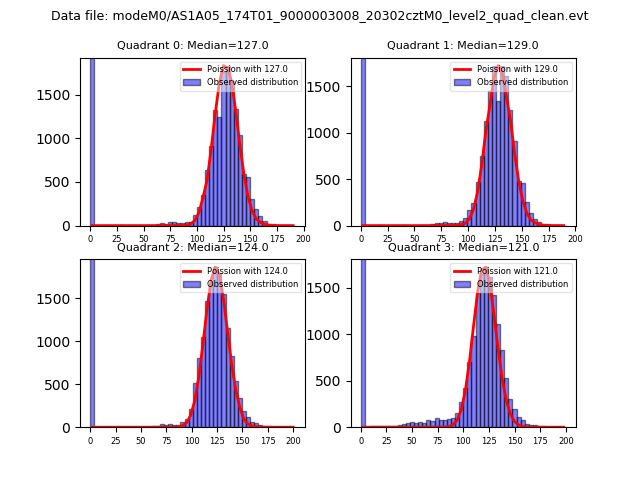 |
 |
| Quadrant-wise count rates Data is divided into 100 sec bins |
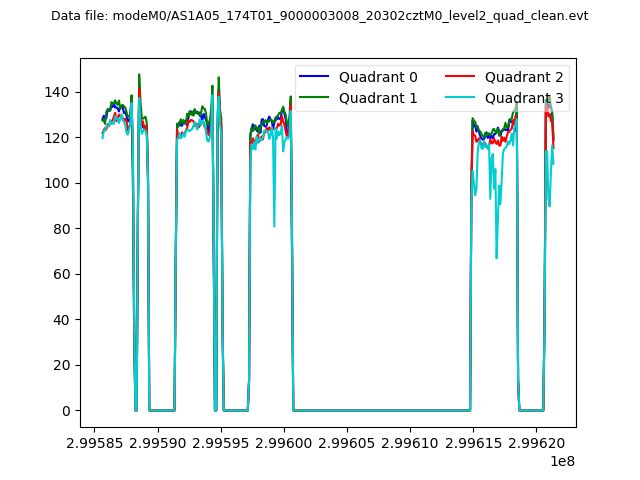 |
|
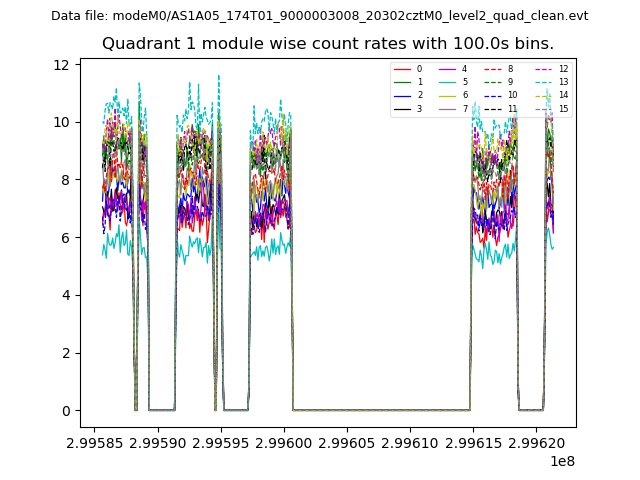
| Module-wise count rates for Quadrant A Data is divided into 100 sec bins |
 |
 |
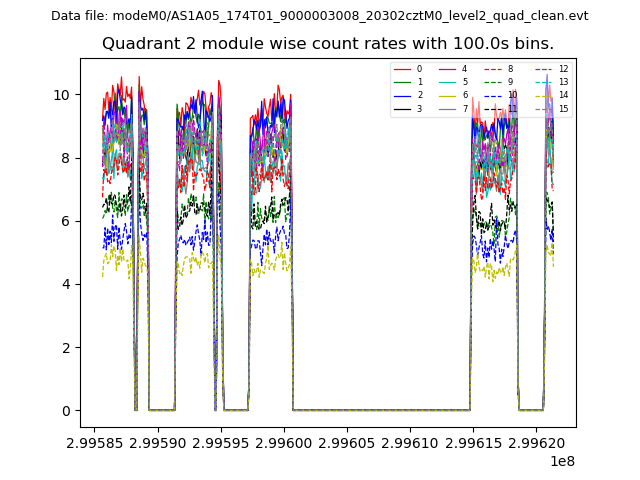
| Module-wise count rates for Quadrant B Data is divided into 100 sec bins |
 |
 |
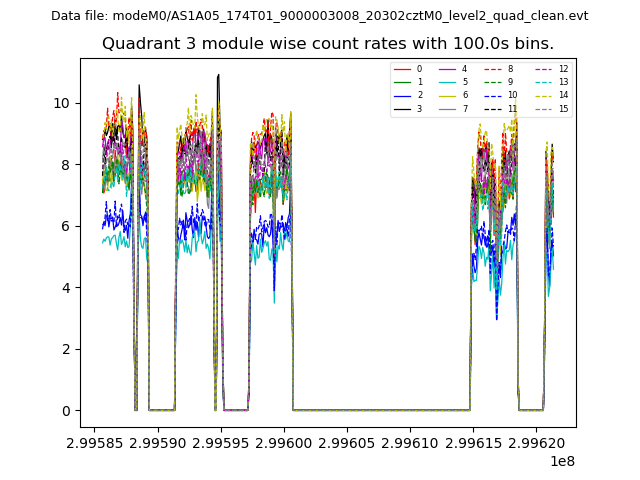
| Module-wise count rates for Quadrant C Data is divided into 100 sec bins |
 |
 |
| Module-wise count rates for Quadrant D Data is divided into 100 sec bins |
 |
 |
| Parameter | Plot |
|---|---|
| CZT HV Monitor | 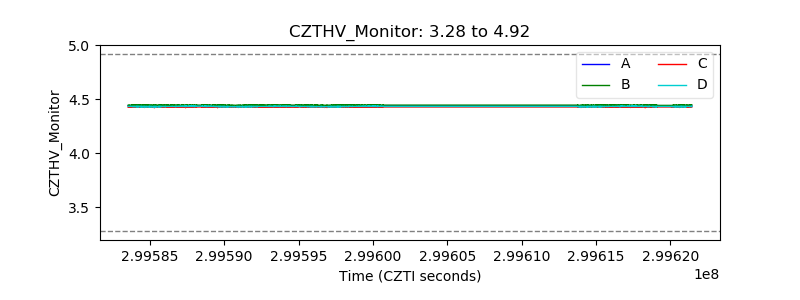 |
| D_VDD |  |
| Temperature 1 | 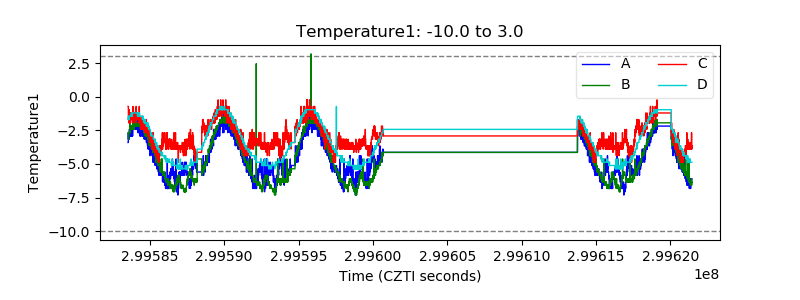 |
| Veto HV Monitor | 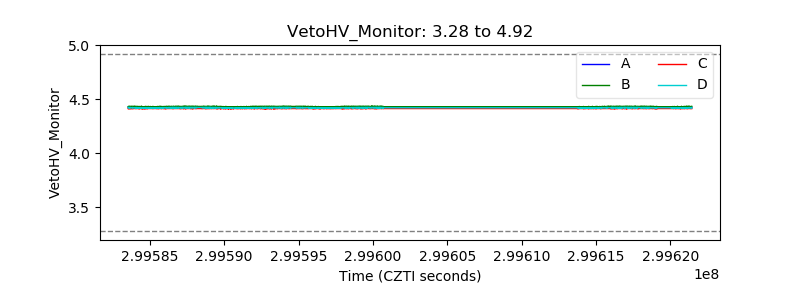 |
| Veto LLD |  |
| Alpha Counter | 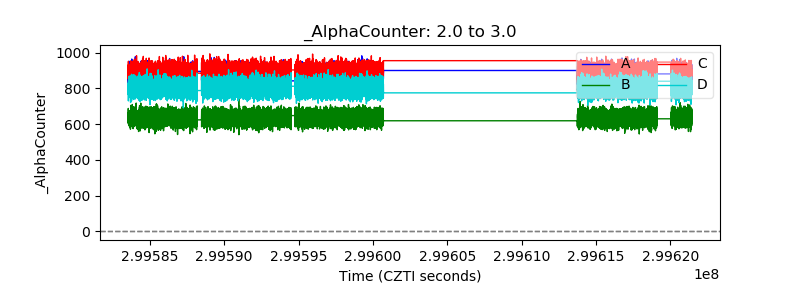 |
| _CPM_Rate | 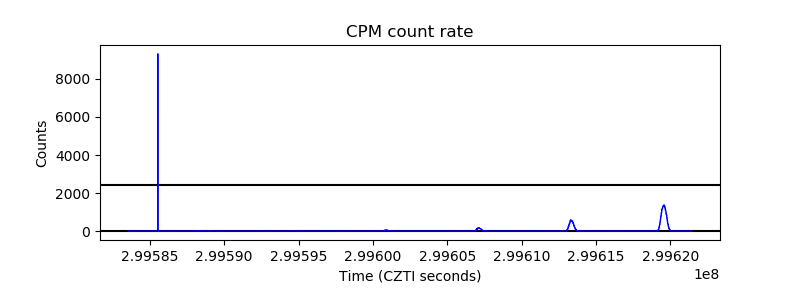 |
| CZT Counter | 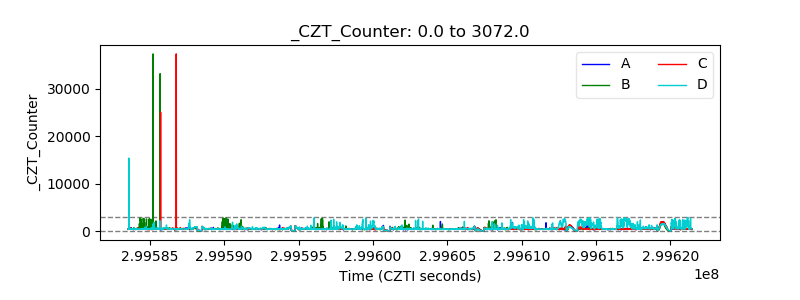 |
| +2.5 Volts monitor |  |
| +5 Volts monitor |  |
| _ROLL_ROT |  |
| _Roll_DEC | 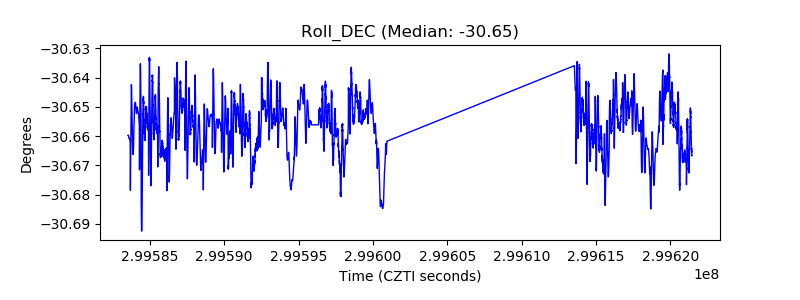 |
| _Roll_RA | 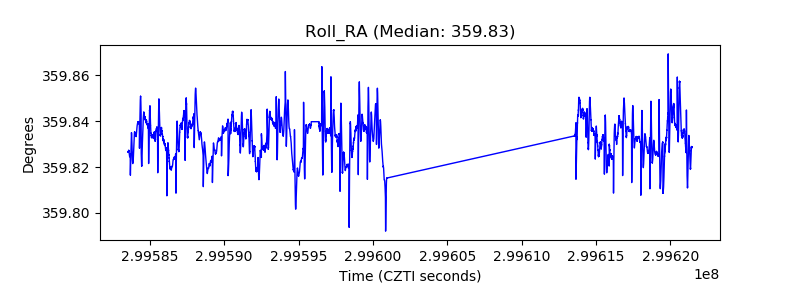 |
| Veto Counter | 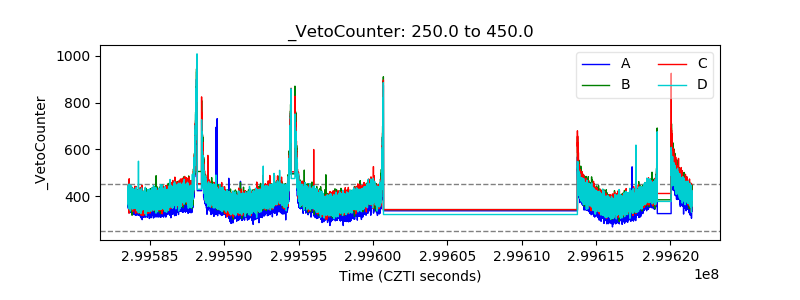 |