| Param | Original file | Final file |
|---|---|---|
| Filename | modeM0/AS1A05_174T01_9000003008_20303cztM0_level2.evt | modeM0/AS1A05_174T01_9000003008_20303cztM0_level2_quad_clean.evt |
| Size (bytes) | 544,806,720 | 93,864,960 |
| Size | 519.6 MB | 89.5 MB |
| Events in quadrant A | 3,226,180 | 616,722 |
| Events in quadrant B | 3,267,907 | 628,032 |
| Events in quadrant C | 3,162,462 | 605,822 |
| Events in quadrant D | 6,402,553 | 539,142 |
| Mode M9 | |||
|---|---|---|---|
| Quadrant | BADHDUFLAG | Total packets | Discarded packets |
| A | 0 | 17 | 0 |
| B | 0 | 18 | 0 |
| C | 0 | 18 | 0 |
| D | 0 | 18 | 0 |
| Mode M0 | |||
|---|---|---|---|
| Quadrant | BADHDUFLAG | Total packets | Discarded packets |
| A | 0 | 13520 | 2 |
| B | 0 | 13879 | 2 |
| C | 0 | 13436 | 2 |
| D | 0 | 23384 | 2 |
| Mode SS | |||
|---|---|---|---|
| Quadrant | BADHDUFLAG | Total packets | Discarded packets |
| A | 0 | 132 | 0 |
| B | 0 | 132 | 0 |
| C | 0 | 132 | 0 |
| D | 0 | 132 | 0 |
| Quadrant | Total seconds | Saturated seconds | Saturation percentage |
|---|---|---|---|
| A | 6489 | 41 | 0.631838% |
| B | 6489 | 76 | 1.171213% |
| C | 6489 | 73 | 1.124981% |
| D | 6489 | 1265 | 19.494529% |
Noise dominated data is calculated using 1-second bins in cleaned event files. If a bin has >2000 counts, and if more than 50% of those come from <1% of pixels, then it is considered to be noise-dominated and hence unusable.
| Quadrant | # 1 sec bins | Bins with >0 counts | Bins with >2000 counts | High rate bins dominated by noise | Noise dominated (total time) | Noise dominated (detector-on time) | Marked lightcurve |
|---|---|---|---|---|---|---|---|
| A | 7564 | 6490 | 0 | 0 | 0.00% | 0.00% | 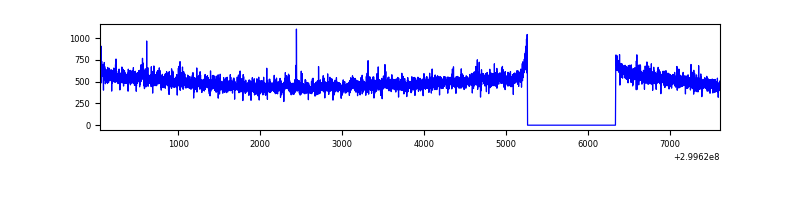 |
| B | 7564 | 6490 | 8 | 8 | 0.11% | 0.12% |  |
| C | 7564 | 6490 | 0 | 0 | 0.00% | 0.00% | 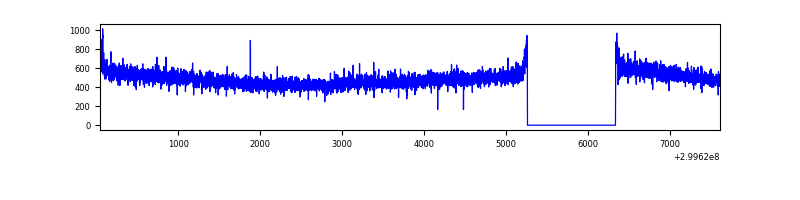 |
| D | 7564 | 6489 | 930 | 930 | 12.30% | 14.33% | 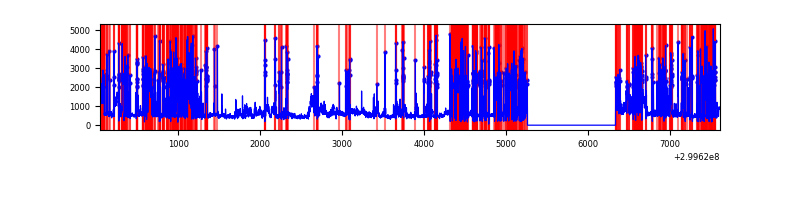 |
Top three noisy pixels from each quadrant. If the there are fewer than three noisy pixels in the level2.evt file, extra rows are filled as -1
| Pixel properties | Quadrant properties | ||||||
|---|---|---|---|---|---|---|---|
| Quadrant | DetID | PixID | Counts | Sigma | Mean | Median | Sigma |
| A | 8 | 205 | 75332 | 459.36 | 798 | 780 | 162.3 |
| A | 12 | 96 | 45317 | 274.42 | 798 | 780 | 162.3 |
| A | 11 | 29 | 20702 | 122.75 | 798 | 780 | 162.3 |
| B | 7 | 220 | 45783 | 296.5 | 799 | 779 | 151.8 |
| B | 0 | 197 | 26026 | 166.34 | 799 | 779 | 151.8 |
| B | 12 | 111 | 18362 | 115.84 | 799 | 779 | 151.8 |
| C | 14 | 238 | 122899 | 670.88 | 775 | 780 | 182.0 |
| C | 3 | 233 | 10452 | 53.13 | 775 | 780 | 182.0 |
| C | 0 | 207 | 7466 | 36.73 | 775 | 780 | 182.0 |
| D | 1 | 52 | 3779257 | 22877.18 | 681 | 664 | 165.2 |
| D | 2 | 234 | 34241 | 203.29 | 681 | 664 | 165.2 |
| D | 7 | 96 | 14919 | 86.31 | 681 | 664 | 165.2 |
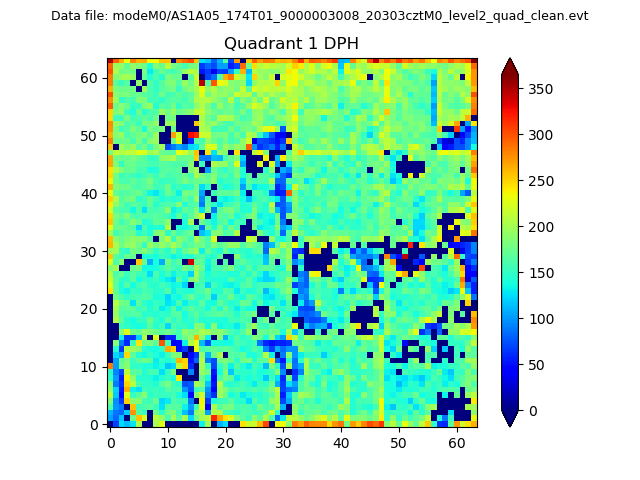
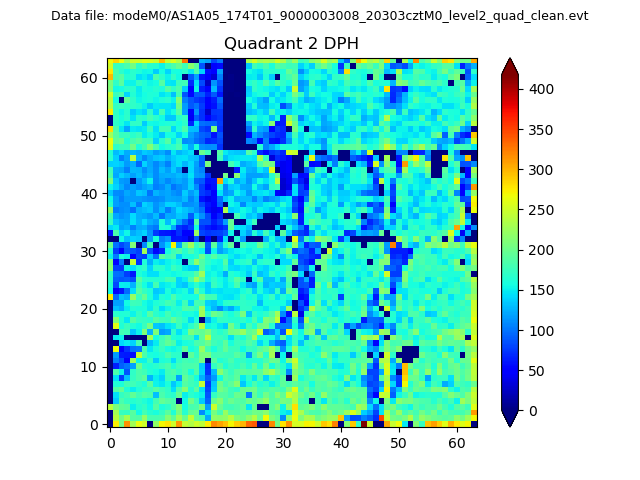
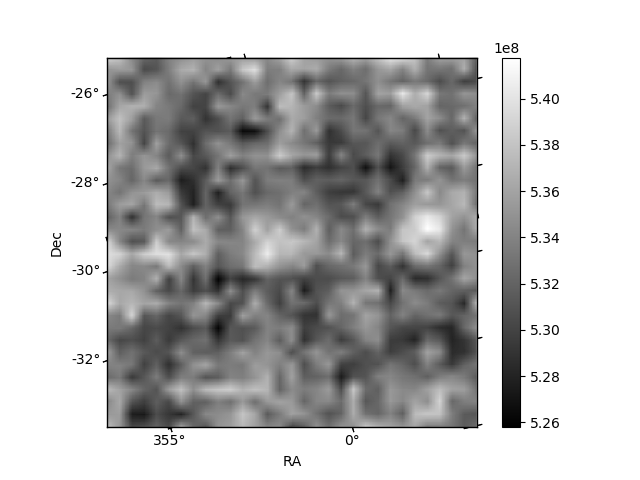
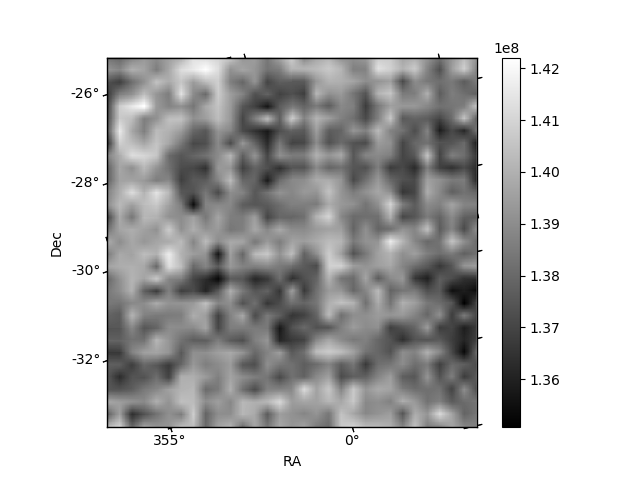
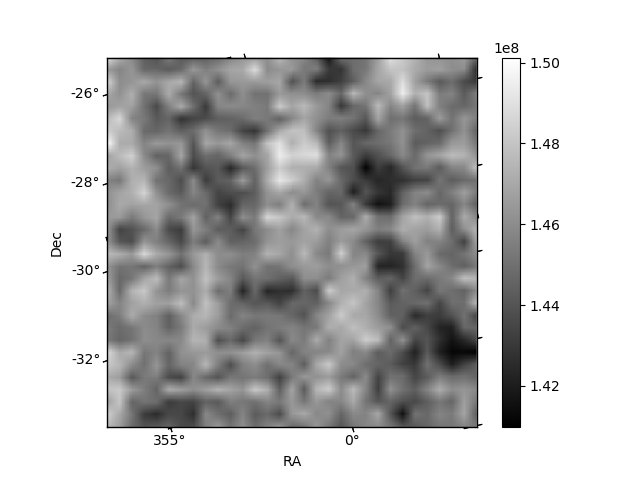
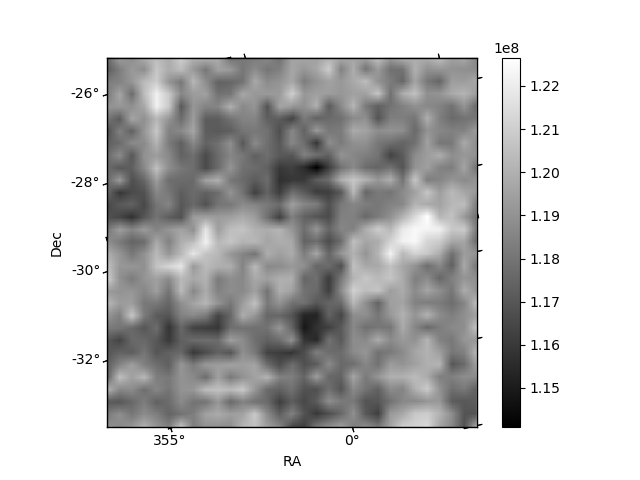
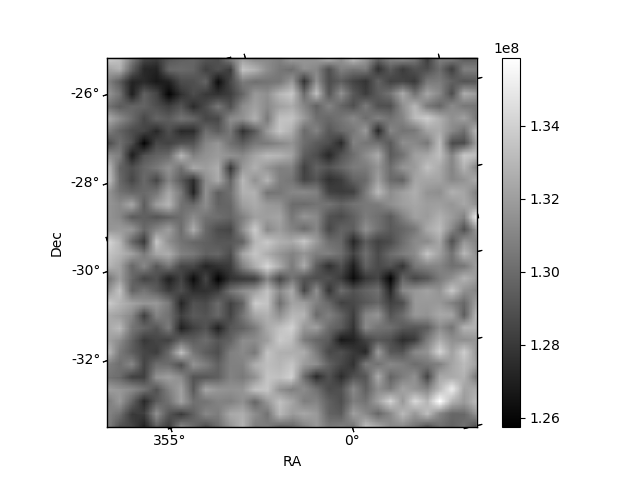
Histogram calculated using DETX and DETY for each event in the final _common_clean file
| Quadrant A | 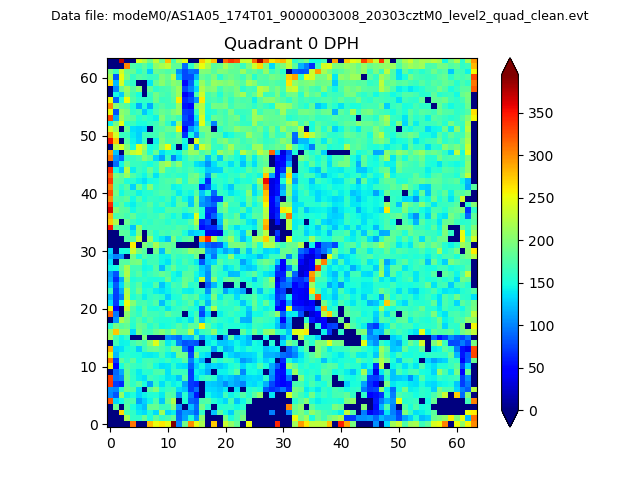 |
 |
Quadrant B |
|---|---|---|---|
| Quadrant D | 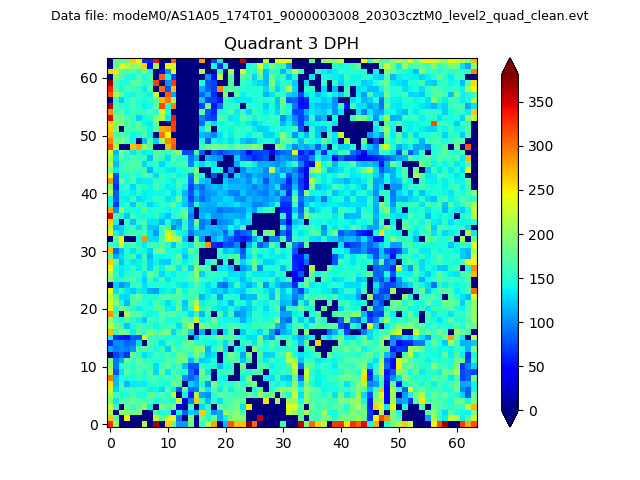 |
 |
Quadrant C |
| Plot type | Count rate plots | Images |
|---|---|---|
| Comparison with Poisson distribution Blue bars denote a histogram of data divided into 1 sec bins. Red curve is a Poisson curve with rate = median count rate of data. |
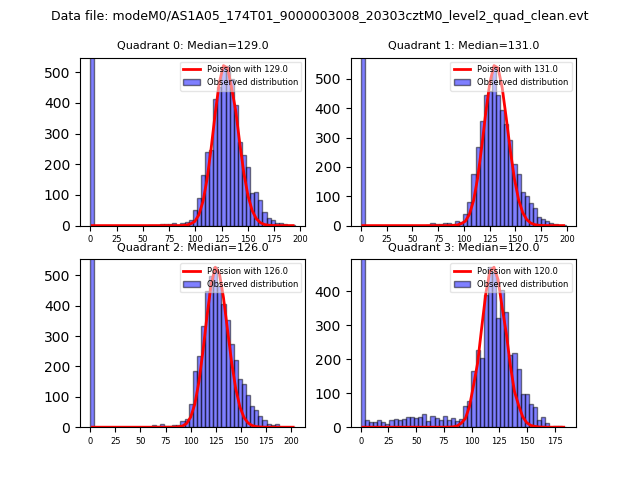 |
 |
| Quadrant-wise count rates Data is divided into 100 sec bins |
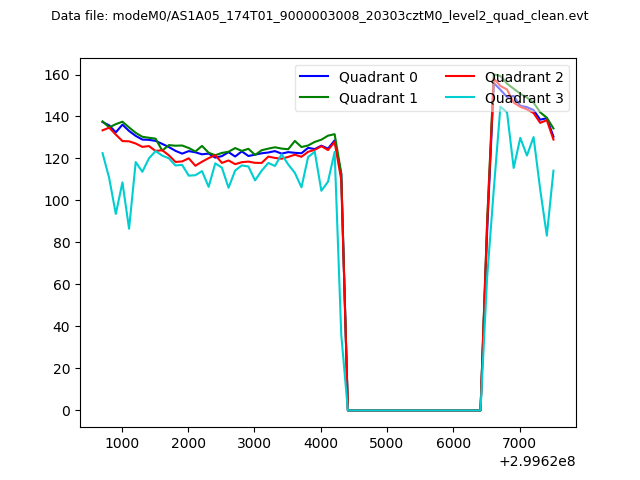 |
|
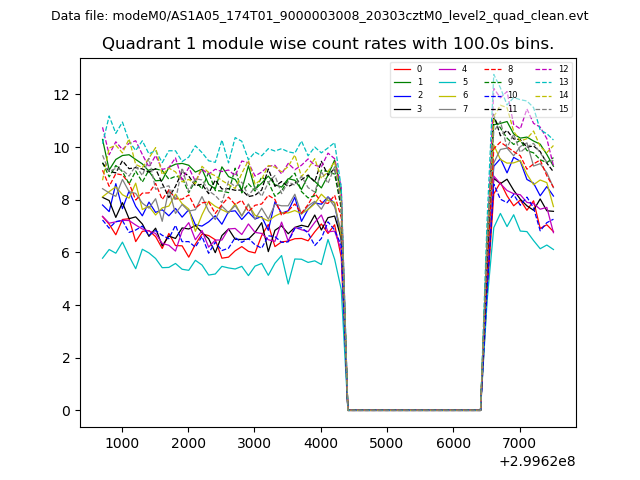
| Module-wise count rates for Quadrant A Data is divided into 100 sec bins |
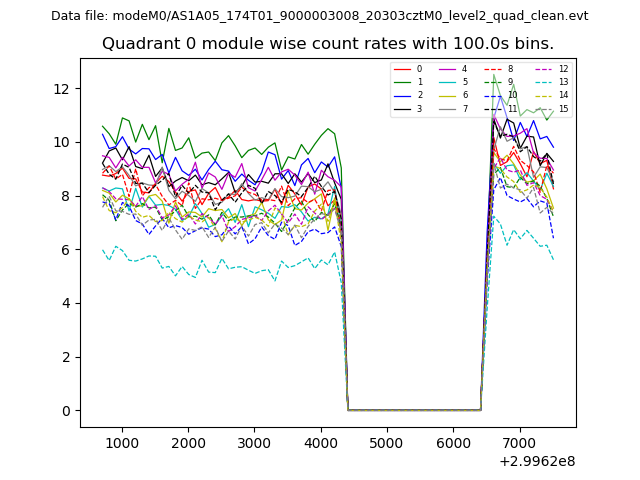 |
 |
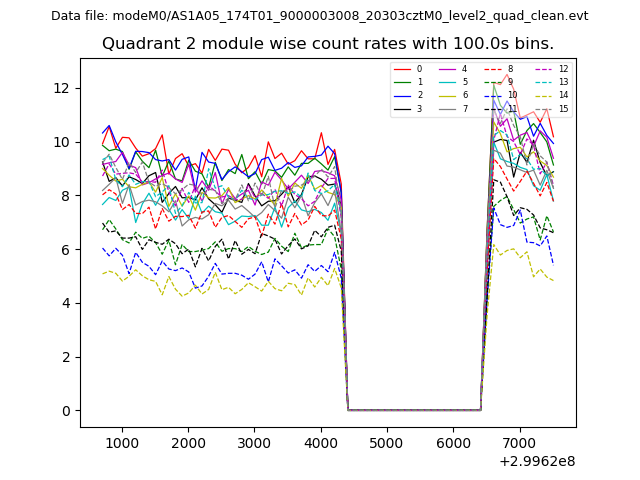
| Module-wise count rates for Quadrant B Data is divided into 100 sec bins |
 |
 |
| Module-wise count rates for Quadrant C Data is divided into 100 sec bins |
 |
 |
| Module-wise count rates for Quadrant D Data is divided into 100 sec bins |
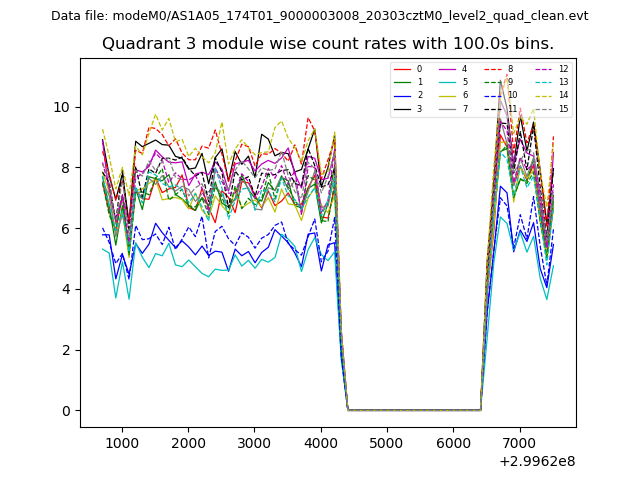 |
 |
| Parameter | Plot |
|---|---|
| CZT HV Monitor | 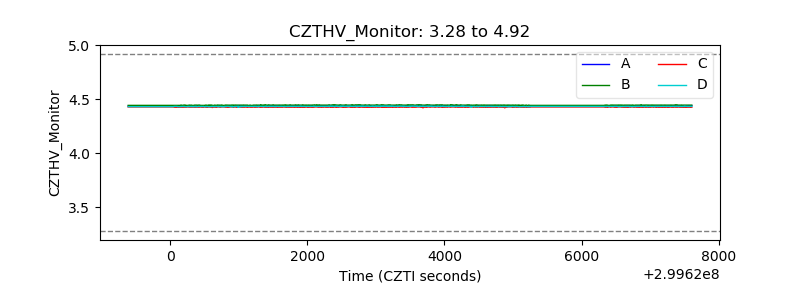 |
| D_VDD | 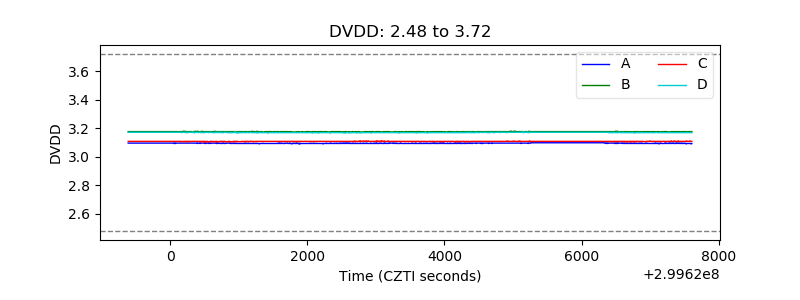 |
| Temperature 1 | 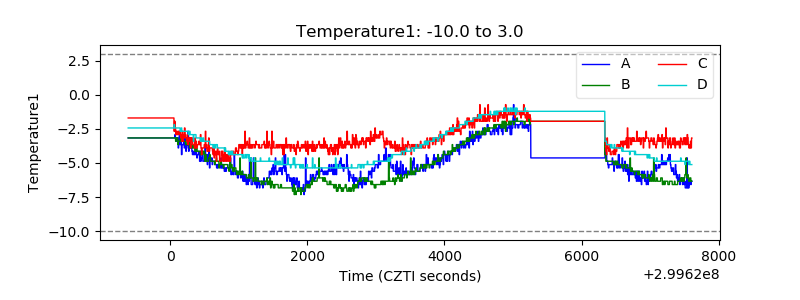 |
| Veto HV Monitor | 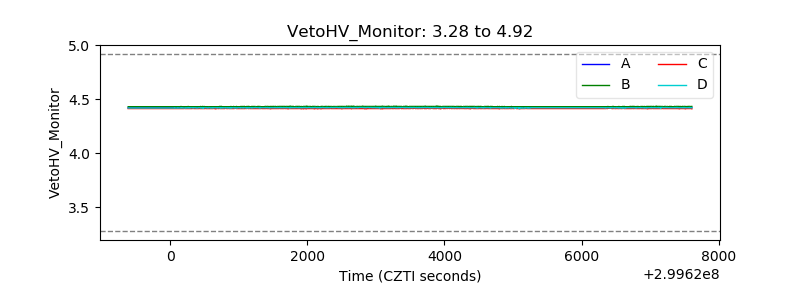 |
| Veto LLD | 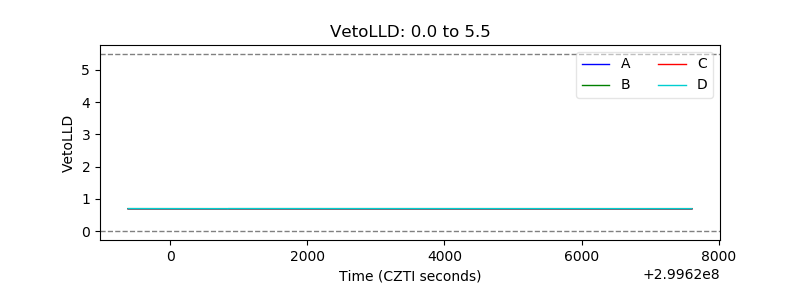 |
| Alpha Counter | 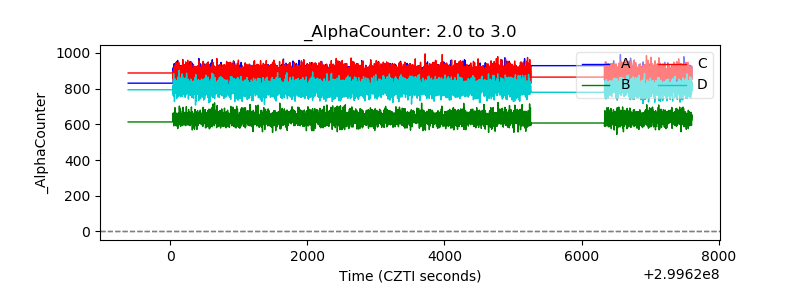 |
| _CPM_Rate | 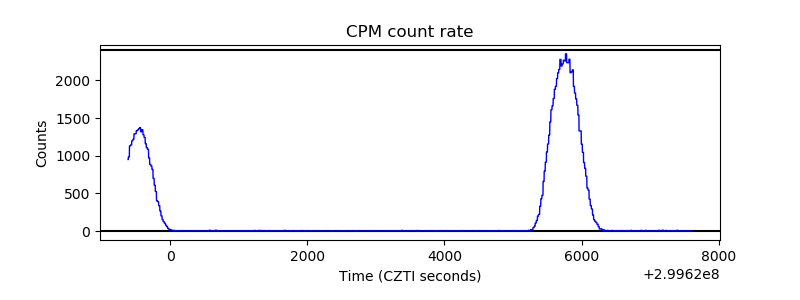 |
| CZT Counter | 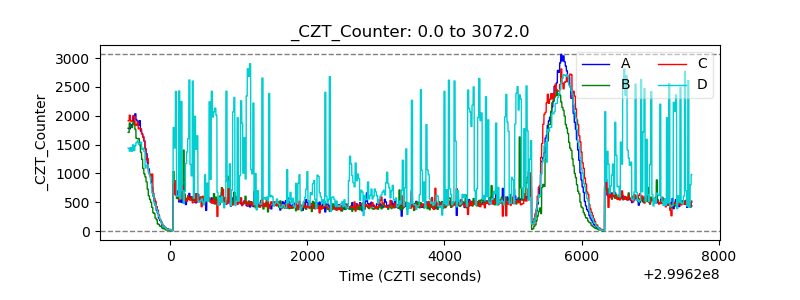 |
| +2.5 Volts monitor |  |
| +5 Volts monitor |  |
| _ROLL_ROT | 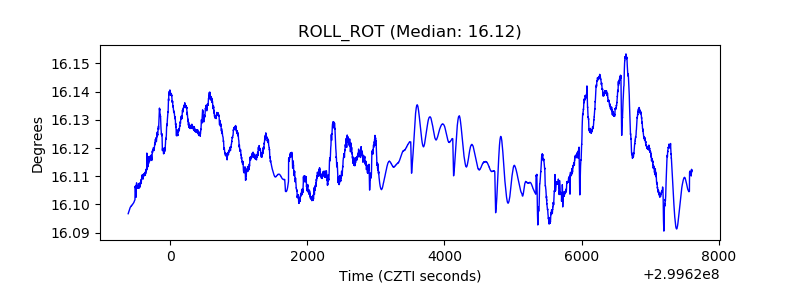 |
| _Roll_DEC | 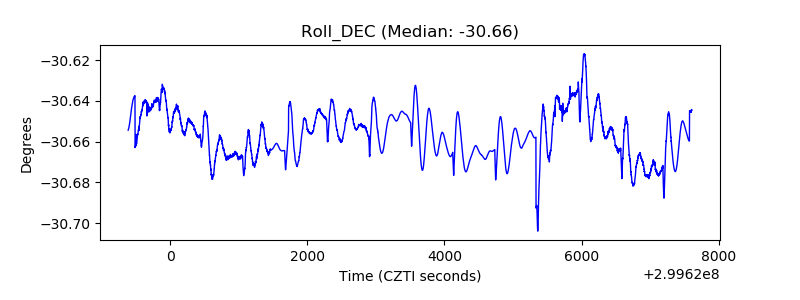 |
| _Roll_RA | 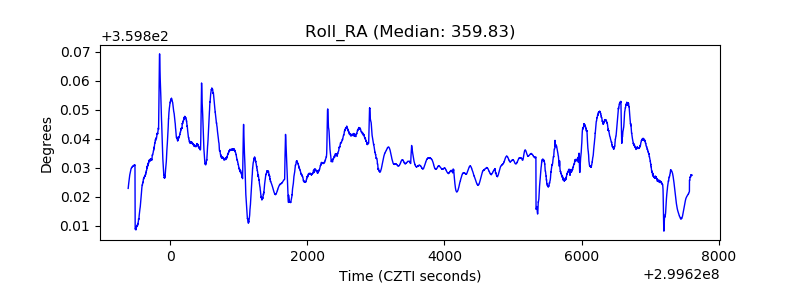 |
| Veto Counter | 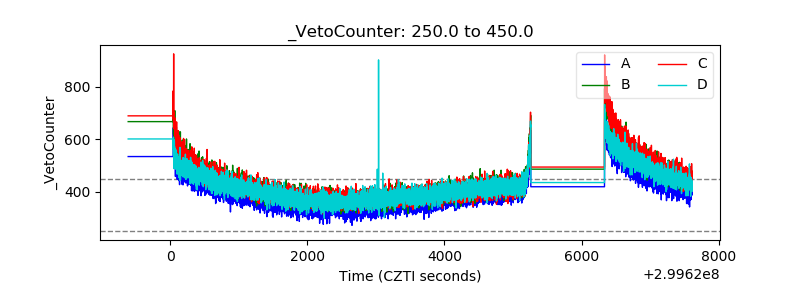 |