| Param | Original file | Final file |
|---|---|---|
| Filename | modeM0/AS1A05_174T01_9000003008_20305cztM0_level2.evt | modeM0/AS1A05_174T01_9000003008_20305cztM0_level2_quad_clean.evt |
| Size (bytes) | 199,039,680 | 33,338,880 |
| Size | 189.8 MB | 31.8 MB |
| Events in quadrant A | 1,328,209 | 207,574 |
| Events in quadrant B | 1,491,758 | 216,335 |
| Events in quadrant C | 1,341,537 | 209,670 |
| Events in quadrant D | 1,696,705 | 198,186 |
| Mode M9 | |||
|---|---|---|---|
| Quadrant | BADHDUFLAG | Total packets | Discarded packets |
| A | 0 | 11 | 0 |
| B | 0 | 11 | 0 |
| C | 0 | 11 | 0 |
| D | 0 | 11 | 0 |
| Mode M0 | |||
|---|---|---|---|
| Quadrant | BADHDUFLAG | Total packets | Discarded packets |
| A | 0 | 5363 | 1 |
| B | 0 | 5997 | 1 |
| C | 0 | 5472 | 1 |
| D | 0 | 6515 | 1 |
| Mode SS | |||
|---|---|---|---|
| Quadrant | BADHDUFLAG | Total packets | Discarded packets |
| A | 0 | 52 | 0 |
| B | 0 | 52 | 0 |
| C | 0 | 52 | 0 |
| D | 0 | 52 | 0 |
| Quadrant | Total seconds | Saturated seconds | Saturation percentage |
|---|---|---|---|
| A | 2465 | 19 | 0.770791% |
| B | 2466 | 70 | 2.838605% |
| C | 2466 | 39 | 1.581509% |
| D | 2466 | 132 | 5.352798% |
Noise dominated data is calculated using 1-second bins in cleaned event files. If a bin has >2000 counts, and if more than 50% of those come from <1% of pixels, then it is considered to be noise-dominated and hence unusable.
| Quadrant | # 1 sec bins | Bins with >0 counts | Bins with >2000 counts | High rate bins dominated by noise | Noise dominated (total time) | Noise dominated (detector-on time) | Marked lightcurve |
|---|---|---|---|---|---|---|---|
| A | 3640 | 2466 | 1 | 1 | 0.03% | 0.04% | 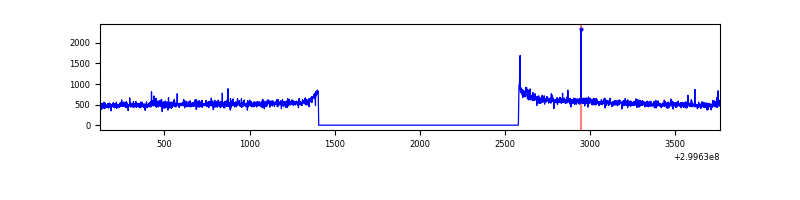 |
| B | 3641 | 2467 | 11 | 11 | 0.30% | 0.45% | 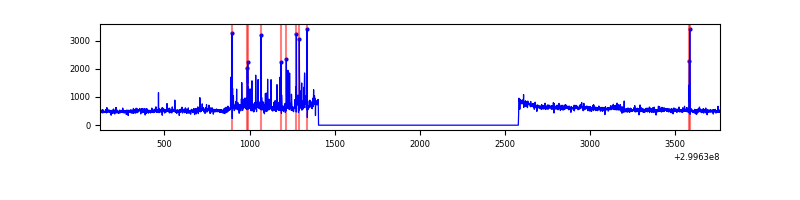 |
| C | 3641 | 2467 | 0 | 0 | 0.00% | 0.00% | 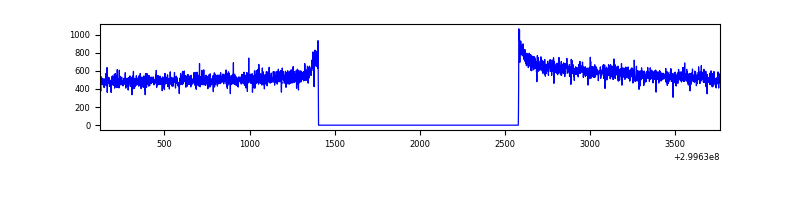 |
| D | 3641 | 2467 | 82 | 82 | 2.25% | 3.32% | 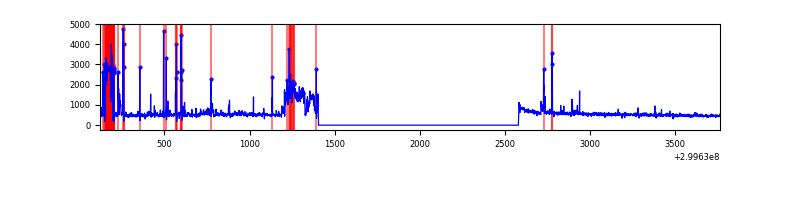 |
Top three noisy pixels from each quadrant. If the there are fewer than three noisy pixels in the level2.evt file, extra rows are filled as -1
| Pixel properties | Quadrant properties | ||||||
|---|---|---|---|---|---|---|---|
| Quadrant | DetID | PixID | Counts | Sigma | Mean | Median | Sigma |
| A | 12 | 96 | 15308 | 216.44 | 337 | 331 | 69.2 |
| A | 11 | 29 | 6019 | 82.2 | 337 | 331 | 69.2 |
| A | 8 | 205 | 4472 | 59.84 | 337 | 331 | 69.2 |
| B | 7 | 220 | 120226 | 1843.81 | 337 | 330 | 65.0 |
| B | 2 | 9 | 14013 | 210.42 | 337 | 330 | 65.0 |
| B | 3 | 64 | 8936 | 132.35 | 337 | 330 | 65.0 |
| C | 14 | 238 | 52039 | 658.09 | 329 | 331 | 78.6 |
| C | 3 | 233 | 2915 | 32.88 | 329 | 331 | 78.6 |
| C | 13 | 61 | 2296 | 25.0 | 329 | 331 | 78.6 |
| D | 1 | 52 | 436257 | 5341.1 | 327 | 318 | 81.6 |
| D | 2 | 184 | 12146 | 144.92 | 327 | 318 | 81.6 |
| D | 2 | 234 | 11558 | 137.71 | 327 | 318 | 81.6 |
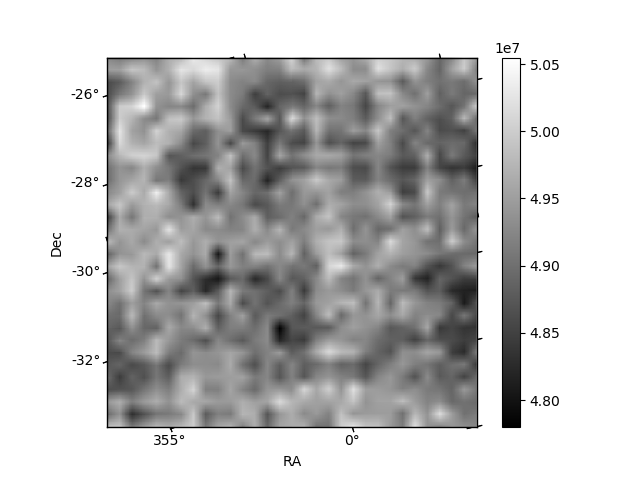
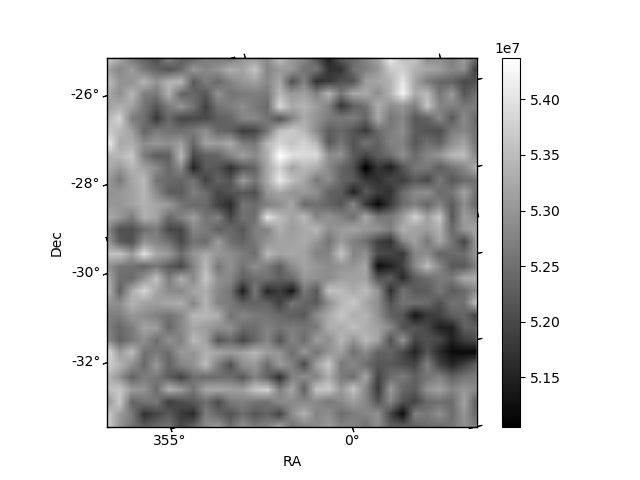
Histogram calculated using DETX and DETY for each event in the final _common_clean file
| Quadrant A |  |
 |
Quadrant B |
|---|---|---|---|
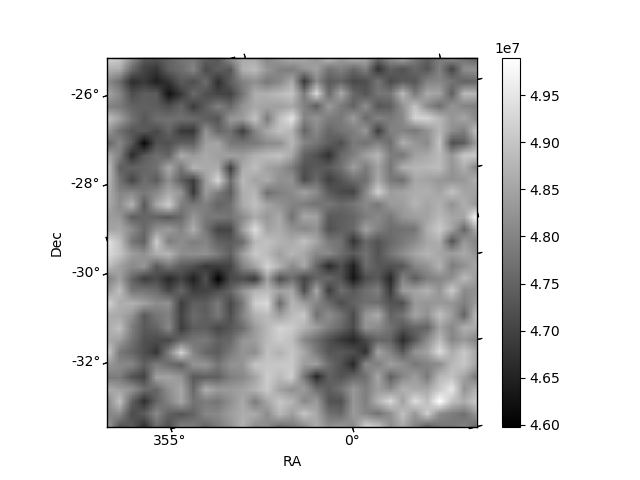
| Quadrant D | 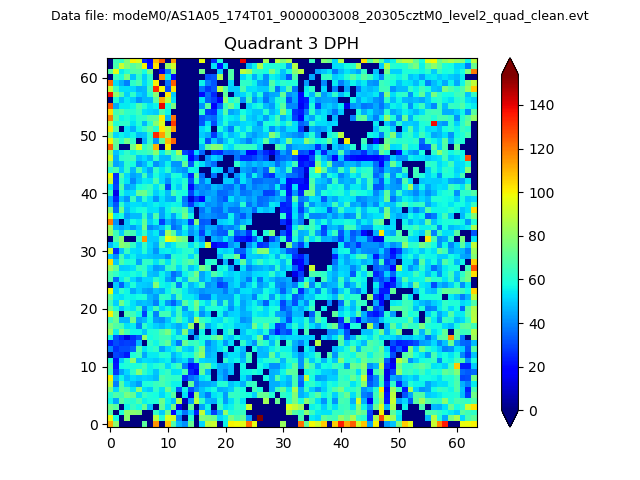 |
 |
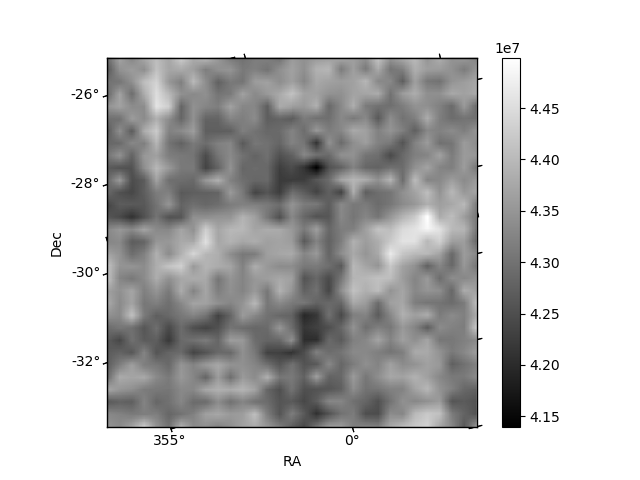
Quadrant C |
| Plot type | Count rate plots | Images |
|---|---|---|
| Comparison with Poisson distribution Blue bars denote a histogram of data divided into 1 sec bins. Red curve is a Poisson curve with rate = median count rate of data. |
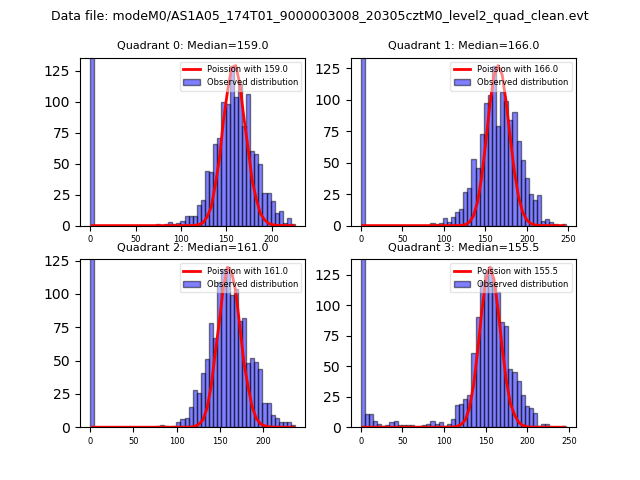 |
 |
| Quadrant-wise count rates Data is divided into 100 sec bins |
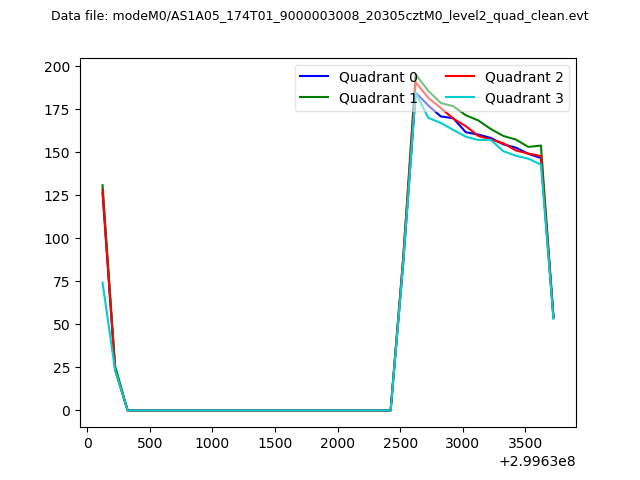 |
|
| Module-wise count rates for Quadrant A Data is divided into 100 sec bins |
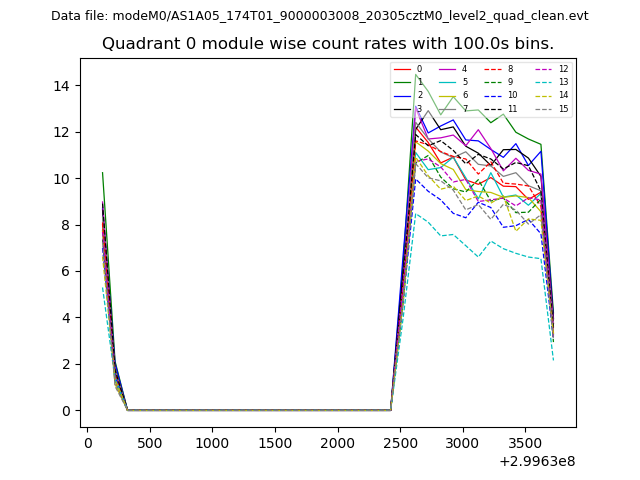 |
 |
| Module-wise count rates for Quadrant B Data is divided into 100 sec bins |
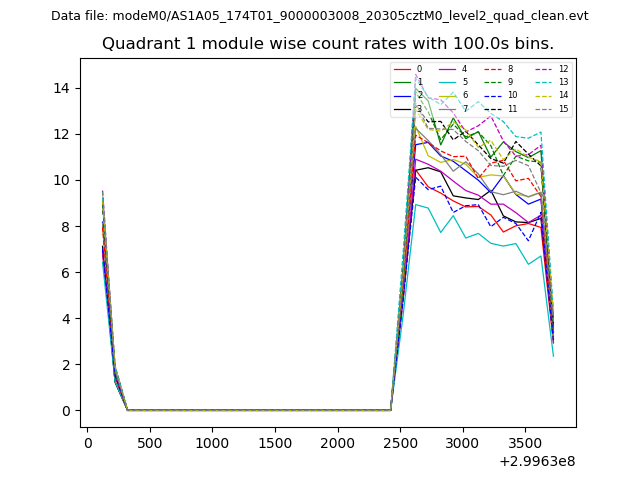 |
 |
| Module-wise count rates for Quadrant C Data is divided into 100 sec bins |
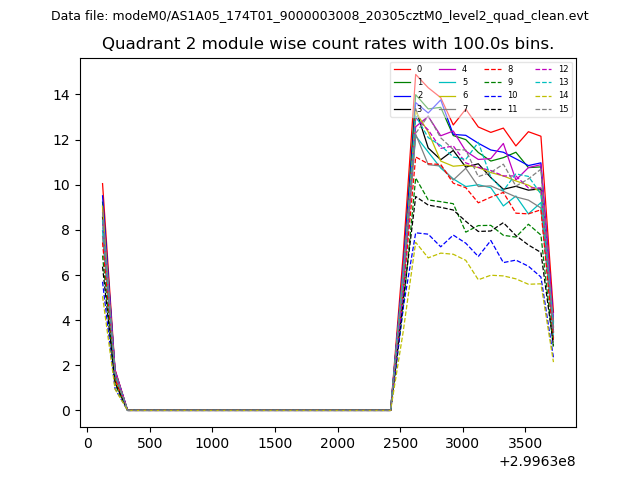 |
 |
| Module-wise count rates for Quadrant D Data is divided into 100 sec bins |
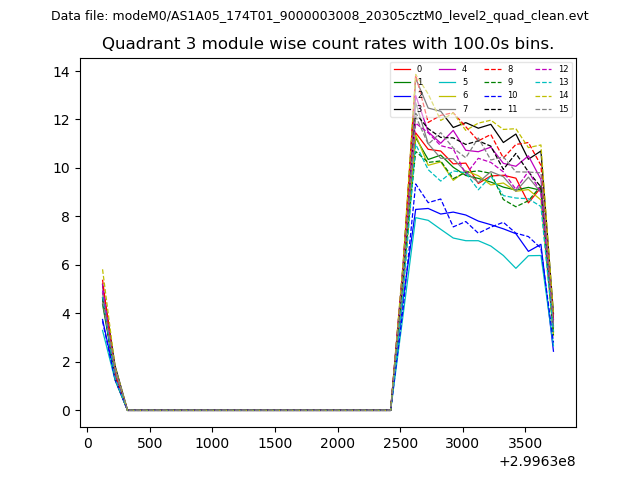 |
 |
| Parameter | Plot |
|---|---|
| CZT HV Monitor | 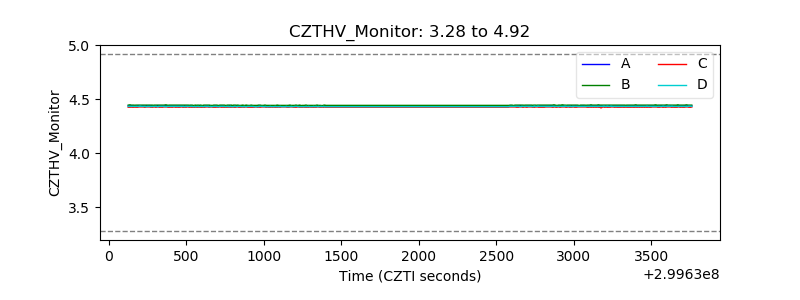 |
| D_VDD | 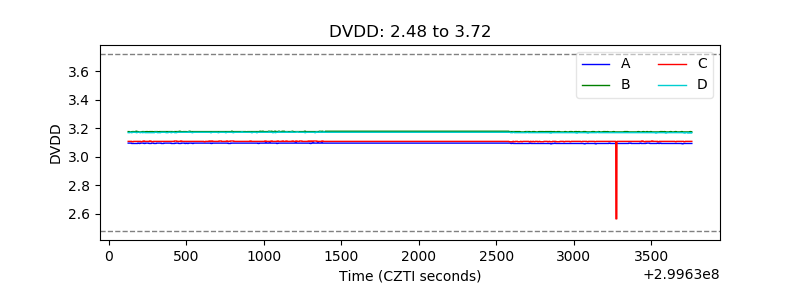 |
| Temperature 1 |  |
| Veto HV Monitor | 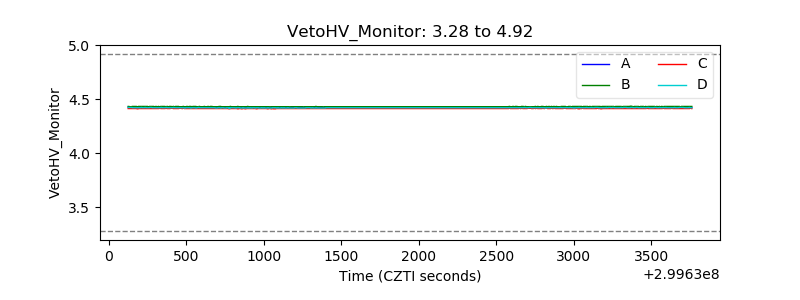 |
| Veto LLD |  |
| Alpha Counter | 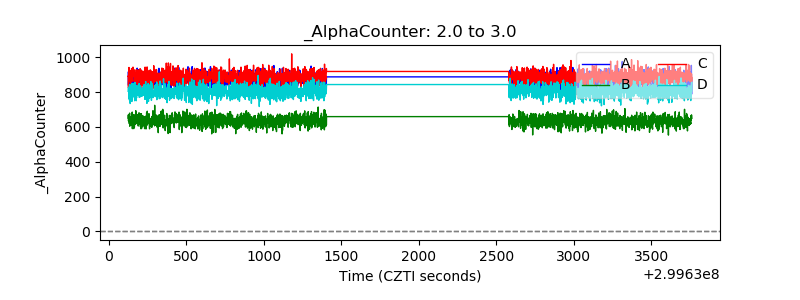 |
| _CPM_Rate | 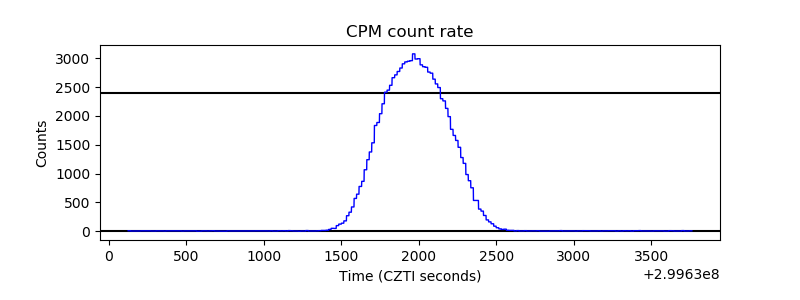 |
| CZT Counter | 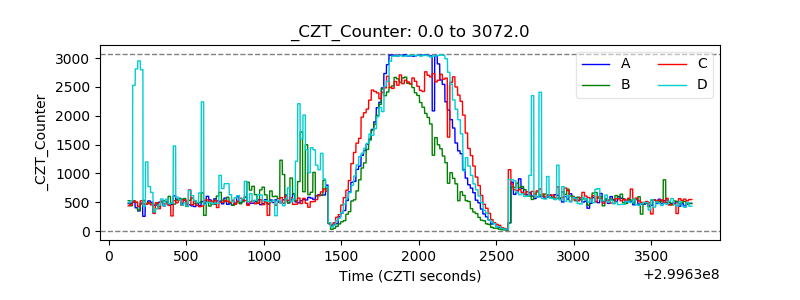 |
| +2.5 Volts monitor |  |
| +5 Volts monitor | 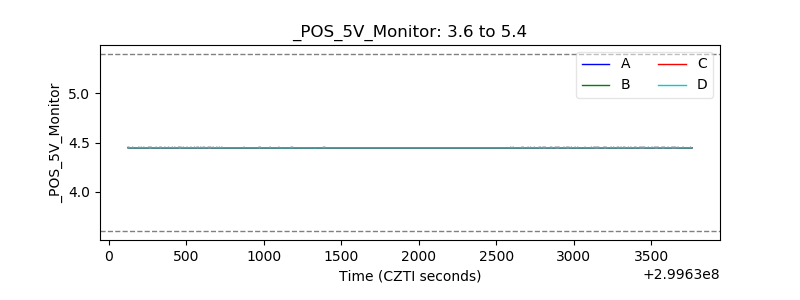 |
| _ROLL_ROT | 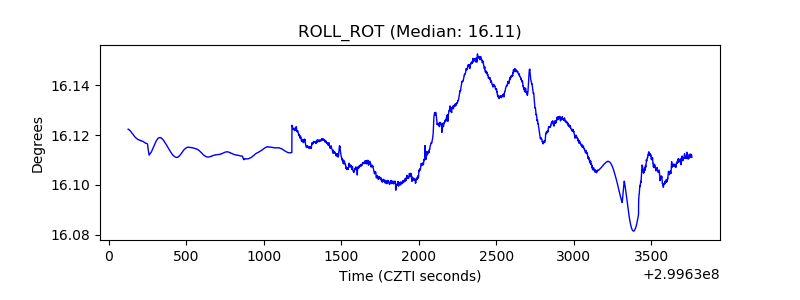 |
| _Roll_DEC | 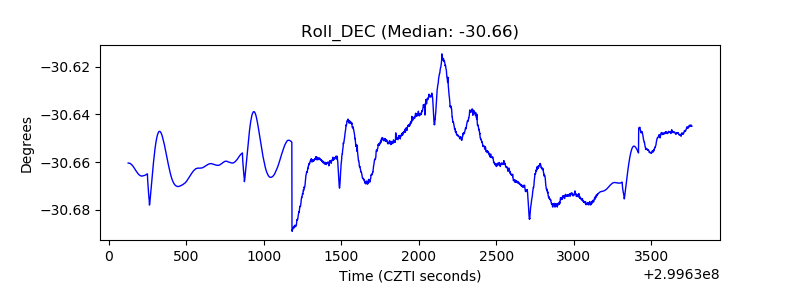 |
| _Roll_RA | 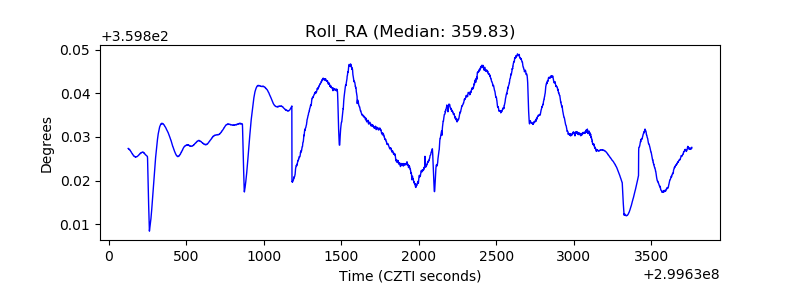 |
| Veto Counter | 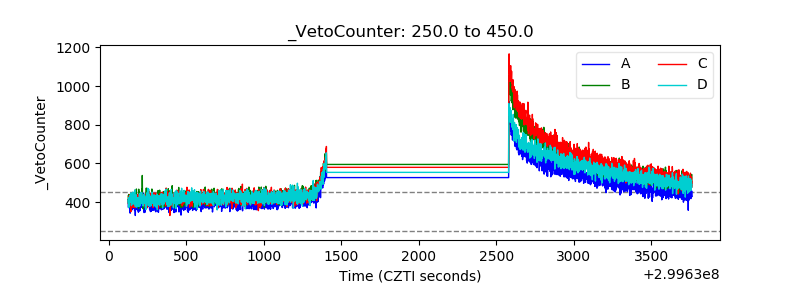 |