| Param | Original file | Final file |
|---|---|---|
| Filename | modeM0/AS1A05_174T01_9000003008_20306cztM0_level2.evt | modeM0/AS1A05_174T01_9000003008_20306cztM0_level2_quad_clean.evt |
| Size (bytes) | 501,281,280 | 109,134,720 |
| Size | 478.1 MB | 104.1 MB |
| Events in quadrant A | 3,207,795 | 719,161 |
| Events in quadrant B | 3,423,447 | 746,233 |
| Events in quadrant C | 3,286,732 | 723,894 |
| Events in quadrant D | 4,837,853 | 678,429 |
| Mode M9 | |||
|---|---|---|---|
| Quadrant | BADHDUFLAG | Total packets | Discarded packets |
| A | 0 | 22 | 0 |
| B | 0 | 23 | 0 |
| C | 0 | 23 | 0 |
| D | 0 | 23 | 0 |
| Mode M0 | |||
|---|---|---|---|
| Quadrant | BADHDUFLAG | Total packets | Discarded packets |
| A | 0 | 13416 | 2 |
| B | 0 | 14203 | 2 |
| C | 0 | 13619 | 2 |
| D | 0 | 18481 | 2 |
| Mode SS | |||
|---|---|---|---|
| Quadrant | BADHDUFLAG | Total packets | Discarded packets |
| A | 0 | 128 | 0 |
| B | 0 | 128 | 0 |
| C | 0 | 128 | 0 |
| D | 0 | 128 | 0 |
| Quadrant | Total seconds | Saturated seconds | Saturation percentage |
|---|---|---|---|
| A | 6267 | 16 | 0.255306% |
| B | 6267 | 63 | 1.005266% |
| C | 6267 | 50 | 0.797830% |
| D | 6267 | 667 | 10.643051% |
Noise dominated data is calculated using 1-second bins in cleaned event files. If a bin has >2000 counts, and if more than 50% of those come from <1% of pixels, then it is considered to be noise-dominated and hence unusable.
| Quadrant | # 1 sec bins | Bins with >0 counts | Bins with >2000 counts | High rate bins dominated by noise | Noise dominated (total time) | Noise dominated (detector-on time) | Marked lightcurve |
|---|---|---|---|---|---|---|---|
| A | 7557 | 6268 | 2 | 2 | 0.03% | 0.03% | 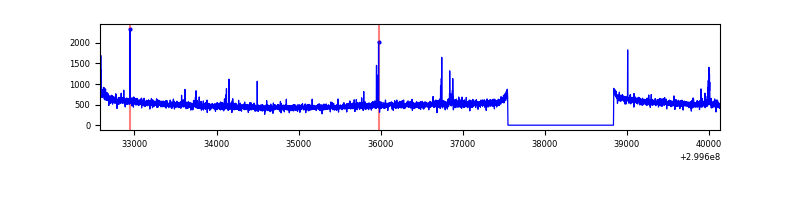 |
| B | 7557 | 6268 | 16 | 16 | 0.21% | 0.26% | 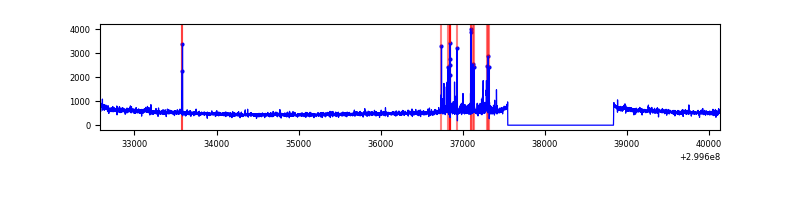 |
| C | 7557 | 6268 | 0 | 0 | 0.00% | 0.00% | 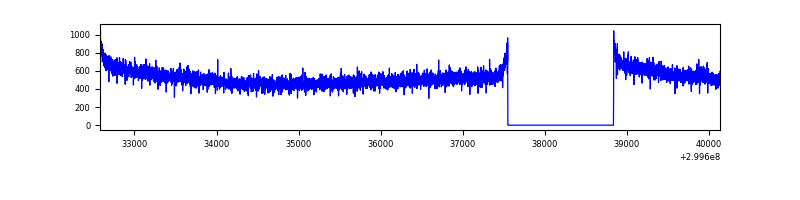 |
| D | 7557 | 6268 | 557 | 557 | 7.37% | 8.89% | 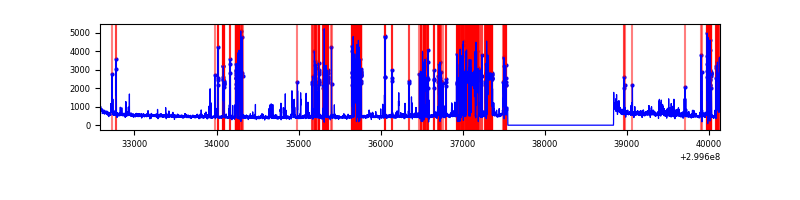 |
Top three noisy pixels from each quadrant. If the there are fewer than three noisy pixels in the level2.evt file, extra rows are filled as -1
| Pixel properties | Quadrant properties | ||||||
|---|---|---|---|---|---|---|---|
| Quadrant | DetID | PixID | Counts | Sigma | Mean | Median | Sigma |
| A | 12 | 96 | 45644 | 275.75 | 813 | 797 | 162.6 |
| A | 11 | 29 | 12847 | 74.09 | 813 | 797 | 162.6 |
| A | 13 | 254 | 9192 | 51.62 | 813 | 797 | 162.6 |
| B | 7 | 220 | 152075 | 994.65 | 818 | 798 | 152.1 |
| B | 0 | 214 | 18672 | 117.52 | 818 | 798 | 152.1 |
| B | 12 | 111 | 17847 | 112.1 | 818 | 798 | 152.1 |
| C | 14 | 238 | 127374 | 673.47 | 807 | 815 | 187.9 |
| C | 3 | 233 | 12844 | 64.01 | 807 | 815 | 187.9 |
| C | 13 | 61 | 5621 | 25.57 | 807 | 815 | 187.9 |
| D | 1 | 52 | 1927242 | 10471.09 | 761 | 742 | 184.0 |
| D | 2 | 234 | 23424 | 123.28 | 761 | 742 | 184.0 |
| D | 2 | 120 | 17824 | 92.85 | 761 | 742 | 184.0 |
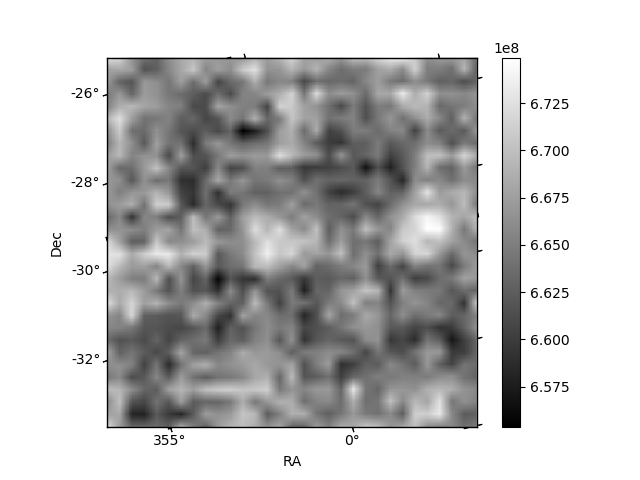
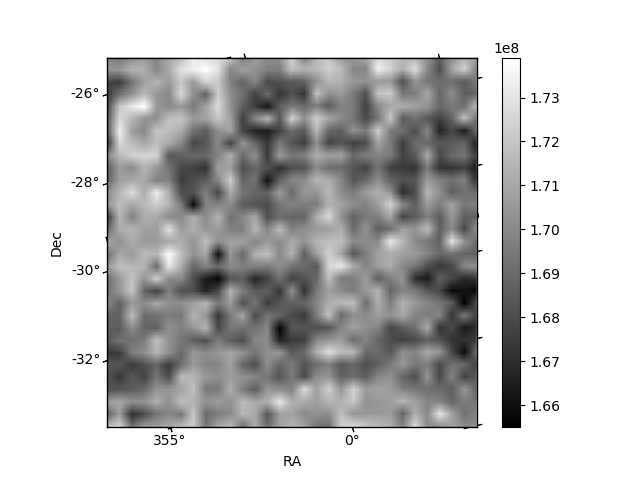
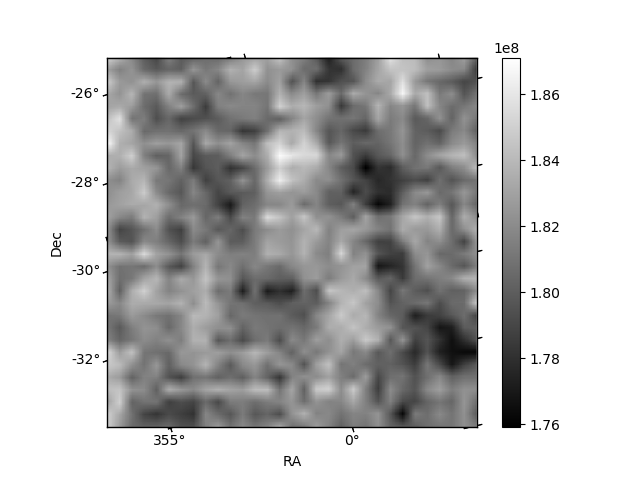
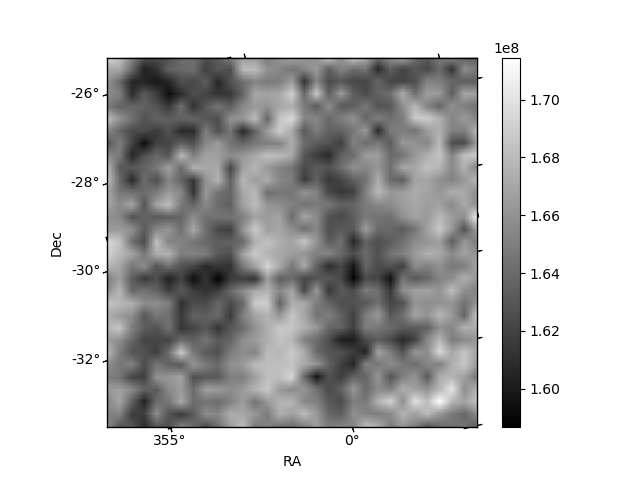
Histogram calculated using DETX and DETY for each event in the final _common_clean file
| Quadrant A | 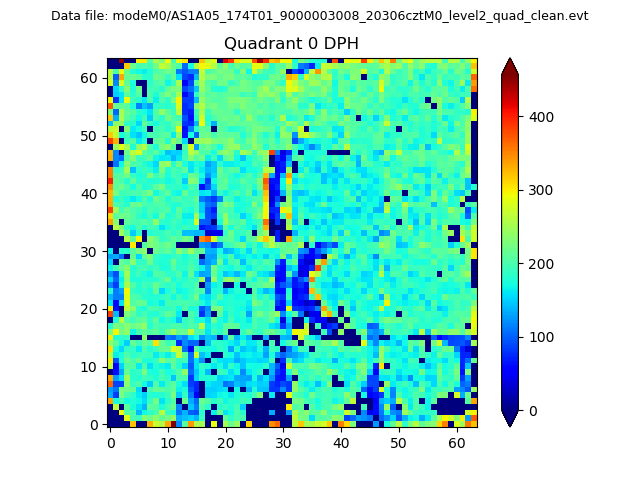 |
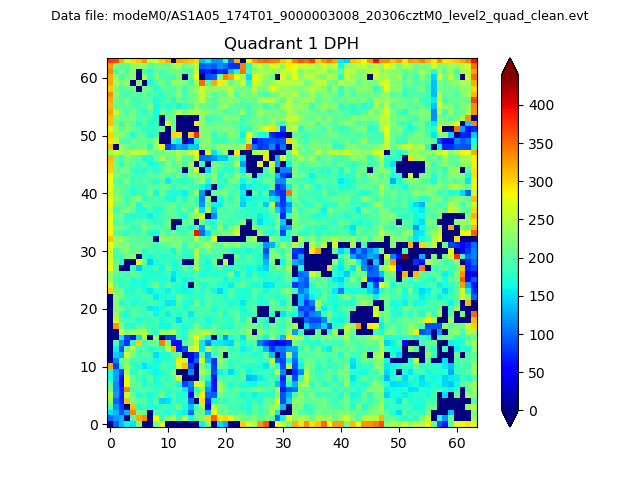 |
Quadrant B |
|---|---|---|---|
| Quadrant D |  |
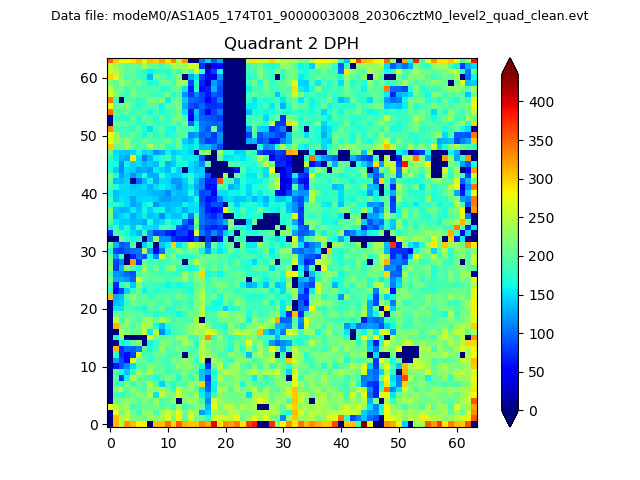 |
Quadrant C |
| Plot type | Count rate plots | Images |
|---|---|---|
| Comparison with Poisson distribution Blue bars denote a histogram of data divided into 1 sec bins. Red curve is a Poisson curve with rate = median count rate of data. |
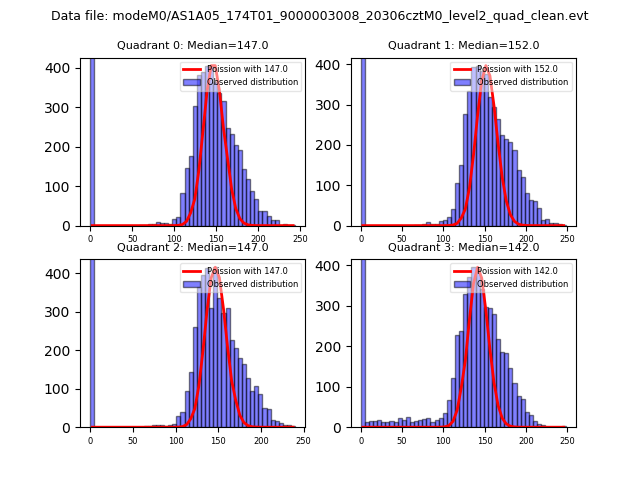 |
 |
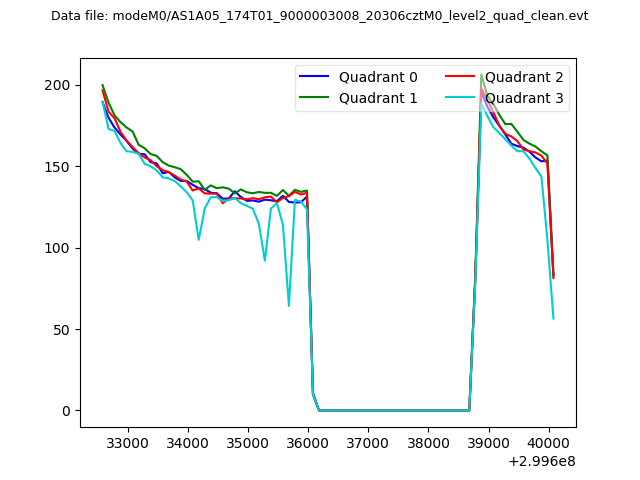
| Quadrant-wise count rates Data is divided into 100 sec bins |
 |
|
| Module-wise count rates for Quadrant A Data is divided into 100 sec bins |
 |
 |
| Module-wise count rates for Quadrant B Data is divided into 100 sec bins |
 |
 |
| Module-wise count rates for Quadrant C Data is divided into 100 sec bins |
 |
 |
| Module-wise count rates for Quadrant D Data is divided into 100 sec bins |
 |
 |
| Parameter | Plot |
|---|---|
| CZT HV Monitor |  |
| D_VDD | 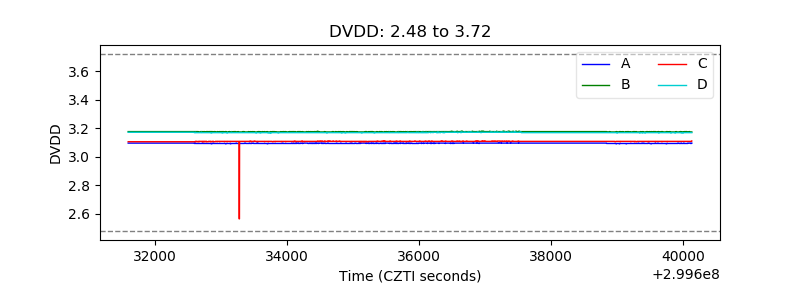 |
| Temperature 1 | 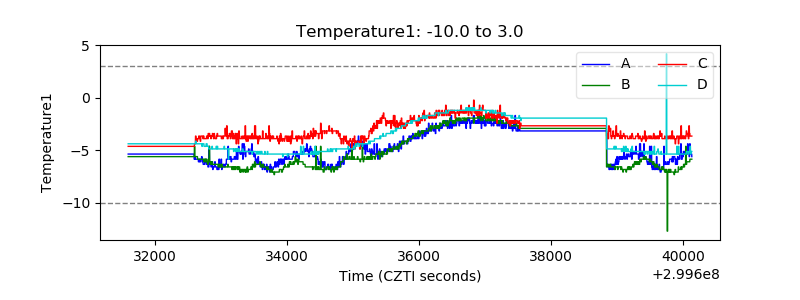 |
| Veto HV Monitor | 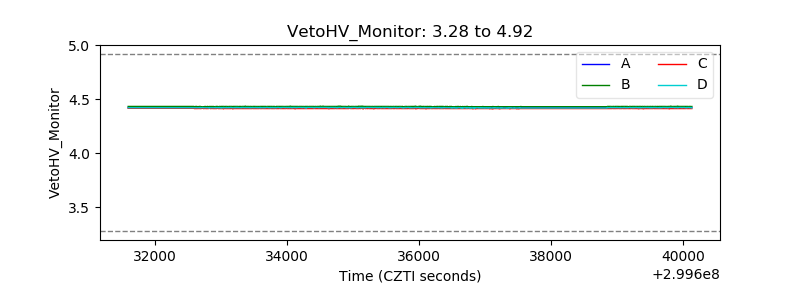 |
| Veto LLD | 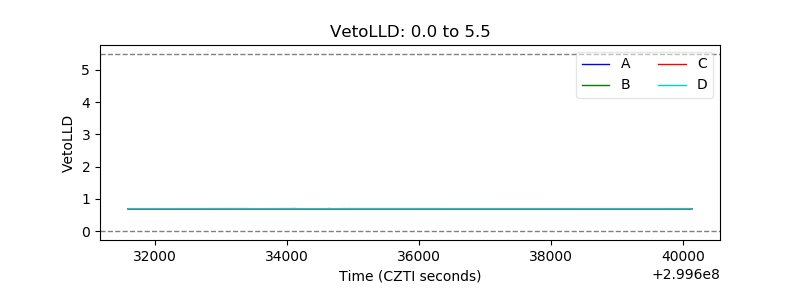 |
| Alpha Counter | 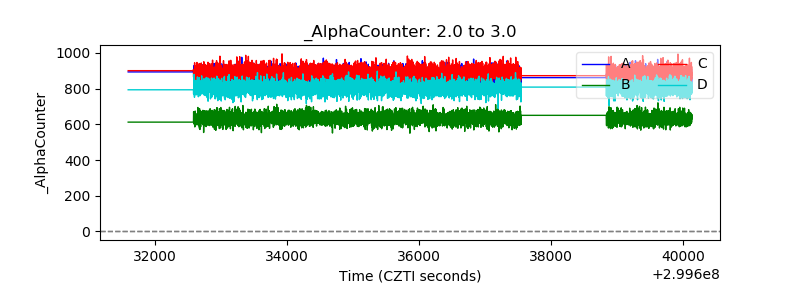 |
| _CPM_Rate | 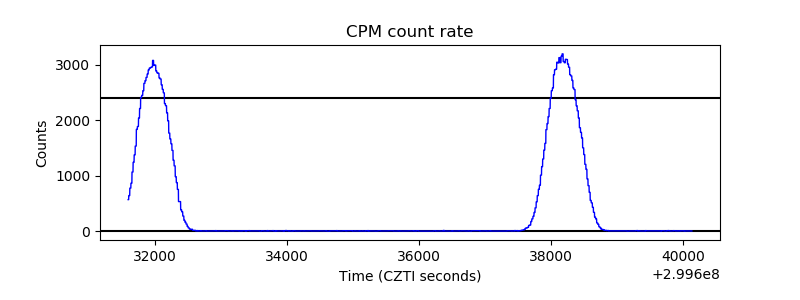 |
| CZT Counter | 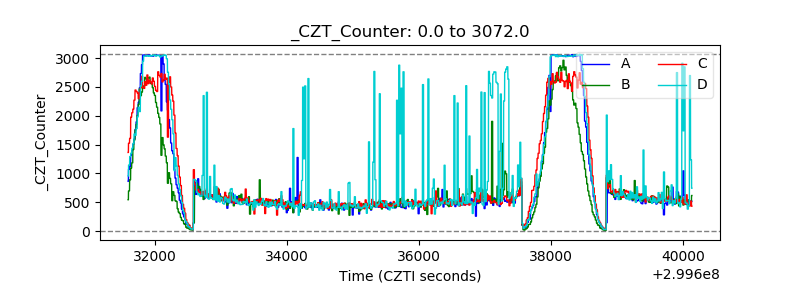 |
| +2.5 Volts monitor |  |
| +5 Volts monitor |  |
| _ROLL_ROT | 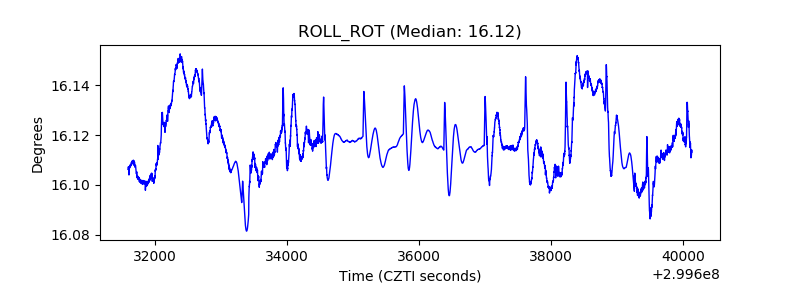 |
| _Roll_DEC | 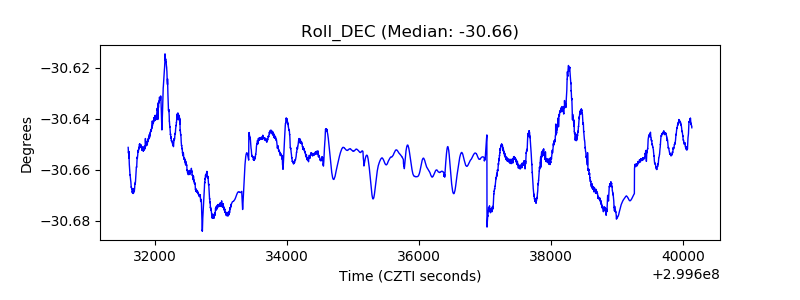 |
| _Roll_RA | 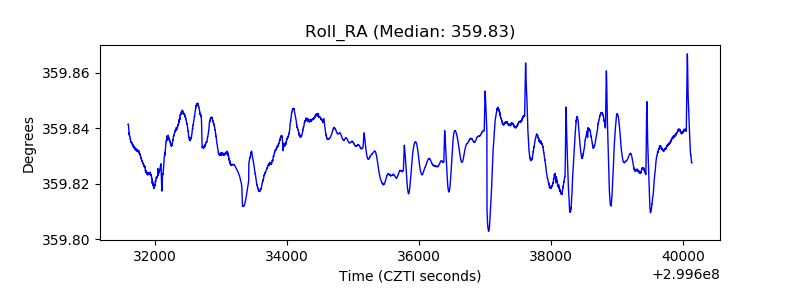 |
| Veto Counter | 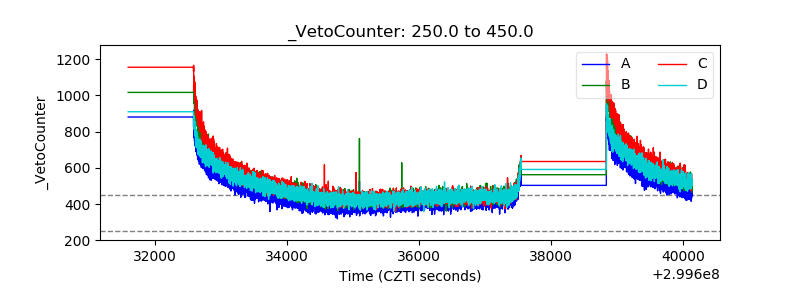 |