| Param | Original file | Final file |
|---|---|---|
| Filename | modeM0/AS1A05_174T01_9000003008_20310cztM0_level2.evt | modeM0/AS1A05_174T01_9000003008_20310cztM0_level2_quad_clean.evt |
| Size (bytes) | 899,519,040 | 138,303,360 |
| Size | 857.8 MB | 131.9 MB |
| Events in quadrant A | 6,384,321 | 867,965 |
| Events in quadrant B | 5,661,459 | 888,400 |
| Events in quadrant C | 8,423,081 | 837,898 |
| Events in quadrant D | 6,038,388 | 841,196 |
| Mode M9 | |||
|---|---|---|---|
| Quadrant | BADHDUFLAG | Total packets | Discarded packets |
| A | 0 | 22 | 0 |
| B | 0 | 22 | 0 |
| C | 0 | 22 | 0 |
| D | 0 | 22 | 0 |
| Mode M0 | |||
|---|---|---|---|
| Quadrant | BADHDUFLAG | Total packets | Discarded packets |
| A | 0 | 25836 | 2 |
| B | 0 | 23532 | 2 |
| C | 0 | 31871 | 2 |
| D | 0 | 24943 | 2 |
| Mode SS | |||
|---|---|---|---|
| Quadrant | BADHDUFLAG | Total packets | Discarded packets |
| A | 0 | 220 | 0 |
| B | 0 | 220 | 0 |
| C | 0 | 220 | 0 |
| D | 0 | 220 | 0 |
| Quadrant | Total seconds | Saturated seconds | Saturation percentage |
|---|---|---|---|
| A | 10879 | 254 | 2.334773% |
| B | 10879 | 217 | 1.994669% |
| C | 10879 | 775 | 7.123817% |
| D | 10879 | 264 | 2.426694% |
Noise dominated data is calculated using 1-second bins in cleaned event files. If a bin has >2000 counts, and if more than 50% of those come from <1% of pixels, then it is considered to be noise-dominated and hence unusable.
| Quadrant | # 1 sec bins | Bins with >0 counts | Bins with >2000 counts | High rate bins dominated by noise | Noise dominated (total time) | Noise dominated (detector-on time) | Marked lightcurve |
|---|---|---|---|---|---|---|---|
| A | 12969 | 10881 | 75 | 75 | 0.58% | 0.69% |  |
| B | 12969 | 10881 | 44 | 44 | 0.34% | 0.40% | 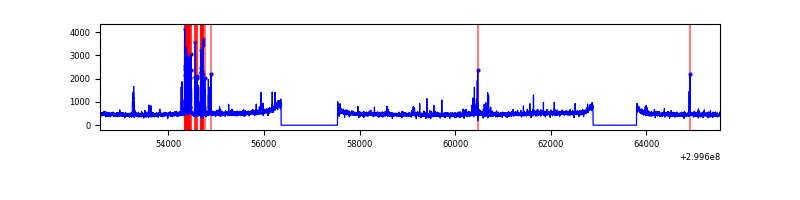 |
| C | 12969 | 10881 | 372 | 372 | 2.87% | 3.42% | 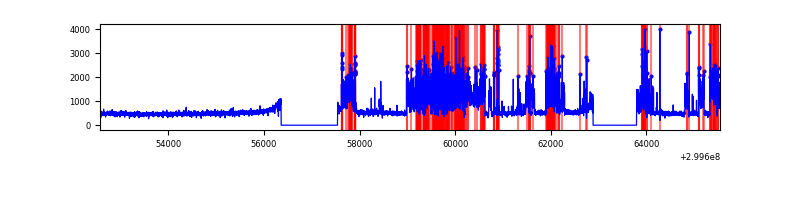 |
| D | 12969 | 10881 | 133 | 133 | 1.03% | 1.22% |  |
Top three noisy pixels from each quadrant. If the there are fewer than three noisy pixels in the level2.evt file, extra rows are filled as -1
| Pixel properties | Quadrant properties | ||||||
|---|---|---|---|---|---|---|---|
| Quadrant | DetID | PixID | Counts | Sigma | Mean | Median | Sigma |
| A | 14 | 238 | 777745 | 2845.37 | 1364 | 1335 | 272.9 |
| A | 4 | 2 | 130544 | 473.52 | 1364 | 1335 | 272.9 |
| A | 9 | 143 | 113297 | 410.32 | 1364 | 1335 | 272.9 |
| B | 7 | 220 | 178207 | 691.53 | 1348 | 1314 | 255.8 |
| B | 4 | 142 | 84702 | 325.99 | 1348 | 1314 | 255.8 |
| B | 0 | 230 | 40029 | 151.35 | 1348 | 1314 | 255.8 |
| C | 3 | 9 | 3133329 | 10273.87 | 1303 | 1311 | 304.9 |
| C | 14 | 238 | 201860 | 657.86 | 1303 | 1311 | 304.9 |
| C | 13 | 61 | 9119 | 25.61 | 1303 | 1311 | 304.9 |
| D | 1 | 52 | 632123 | 1914.65 | 1347 | 1308 | 329.5 |
| D | 11 | 176 | 163571 | 492.5 | 1347 | 1308 | 329.5 |
| D | 7 | 96 | 71322 | 212.51 | 1347 | 1308 | 329.5 |
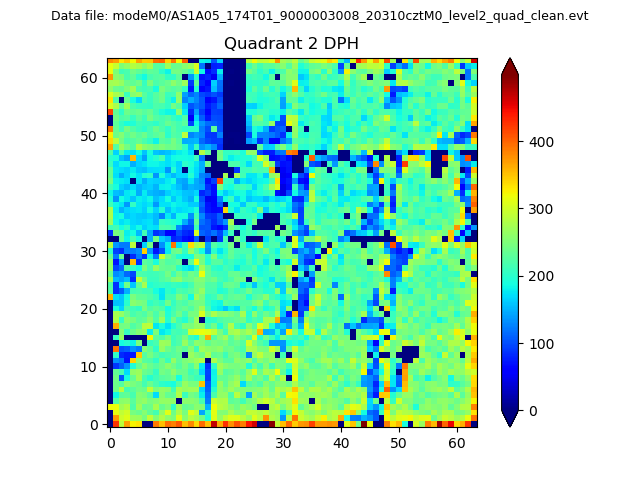
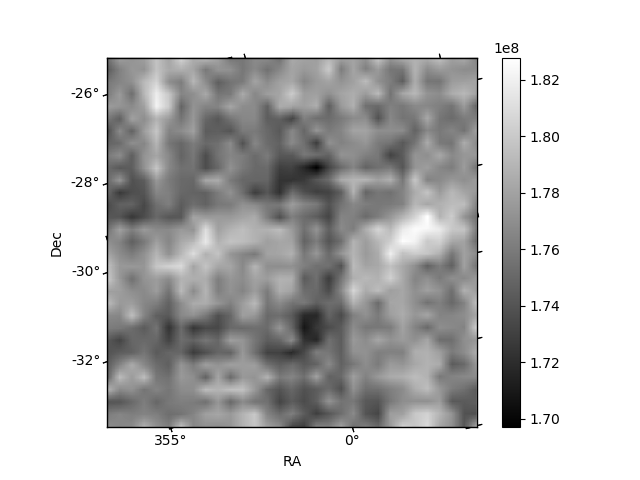
Histogram calculated using DETX and DETY for each event in the final _common_clean file
| Quadrant A | 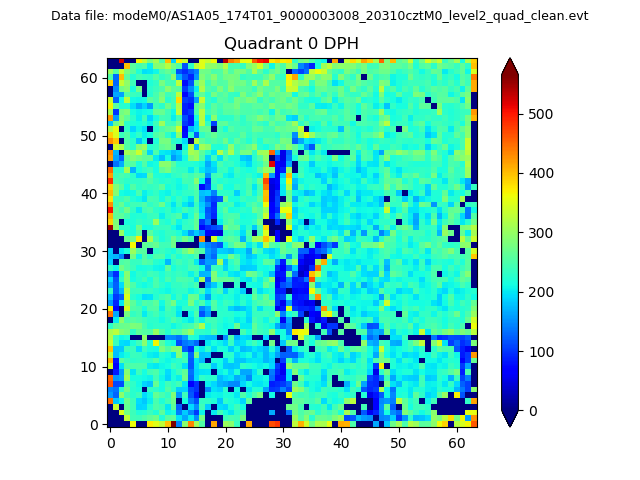 |
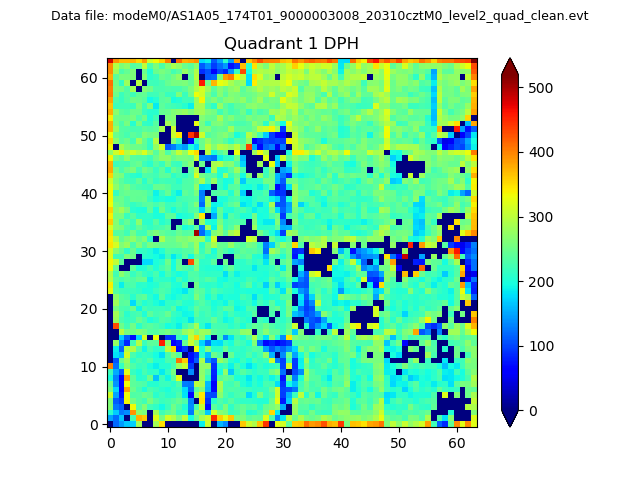 |
Quadrant B |
|---|---|---|---|
| Quadrant D | 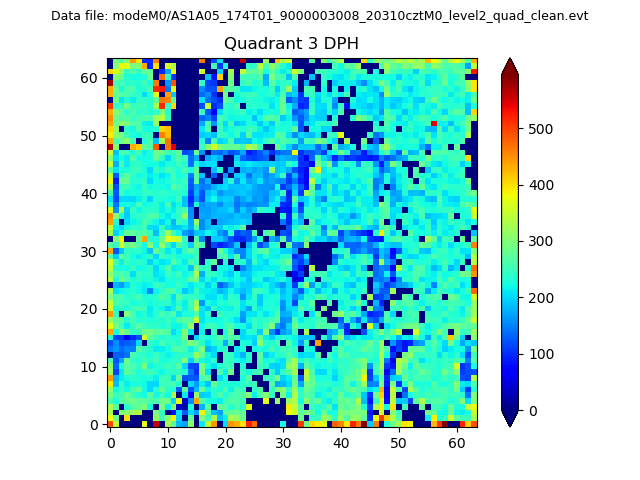 |
 |
Quadrant C |
| Plot type | Count rate plots | Images |
|---|---|---|
| Comparison with Poisson distribution Blue bars denote a histogram of data divided into 1 sec bins. Red curve is a Poisson curve with rate = median count rate of data. |
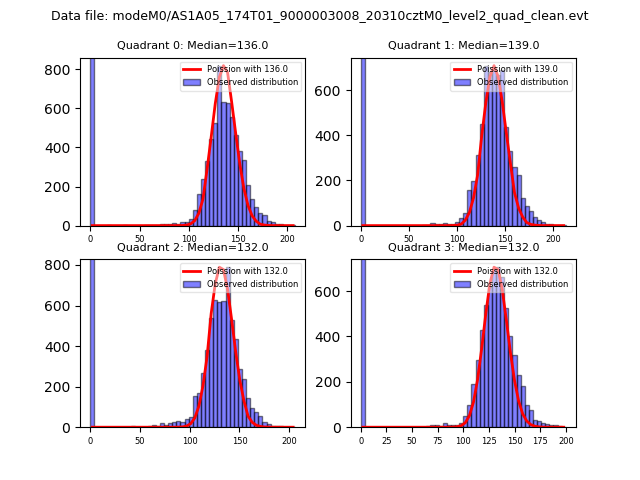 |
 |
| Quadrant-wise count rates Data is divided into 100 sec bins |
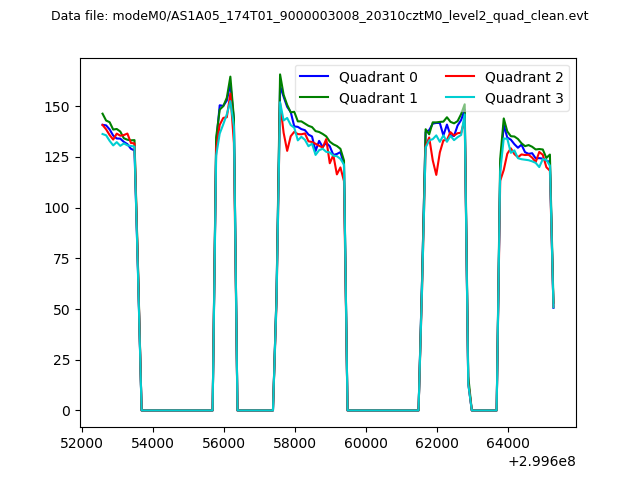 |
|
| Module-wise count rates for Quadrant A Data is divided into 100 sec bins |
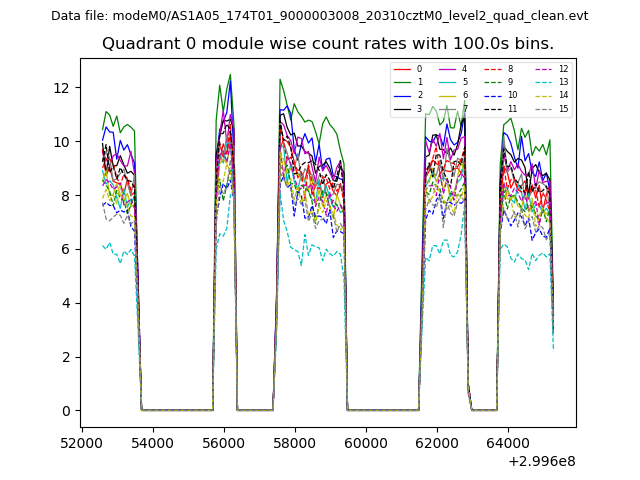 |
 |
| Module-wise count rates for Quadrant B Data is divided into 100 sec bins |
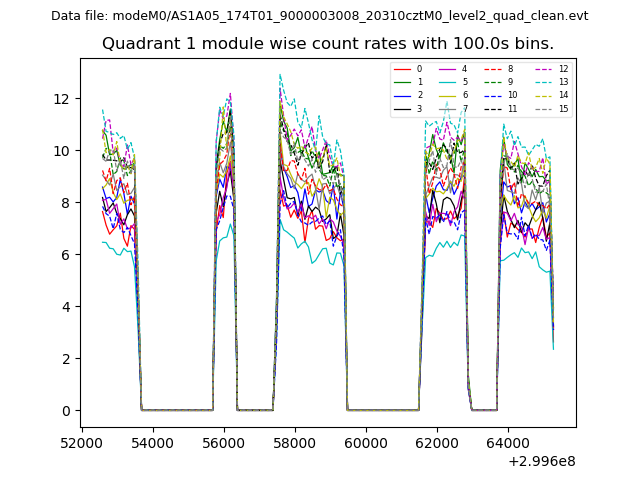 |
 |
| Module-wise count rates for Quadrant C Data is divided into 100 sec bins |
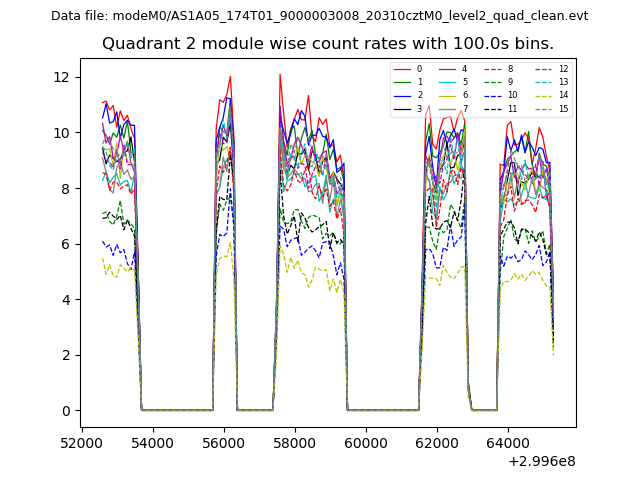 |
 |
| Module-wise count rates for Quadrant D Data is divided into 100 sec bins |
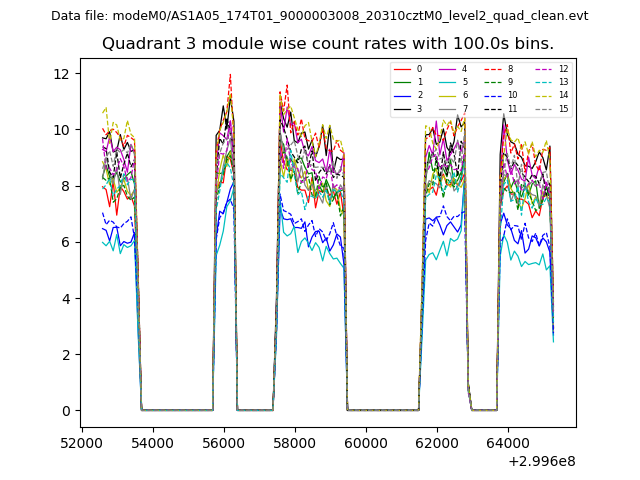 |
 |
| Parameter | Plot |
|---|---|
| CZT HV Monitor | 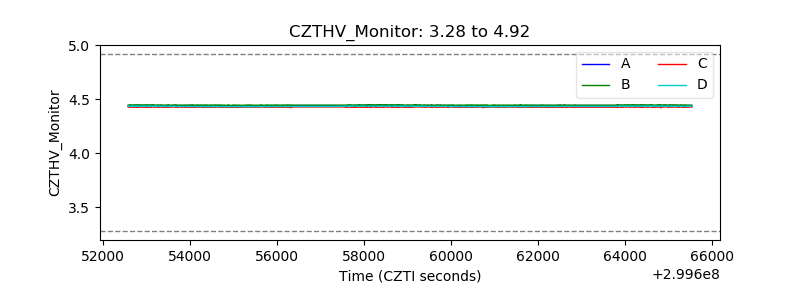 |
| D_VDD |  |
| Temperature 1 | 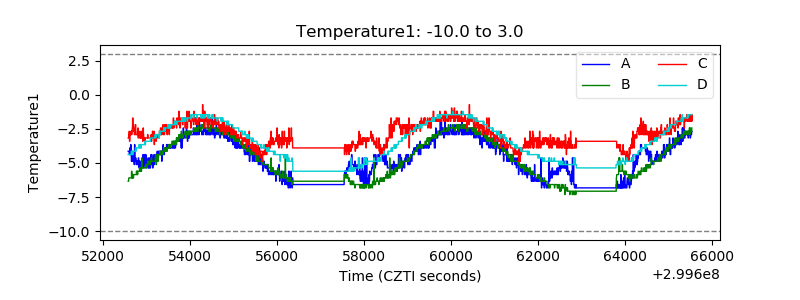 |
| Veto HV Monitor | 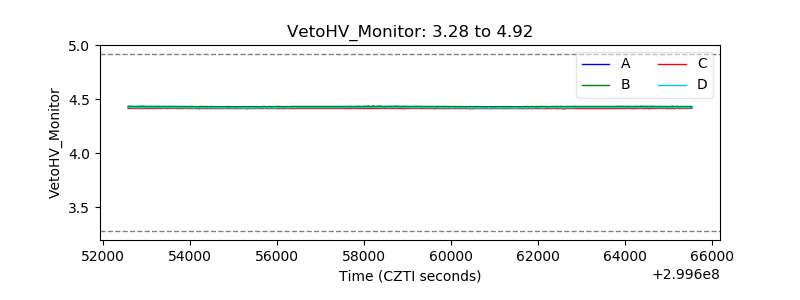 |
| Veto LLD | 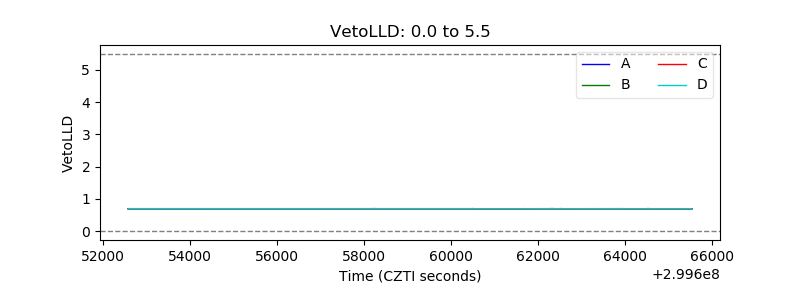 |
| Alpha Counter | 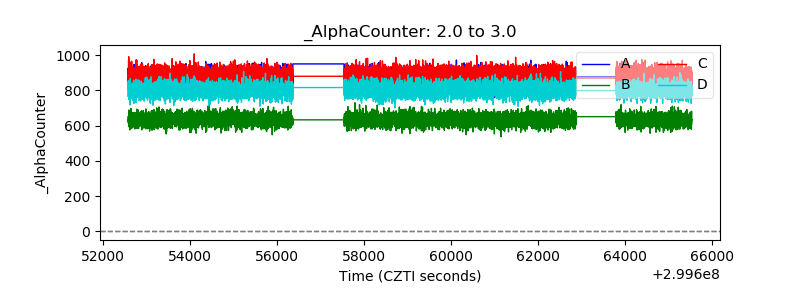 |
| _CPM_Rate | 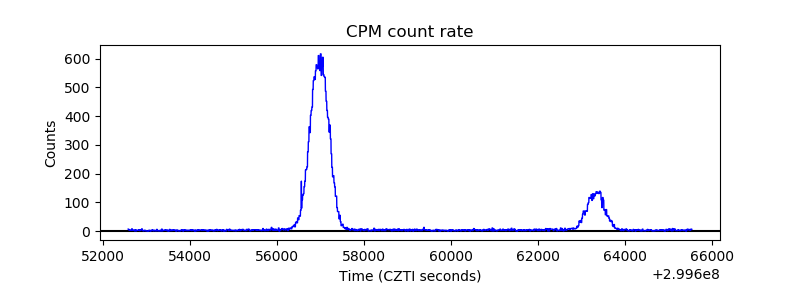 |
| CZT Counter | 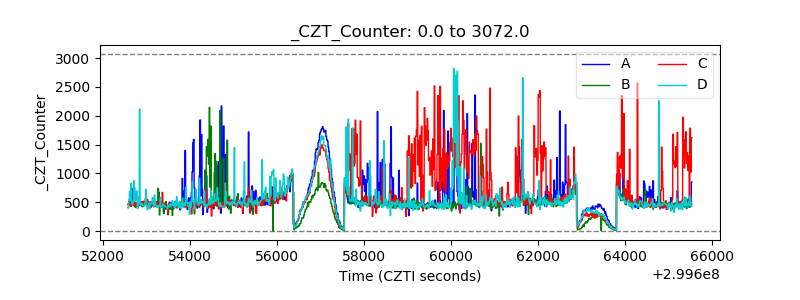 |
| +2.5 Volts monitor |  |
| +5 Volts monitor | 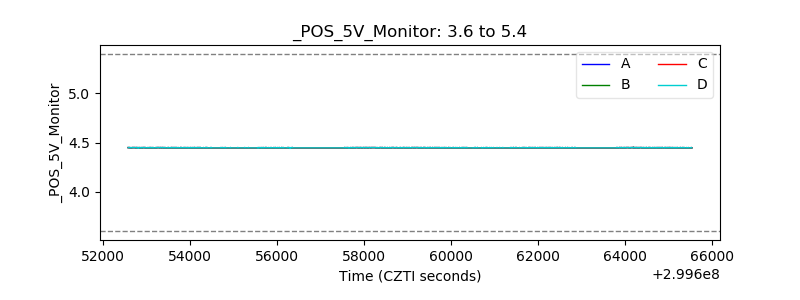 |
| _ROLL_ROT | 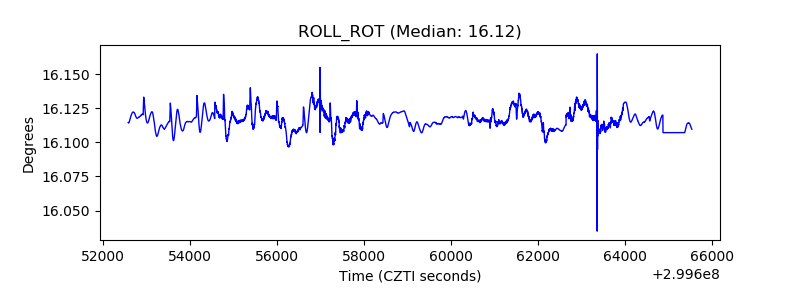 |
| _Roll_DEC | 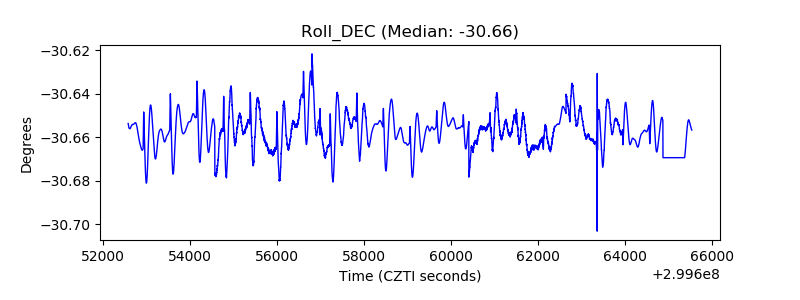 |
| _Roll_RA | 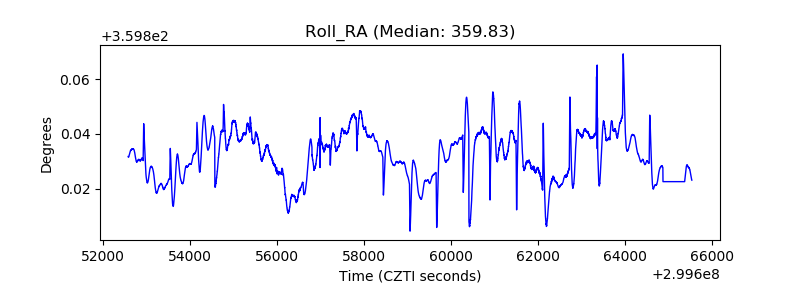 |
| Veto Counter | 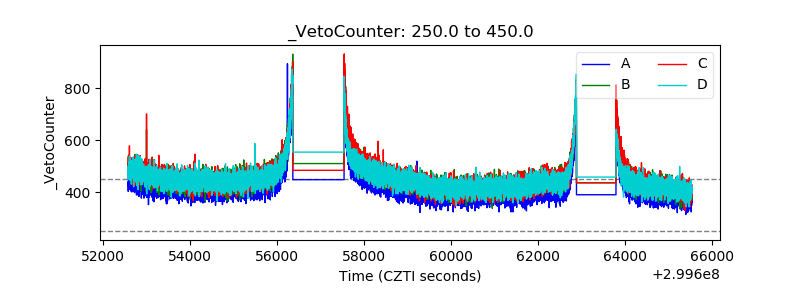 |