| Param | Original file | Final file |
|---|---|---|
| Filename | modeM0/AS1A05_174T01_9000003008_20311cztM0_level2.evt | modeM0/AS1A05_174T01_9000003008_20311cztM0_level2_quad_clean.evt |
| Size (bytes) | 544,550,400 | 85,438,080 |
| Size | 519.3 MB | 81.5 MB |
| Events in quadrant A | 3,808,662 | 531,446 |
| Events in quadrant B | 3,465,752 | 545,118 |
| Events in quadrant C | 5,575,623 | 513,283 |
| Events in quadrant D | 3,178,992 | 521,604 |
| Mode M9 | |||
|---|---|---|---|
| Quadrant | BADHDUFLAG | Total packets | Discarded packets |
| A | 0 | 4 | 0 |
| B | 0 | 4 | 0 |
| C | 0 | 4 | 0 |
| D | 0 | 4 | 0 |
| Mode M0 | |||
|---|---|---|---|
| Quadrant | BADHDUFLAG | Total packets | Discarded packets |
| A | 0 | 15712 | 2 |
| B | 0 | 14541 | 1 |
| C | 0 | 20870 | 1 |
| D | 0 | 14117 | 1 |
| Mode SS | |||
|---|---|---|---|
| Quadrant | BADHDUFLAG | Total packets | Discarded packets |
| A | 0 | 140 | 0 |
| B | 0 | 140 | 0 |
| C | 0 | 140 | 0 |
| D | 0 | 140 | 0 |
| Quadrant | Total seconds | Saturated seconds | Saturation percentage |
|---|---|---|---|
| A | 6817 | 218 | 3.197888% |
| B | 6817 | 176 | 2.581781% |
| C | 6817 | 600 | 8.801526% |
| D | 6817 | 113 | 1.657621% |
Noise dominated data is calculated using 1-second bins in cleaned event files. If a bin has >2000 counts, and if more than 50% of those come from <1% of pixels, then it is considered to be noise-dominated and hence unusable.
| Quadrant | # 1 sec bins | Bins with >0 counts | Bins with >2000 counts | High rate bins dominated by noise | Noise dominated (total time) | Noise dominated (detector-on time) | Marked lightcurve |
|---|---|---|---|---|---|---|---|
| A | 7297 | 6818 | 27 | 27 | 0.37% | 0.40% | 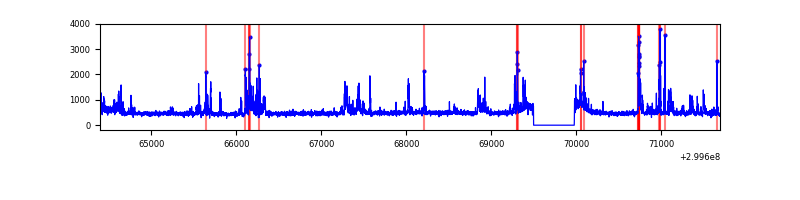 |
| B | 7297 | 6818 | 16 | 16 | 0.22% | 0.23% | 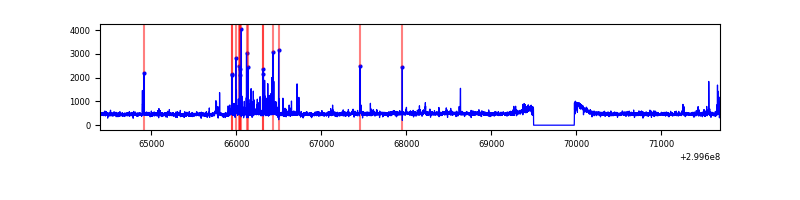 |
| C | 7297 | 6818 | 297 | 297 | 4.07% | 4.36% |  |
| D | 7297 | 6818 | 10 | 10 | 0.14% | 0.15% | 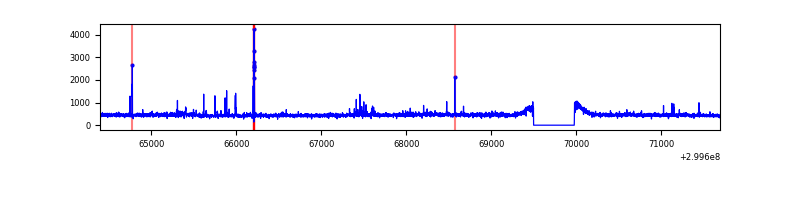 |
Top three noisy pixels from each quadrant. If the there are fewer than three noisy pixels in the level2.evt file, extra rows are filled as -1
| Pixel properties | Quadrant properties | ||||||
|---|---|---|---|---|---|---|---|
| Quadrant | DetID | PixID | Counts | Sigma | Mean | Median | Sigma |
| A | 14 | 238 | 591180 | 3533.67 | 823 | 804 | 167.1 |
| A | 5 | 98 | 20045 | 115.17 | 823 | 804 | 167.1 |
| A | 8 | 205 | 17407 | 99.38 | 823 | 804 | 167.1 |
| B | 7 | 220 | 114711 | 721.11 | 817 | 797 | 158.0 |
| B | 4 | 142 | 40206 | 249.47 | 817 | 797 | 158.0 |
| B | 0 | 214 | 20938 | 127.5 | 817 | 797 | 158.0 |
| C | 3 | 9 | 2369991 | 12763.17 | 787 | 791 | 185.6 |
| C | 14 | 238 | 121463 | 650.07 | 787 | 791 | 185.6 |
| C | 0 | 207 | 14653 | 74.68 | 787 | 791 | 185.6 |
| D | 2 | 184 | 32353 | 157.89 | 816 | 792 | 199.9 |
| D | 2 | 234 | 25232 | 122.27 | 816 | 792 | 199.9 |
| D | 7 | 96 | 16962 | 80.9 | 816 | 792 | 199.9 |
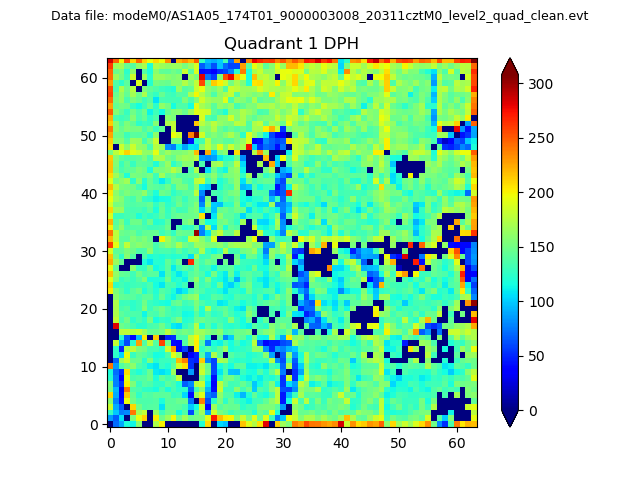
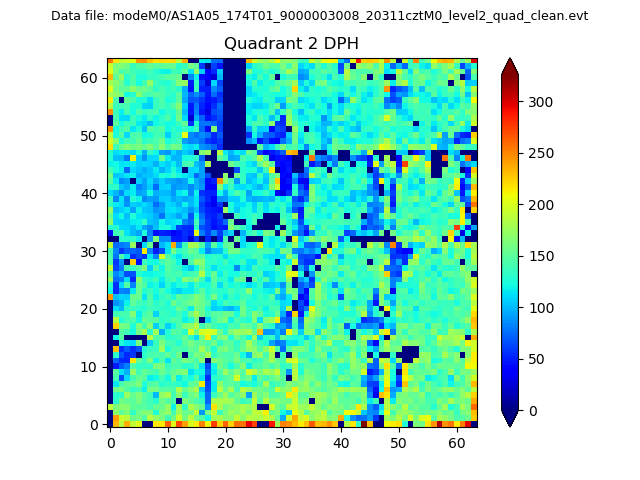
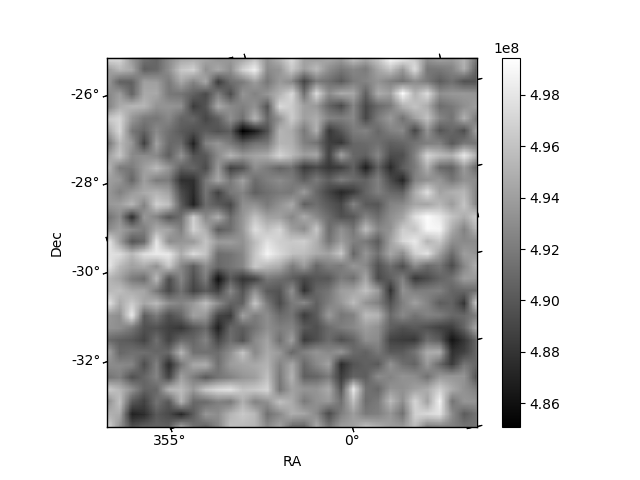
Histogram calculated using DETX and DETY for each event in the final _common_clean file
| Quadrant A | 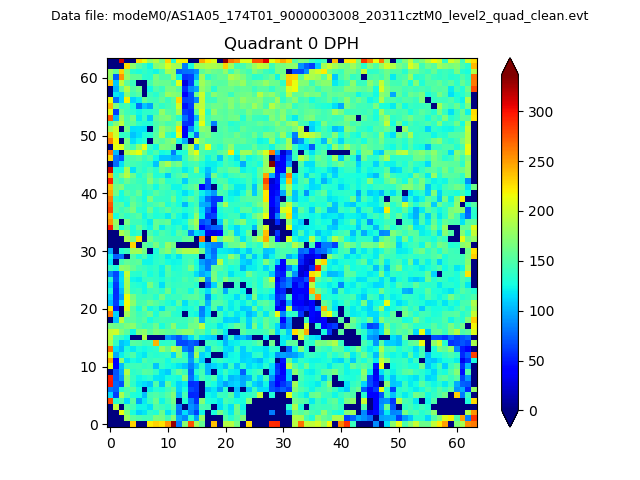 |
 |
Quadrant B |
|---|---|---|---|
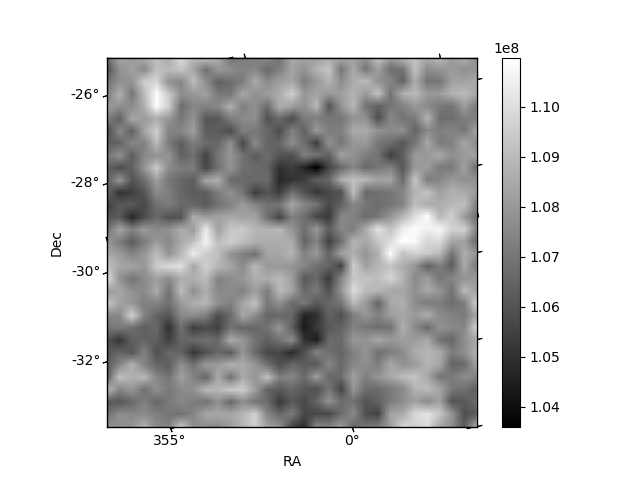
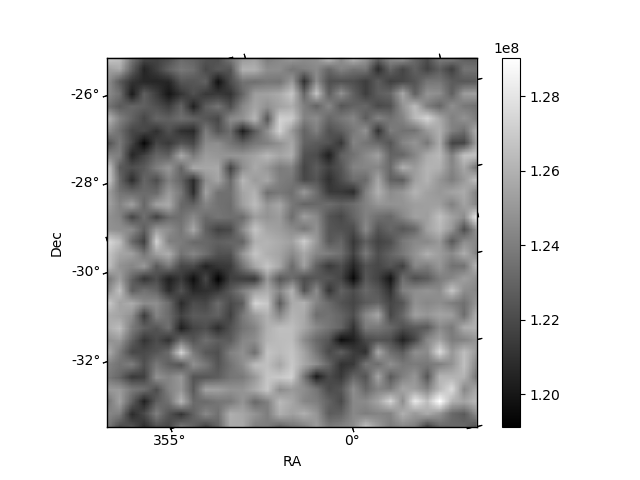
| Quadrant D | 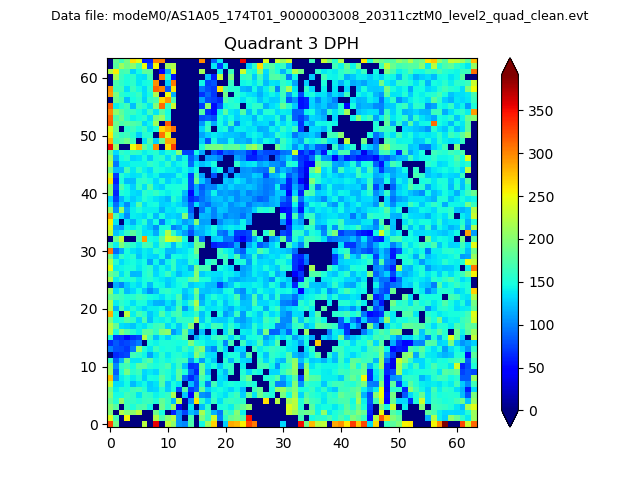 |
 |
Quadrant C |
| Plot type | Count rate plots | Images |
|---|---|---|
| Comparison with Poisson distribution Blue bars denote a histogram of data divided into 1 sec bins. Red curve is a Poisson curve with rate = median count rate of data. |
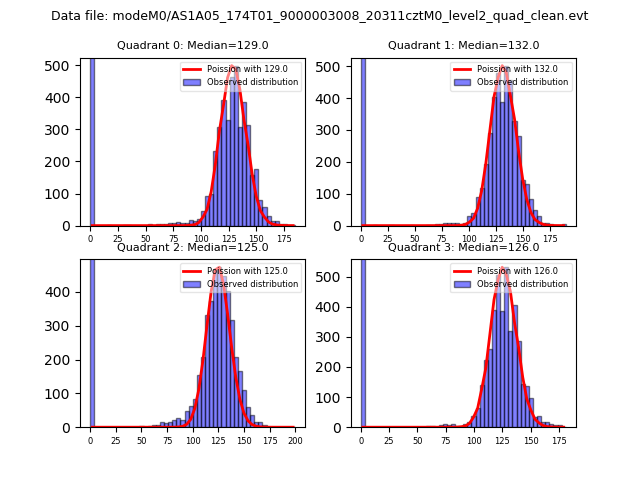 |
 |
| Quadrant-wise count rates Data is divided into 100 sec bins |
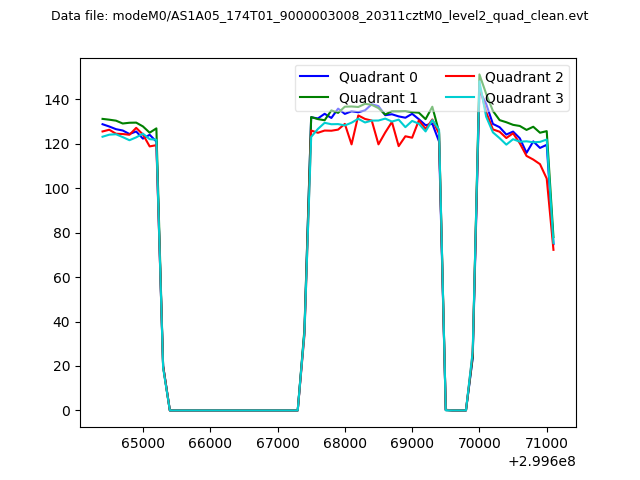 |
|
| Module-wise count rates for Quadrant A Data is divided into 100 sec bins |
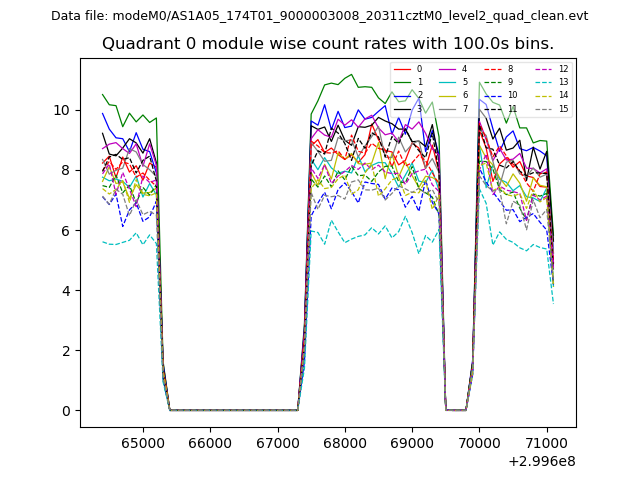 |
 |
| Module-wise count rates for Quadrant B Data is divided into 100 sec bins |
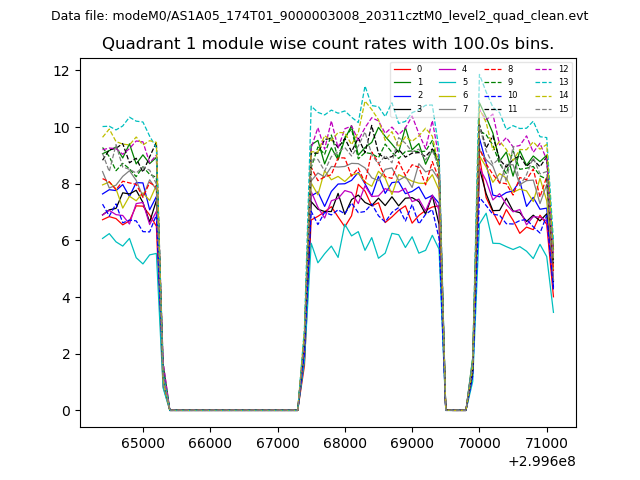 |
 |
| Module-wise count rates for Quadrant C Data is divided into 100 sec bins |
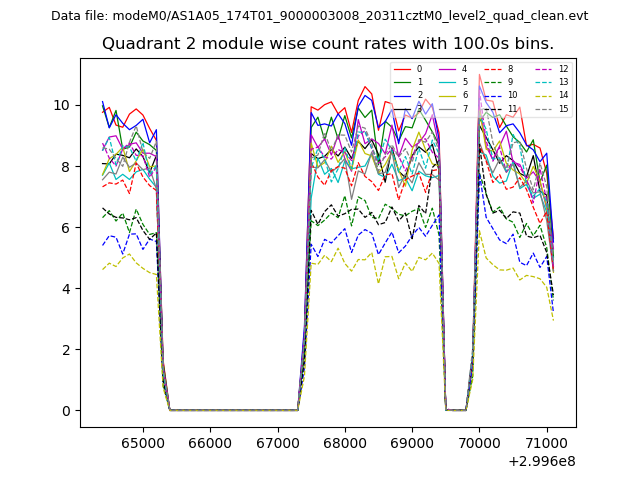 |
 |
| Module-wise count rates for Quadrant D Data is divided into 100 sec bins |
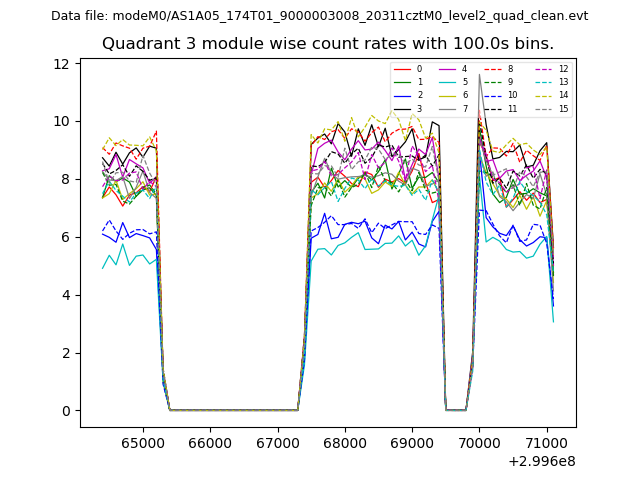 |
 |
| Parameter | Plot |
|---|---|
| CZT HV Monitor | 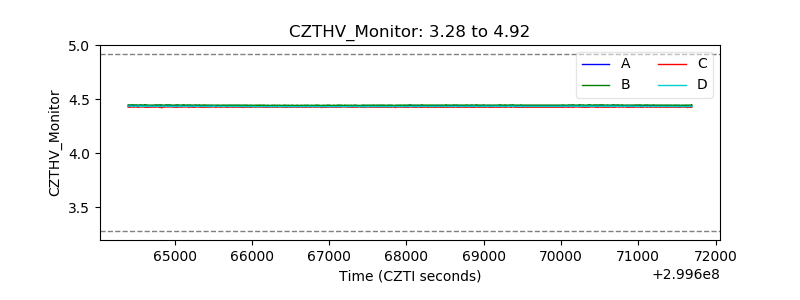 |
| D_VDD | 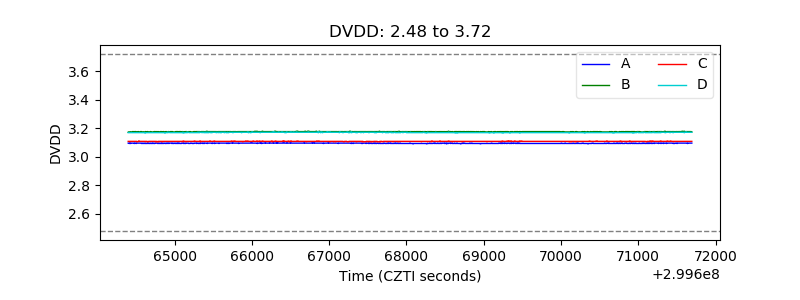 |
| Temperature 1 | 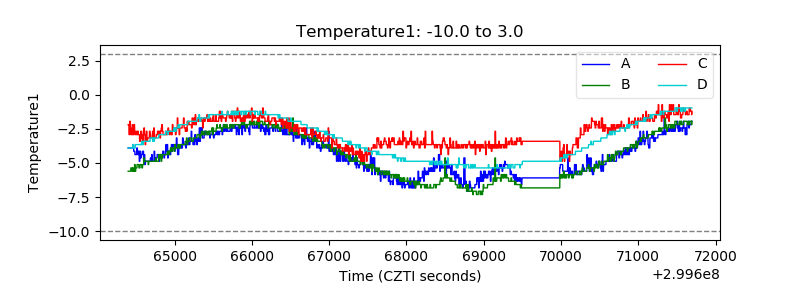 |
| Veto HV Monitor | 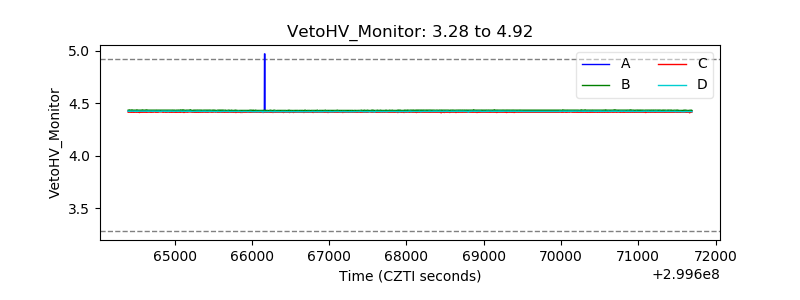 |
| Veto LLD | 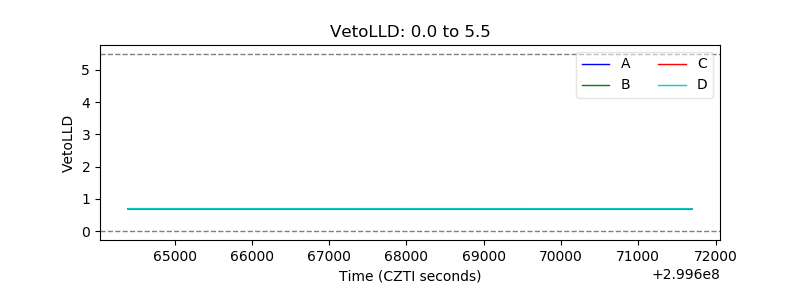 |
| Alpha Counter | 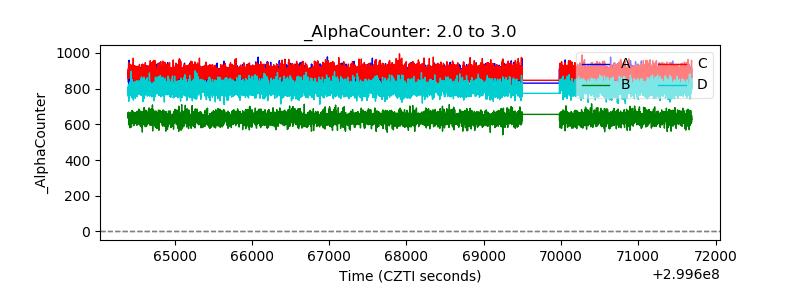 |
| _CPM_Rate |  |
| CZT Counter | 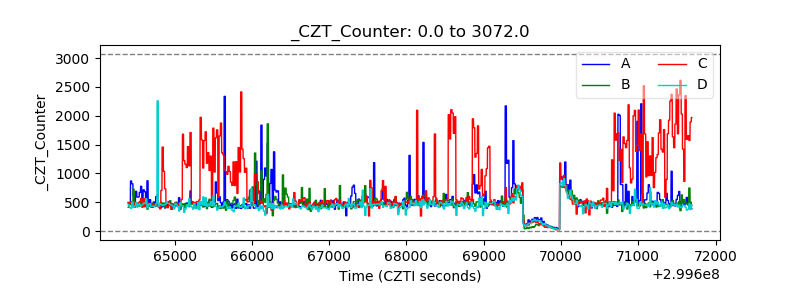 |
| +2.5 Volts monitor | 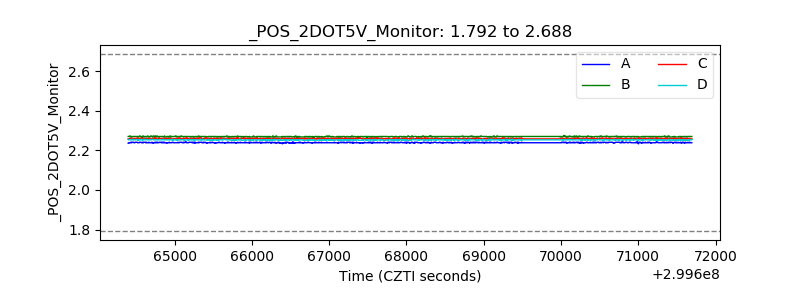 |
| +5 Volts monitor | 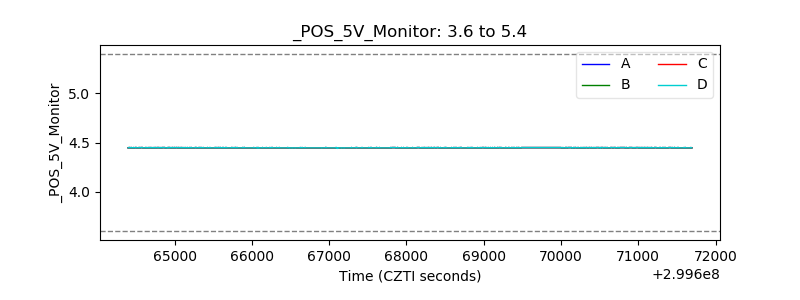 |
| _ROLL_ROT | 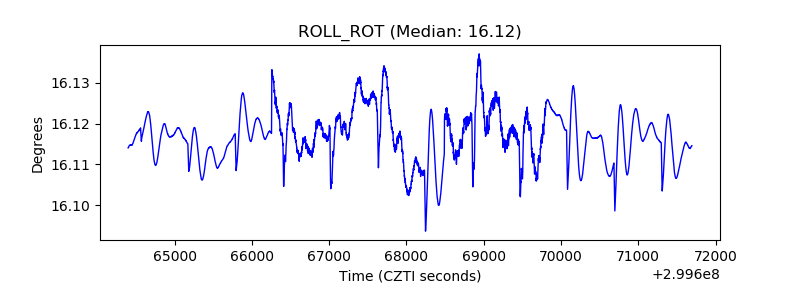 |
| _Roll_DEC | 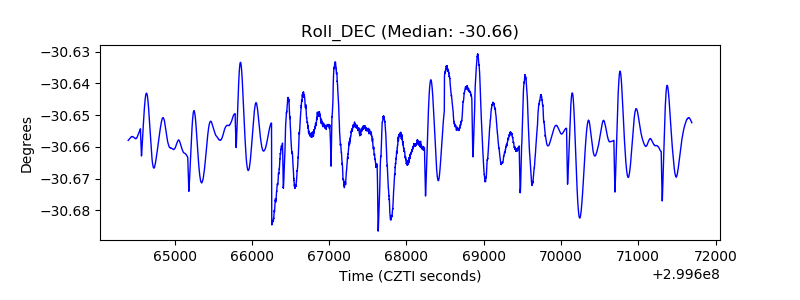 |
| _Roll_RA | 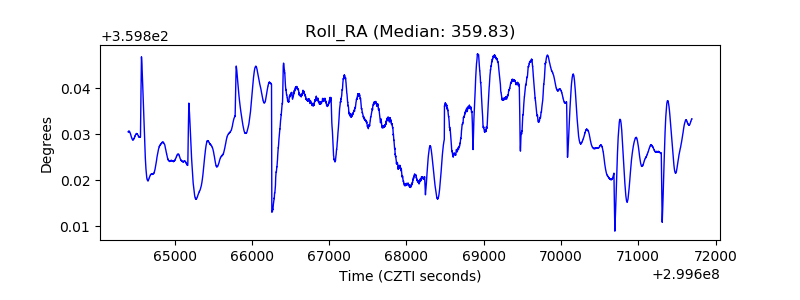 |
| Veto Counter | 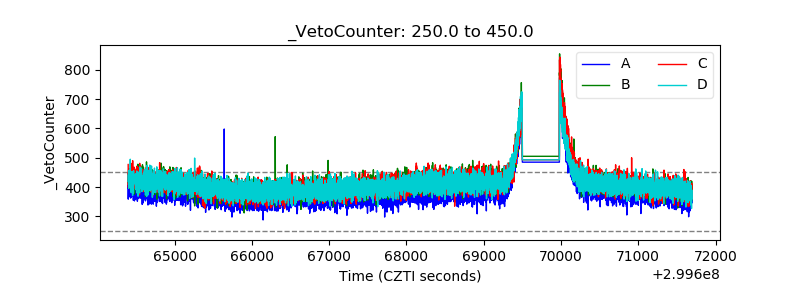 |