| Param | Original file | Final file |
|---|---|---|
| Filename | modeM0/AS1A05_174T01_9000003008_20312cztM0_level2.evt | modeM0/AS1A05_174T01_9000003008_20312cztM0_level2_quad_clean.evt |
| Size (bytes) | 698,091,840 | 87,076,800 |
| Size | 665.8 MB | 83.0 MB |
| Events in quadrant A | 4,090,513 | 536,887 |
| Events in quadrant B | 3,921,484 | 554,148 |
| Events in quadrant C | 9,178,584 | 503,238 |
| Events in quadrant D | 3,456,464 | 532,813 |
| Mode M9 | |||
|---|---|---|---|
| Quadrant | BADHDUFLAG | Total packets | Discarded packets |
| A | 0 | 2 | 0 |
| B | 0 | 2 | 0 |
| C | 0 | 2 | 0 |
| D | 0 | 2 | 0 |
| Mode M0 | |||
|---|---|---|---|
| Quadrant | BADHDUFLAG | Total packets | Discarded packets |
| A | 0 | 16905 | 2 |
| B | 0 | 16220 | 2 |
| C | 0 | 32362 | 2 |
| D | 0 | 15378 | 3 |
| Mode SS | |||
|---|---|---|---|
| Quadrant | BADHDUFLAG | Total packets | Discarded packets |
| A | 0 | 150 | 0 |
| B | 0 | 150 | 0 |
| C | 0 | 150 | 0 |
| D | 0 | 150 | 0 |
| Quadrant | Total seconds | Saturated seconds | Saturation percentage |
|---|---|---|---|
| A | 7313 | 354 | 4.840695% |
| B | 7313 | 331 | 4.526186% |
| C | 7313 | 1271 | 17.380008% |
| D | 7313 | 227 | 3.104061% |
Noise dominated data is calculated using 1-second bins in cleaned event files. If a bin has >2000 counts, and if more than 50% of those come from <1% of pixels, then it is considered to be noise-dominated and hence unusable.
| Quadrant | # 1 sec bins | Bins with >0 counts | Bins with >2000 counts | High rate bins dominated by noise | Noise dominated (total time) | Noise dominated (detector-on time) | Marked lightcurve |
|---|---|---|---|---|---|---|---|
| A | 7448 | 7315 | 60 | 60 | 0.81% | 0.82% | 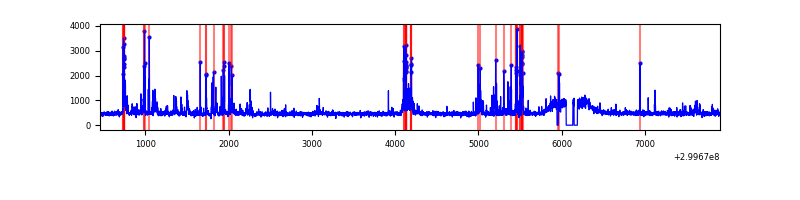 |
| B | 7448 | 7316 | 45 | 45 | 0.60% | 0.62% | 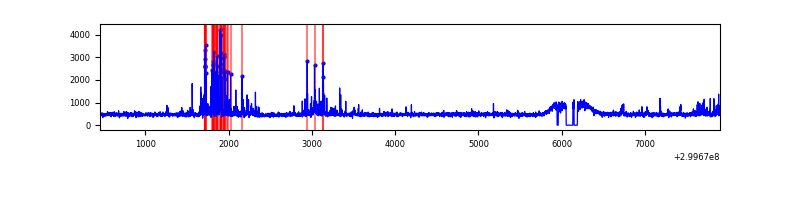 |
| C | 7448 | 7316 | 562 | 562 | 7.55% | 7.68% | 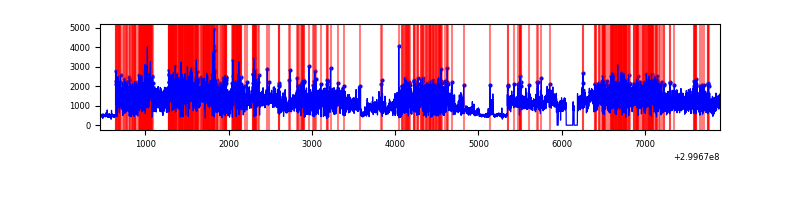 |
| D | 7448 | 7316 | 11 | 11 | 0.15% | 0.15% | 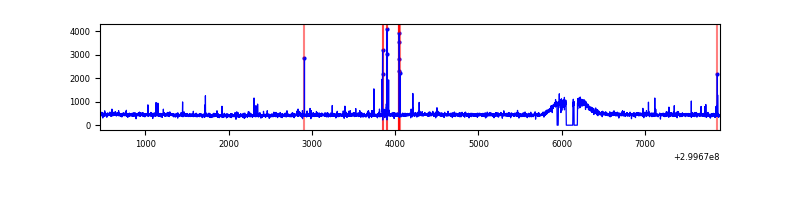 |
Top three noisy pixels from each quadrant. If the there are fewer than three noisy pixels in the level2.evt file, extra rows are filled as -1
| Pixel properties | Quadrant properties | ||||||
|---|---|---|---|---|---|---|---|
| Quadrant | DetID | PixID | Counts | Sigma | Mean | Median | Sigma |
| A | 14 | 238 | 424248 | 2286.42 | 897 | 874 | 185.2 |
| A | 4 | 2 | 163984 | 880.87 | 897 | 874 | 185.2 |
| A | 12 | 96 | 29958 | 157.07 | 897 | 874 | 185.2 |
| B | 7 | 220 | 167553 | 959.7 | 891 | 869 | 173.7 |
| B | 4 | 142 | 145018 | 829.96 | 891 | 869 | 173.7 |
| B | 0 | 197 | 25670 | 142.79 | 891 | 869 | 173.7 |
| C | 3 | 9 | 5774815 | 29266.74 | 837 | 841 | 197.3 |
| C | 14 | 238 | 126641 | 637.65 | 837 | 841 | 197.3 |
| C | 3 | 233 | 12071 | 56.92 | 837 | 841 | 197.3 |
| D | 2 | 184 | 47761 | 214.94 | 893 | 868 | 218.2 |
| D | 2 | 234 | 29726 | 132.27 | 893 | 868 | 218.2 |
| D | 2 | 153 | 11541 | 48.92 | 893 | 868 | 218.2 |
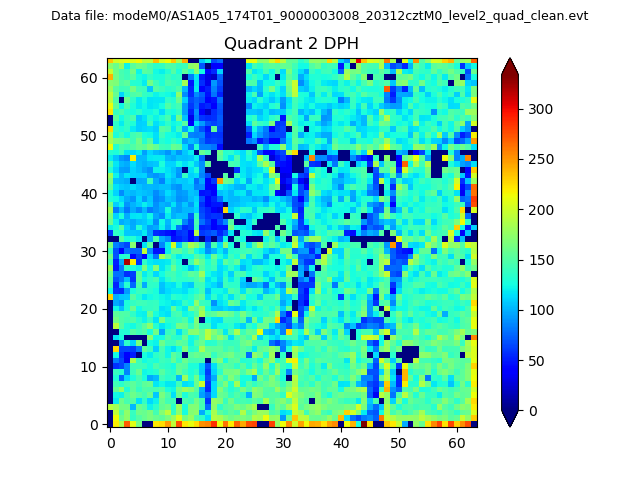
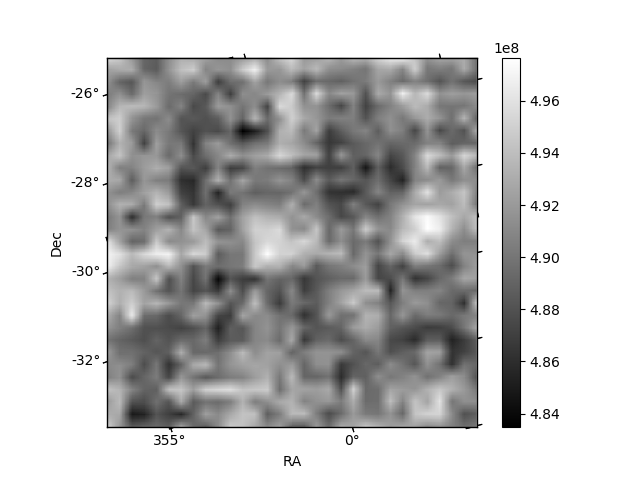
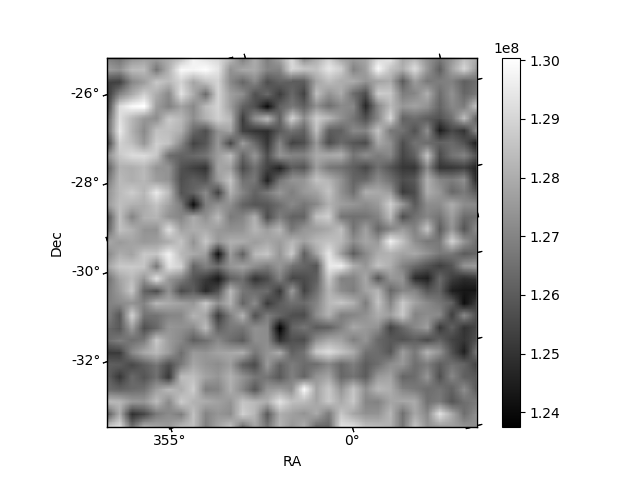
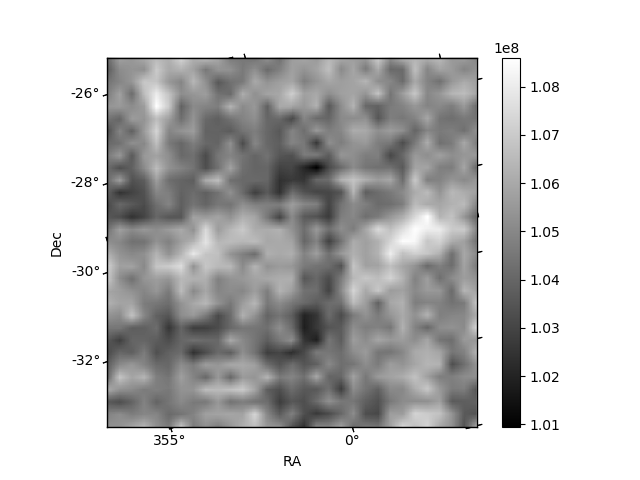
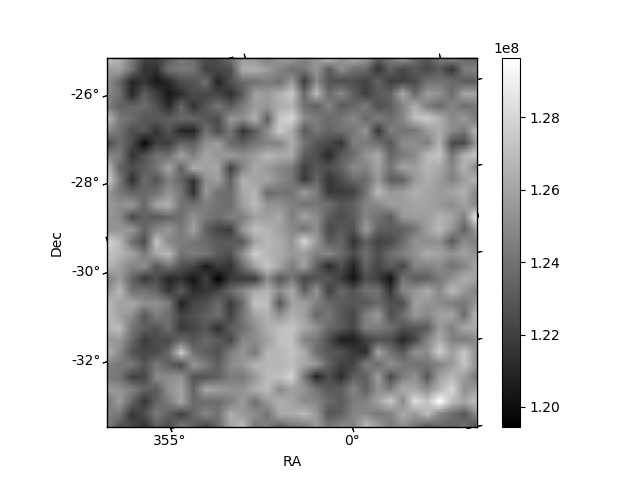
Histogram calculated using DETX and DETY for each event in the final _common_clean file
| Quadrant A | 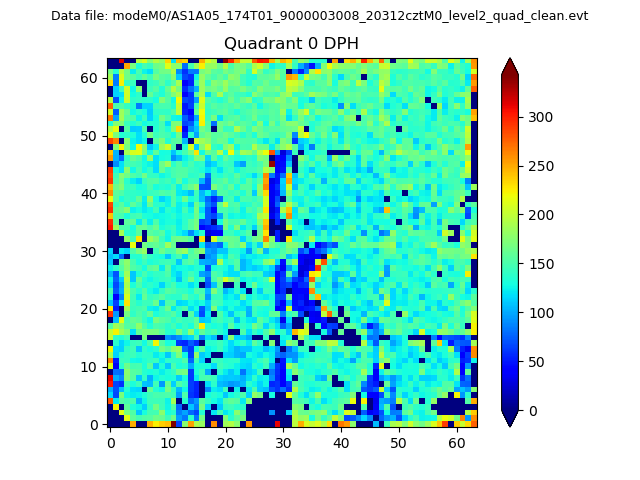 |
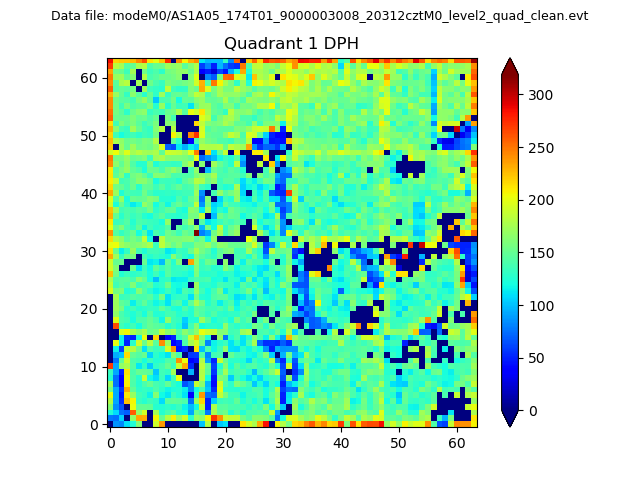 |
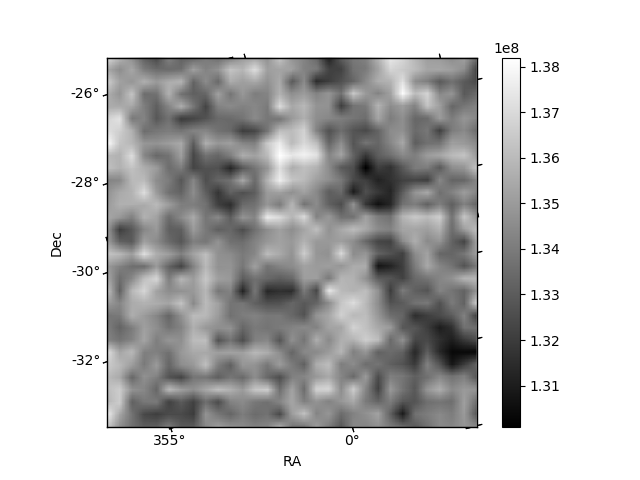
Quadrant B |
|---|---|---|---|
| Quadrant D | 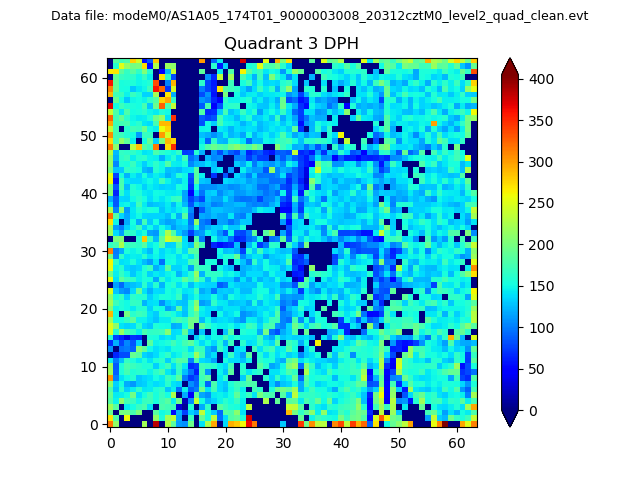 |
 |
Quadrant C |
| Plot type | Count rate plots | Images |
|---|---|---|
| Comparison with Poisson distribution Blue bars denote a histogram of data divided into 1 sec bins. Red curve is a Poisson curve with rate = median count rate of data. |
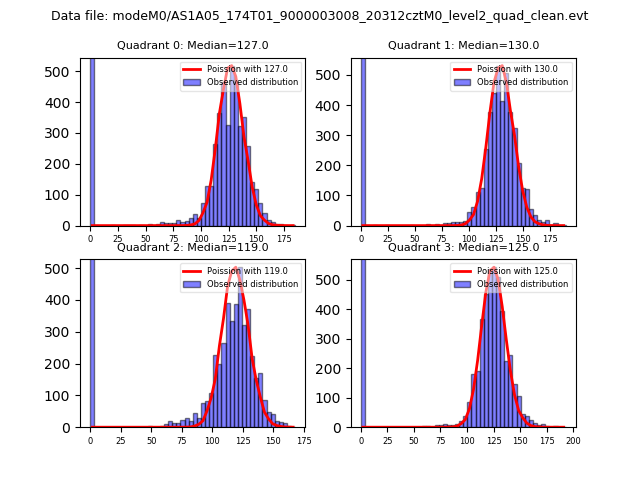 |
 |
| Quadrant-wise count rates Data is divided into 100 sec bins |
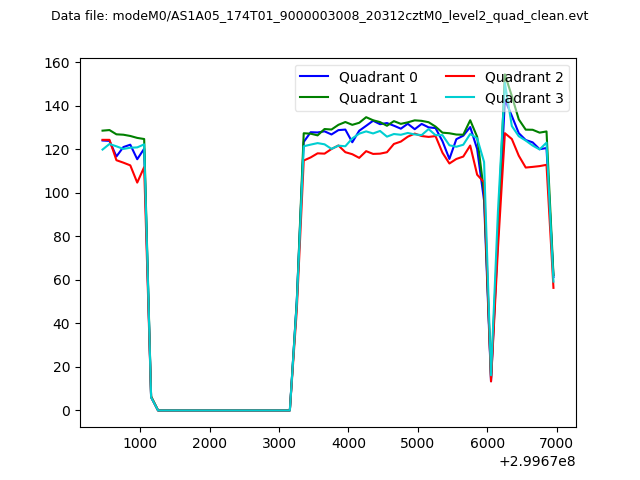 |
|
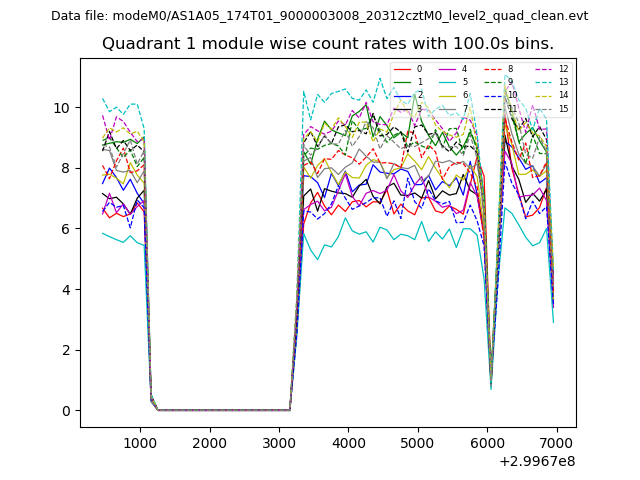
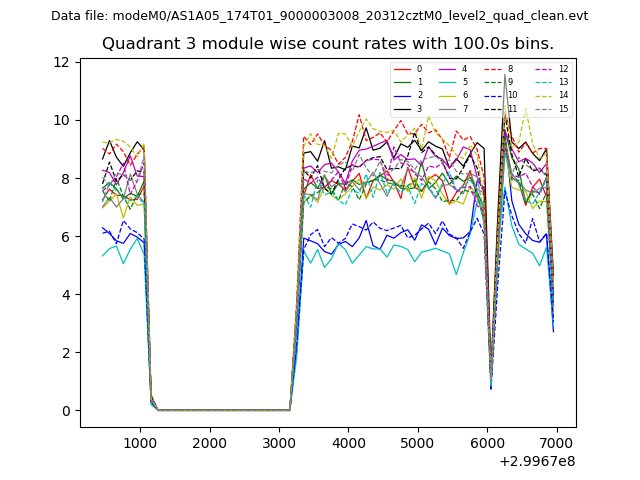
| Module-wise count rates for Quadrant A Data is divided into 100 sec bins |
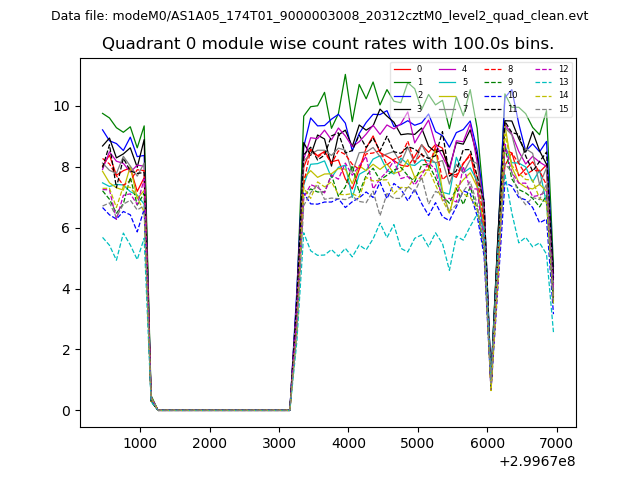 |
 |
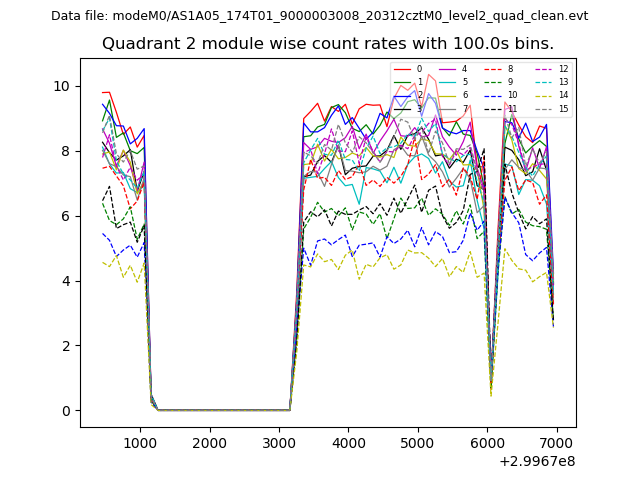
| Module-wise count rates for Quadrant B Data is divided into 100 sec bins |
 |
 |
| Module-wise count rates for Quadrant C Data is divided into 100 sec bins |
 |
 |
| Module-wise count rates for Quadrant D Data is divided into 100 sec bins |
 |
 |
| Parameter | Plot |
|---|---|
| CZT HV Monitor | 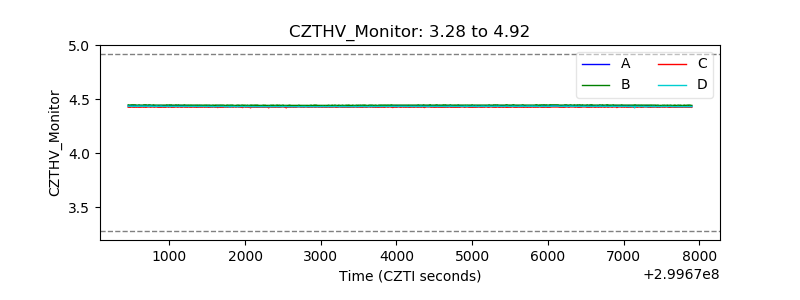 |
| D_VDD | 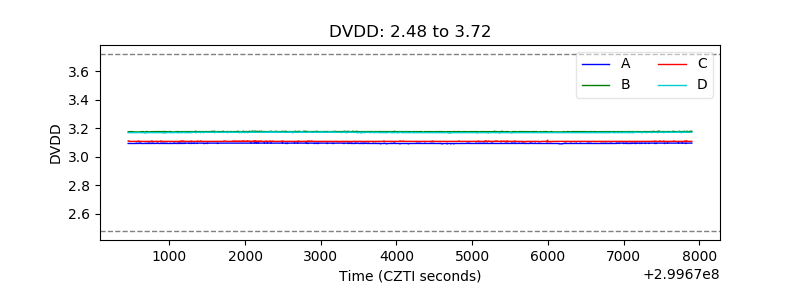 |
| Temperature 1 | 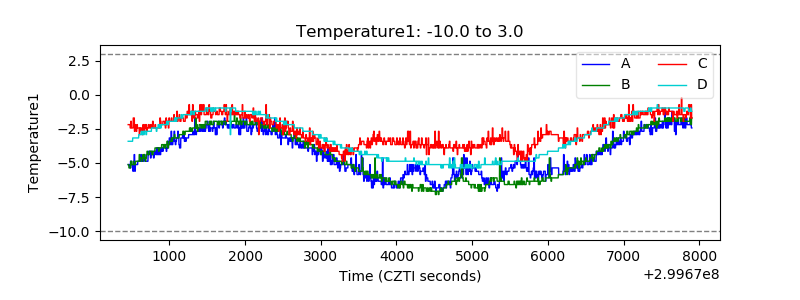 |
| Veto HV Monitor | 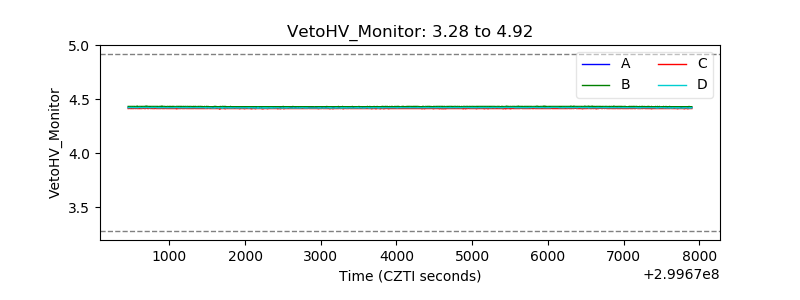 |
| Veto LLD | 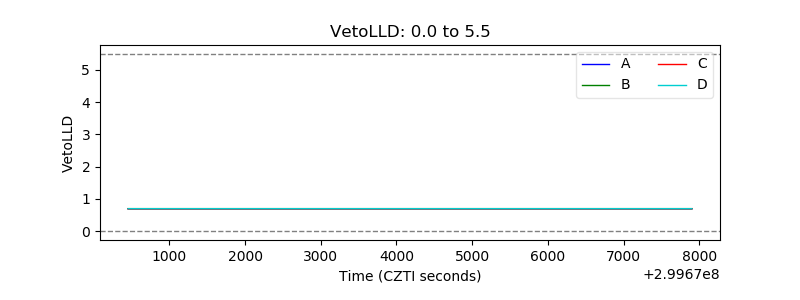 |
| Alpha Counter | 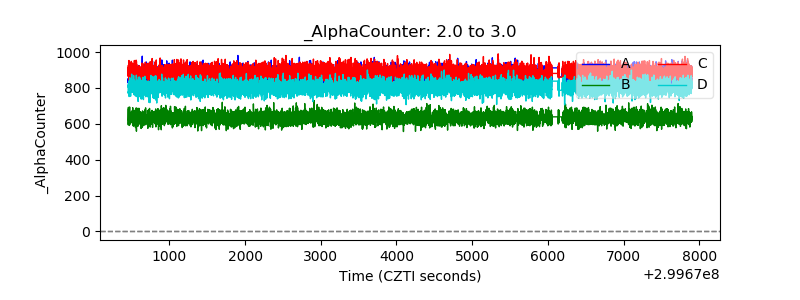 |
| _CPM_Rate | 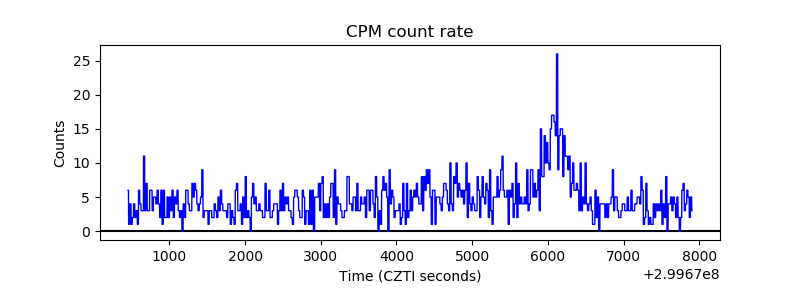 |
| CZT Counter | 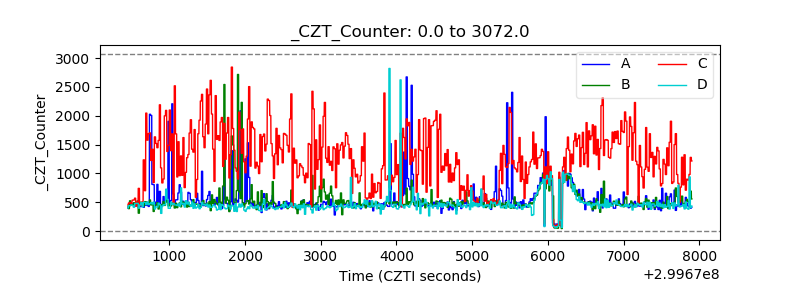 |
| +2.5 Volts monitor |  |
| +5 Volts monitor | 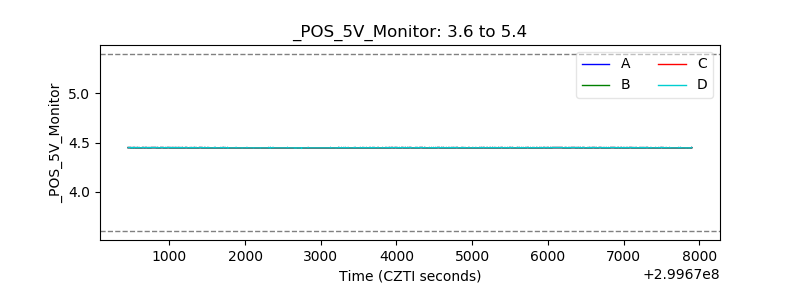 |
| _ROLL_ROT | 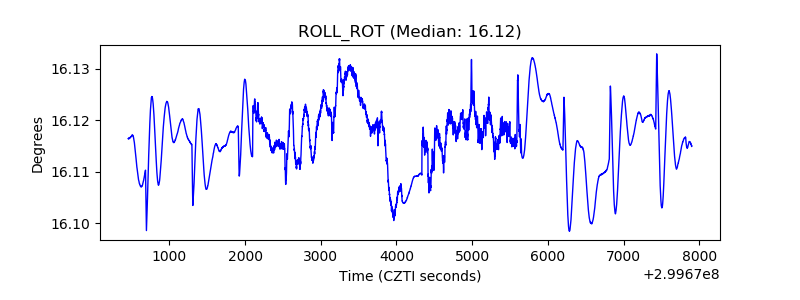 |
| _Roll_DEC | 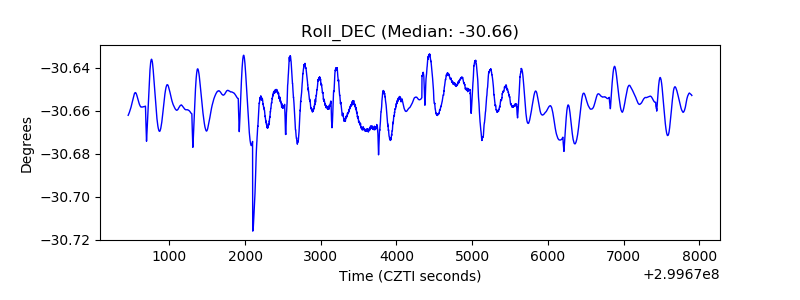 |
| _Roll_RA | 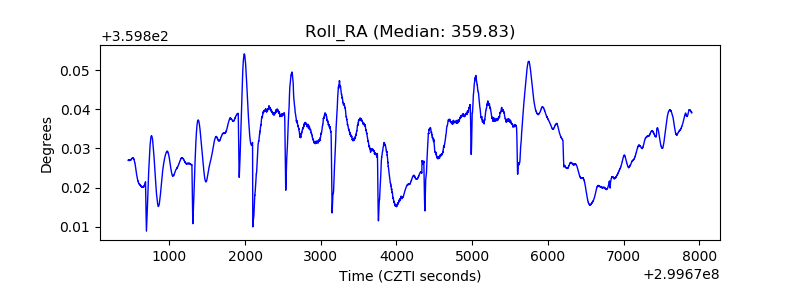 |
| Veto Counter | 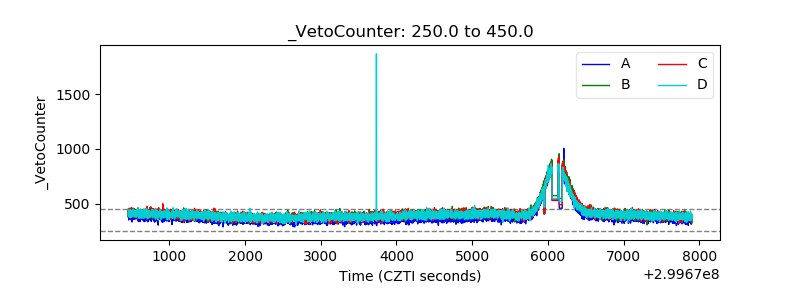 |