| Param | Original file | Final file |
|---|---|---|
| Filename | modeM0/AS1A05_174T01_9000003008_20316cztM0_level2.evt | modeM0/AS1A05_174T01_9000003008_20316cztM0_level2_quad_clean.evt |
| Size (bytes) | 1,508,261,760 | 228,470,400 |
| Size | 1.4 GB | 217.9 MB |
| Events in quadrant A | 8,754,778 | 1,443,957 |
| Events in quadrant B | 9,423,341 | 1,458,612 |
| Events in quadrant C | 15,669,709 | 1,360,729 |
| Events in quadrant D | 10,589,064 | 1,387,914 |
| Mode M9 | |||
|---|---|---|---|
| Quadrant | BADHDUFLAG | Total packets | Discarded packets |
| A | 0 | 21 | 0 |
| B | 0 | 22 | 0 |
| C | 0 | 22 | 0 |
| D | 0 | 22 | 0 |
| Mode M0 | |||
|---|---|---|---|
| Quadrant | BADHDUFLAG | Total packets | Discarded packets |
| A | 0 | 38009 | 4 |
| B | 0 | 39890 | 4 |
| C | 0 | 59294 | 4 |
| D | 0 | 44254 | 4 |
| Mode SS | |||
|---|---|---|---|
| Quadrant | BADHDUFLAG | Total packets | Discarded packets |
| A | 0 | 372 | 0 |
| B | 0 | 372 | 0 |
| C | 0 | 372 | 0 |
| D | 0 | 372 | 0 |
| Quadrant | Total seconds | Saturated seconds | Saturation percentage |
|---|---|---|---|
| A | 18411 | 260 | 1.412199% |
| B | 18411 | 264 | 1.433925% |
| C | 18410 | 1102 | 5.985877% |
| D | 18410 | 263 | 1.428571% |
Noise dominated data is calculated using 1-second bins in cleaned event files. If a bin has >2000 counts, and if more than 50% of those come from <1% of pixels, then it is considered to be noise-dominated and hence unusable.
| Quadrant | # 1 sec bins | Bins with >0 counts | Bins with >2000 counts | High rate bins dominated by noise | Noise dominated (total time) | Noise dominated (detector-on time) | Marked lightcurve |
|---|---|---|---|---|---|---|---|
| A | 20446 | 18413 | 2 | 2 | 0.01% | 0.01% | 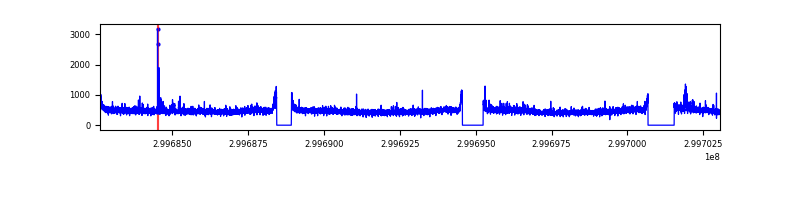 |
| B | 20446 | 18414 | 22 | 22 | 0.11% | 0.12% | 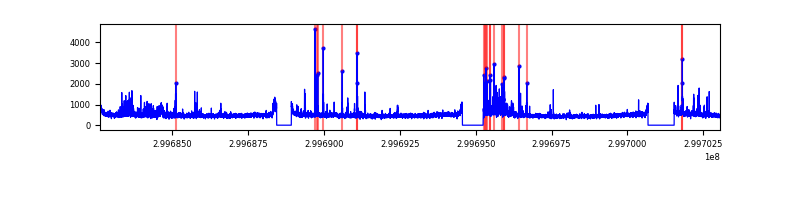 |
| C | 20445 | 18412 | 493 | 493 | 2.41% | 2.68% | 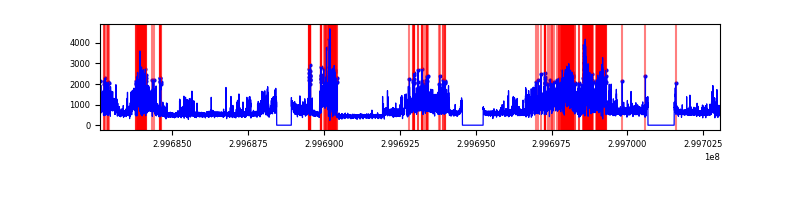 |
| D | 20445 | 18413 | 120 | 120 | 0.59% | 0.65% | 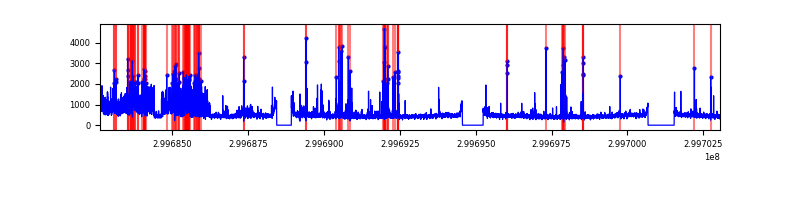 |
Top three noisy pixels from each quadrant. If the there are fewer than three noisy pixels in the level2.evt file, extra rows are filled as -1
| Pixel properties | Quadrant properties | ||||||
|---|---|---|---|---|---|---|---|
| Quadrant | DetID | PixID | Counts | Sigma | Mean | Median | Sigma |
| A | 14 | 111 | 65186 | 141.21 | 2211 | 2157 | 446.3 |
| A | 14 | 238 | 55098 | 118.61 | 2211 | 2157 | 446.3 |
| A | 10 | 253 | 52051 | 111.79 | 2211 | 2157 | 446.3 |
| B | 0 | 197 | 231252 | 547.92 | 2195 | 2137 | 418.2 |
| B | 7 | 220 | 182204 | 430.63 | 2195 | 2137 | 418.2 |
| B | 4 | 142 | 125731 | 295.57 | 2195 | 2137 | 418.2 |
| C | 3 | 9 | 7146798 | 14583.27 | 2099 | 2110 | 489.9 |
| C | 14 | 238 | 323351 | 655.7 | 2099 | 2110 | 489.9 |
| C | 3 | 233 | 18432 | 33.32 | 2099 | 2110 | 489.9 |
| D | 5 | 222 | 1591830 | 3039.81 | 2159 | 2097 | 523.0 |
| D | 1 | 52 | 463194 | 881.69 | 2159 | 2097 | 523.0 |
| D | 9 | 1 | 215951 | 408.92 | 2159 | 2097 | 523.0 |
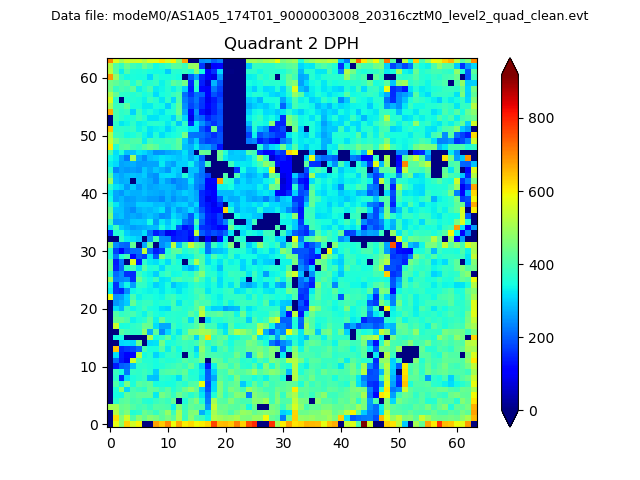
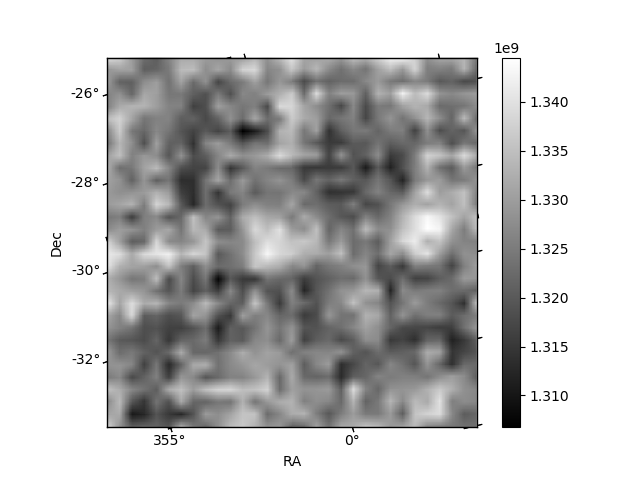
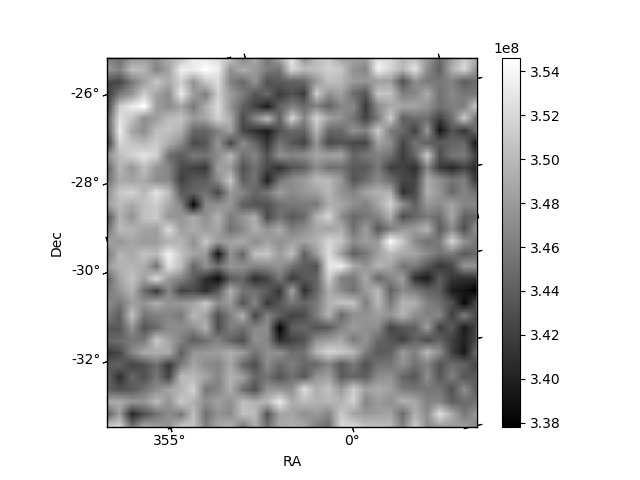
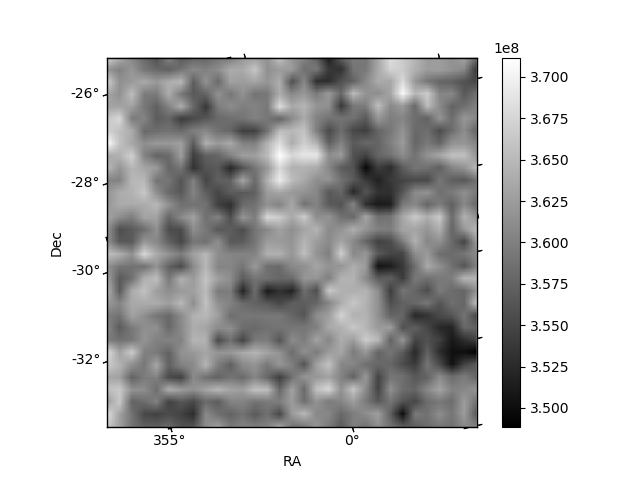
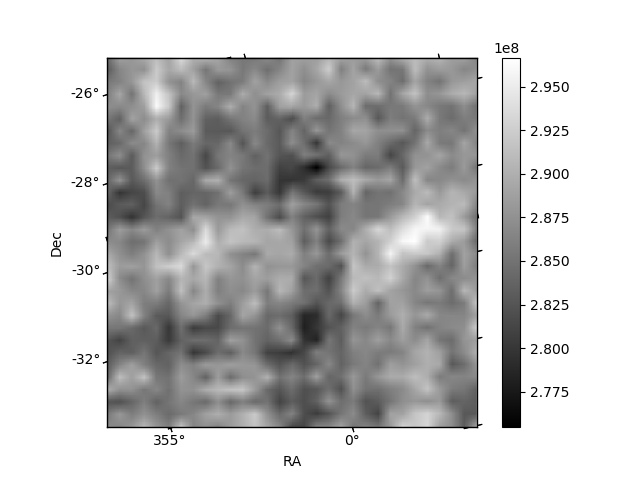
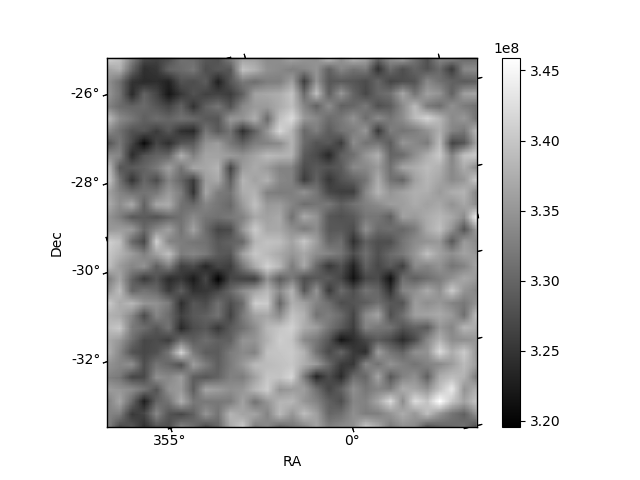
Histogram calculated using DETX and DETY for each event in the final _common_clean file
| Quadrant A | 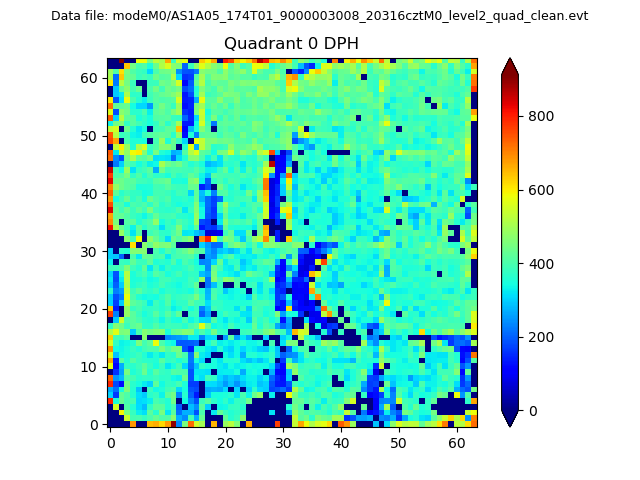 |
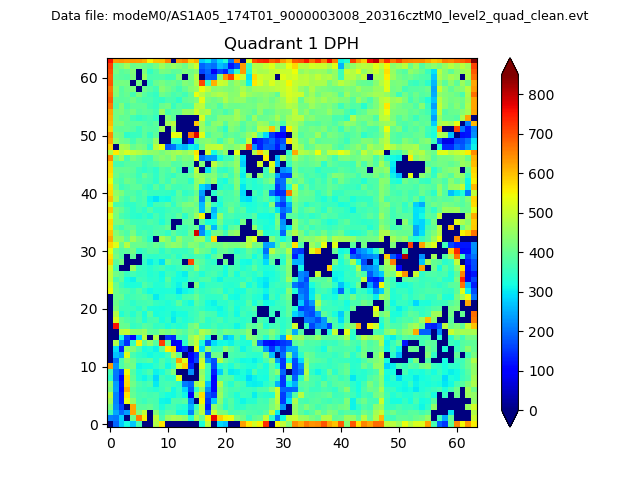 |
Quadrant B |
|---|---|---|---|
| Quadrant D | 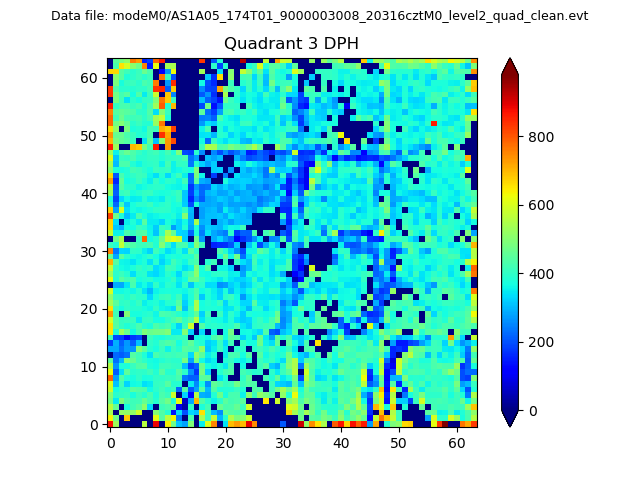 |
 |
Quadrant C |
| Plot type | Count rate plots | Images |
|---|---|---|
| Comparison with Poisson distribution Blue bars denote a histogram of data divided into 1 sec bins. Red curve is a Poisson curve with rate = median count rate of data. |
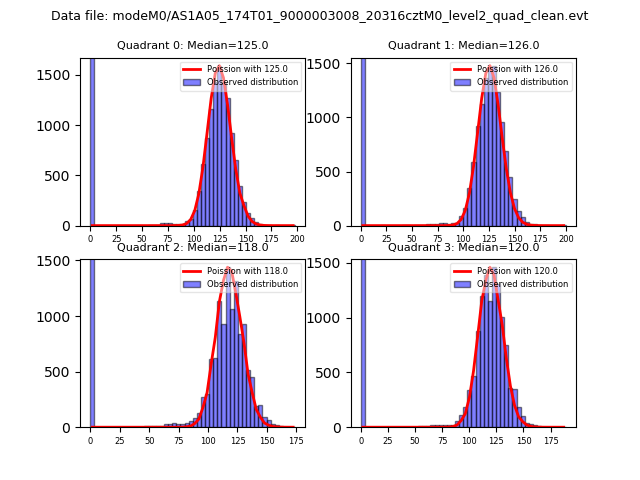 |
 |
| Quadrant-wise count rates Data is divided into 100 sec bins |
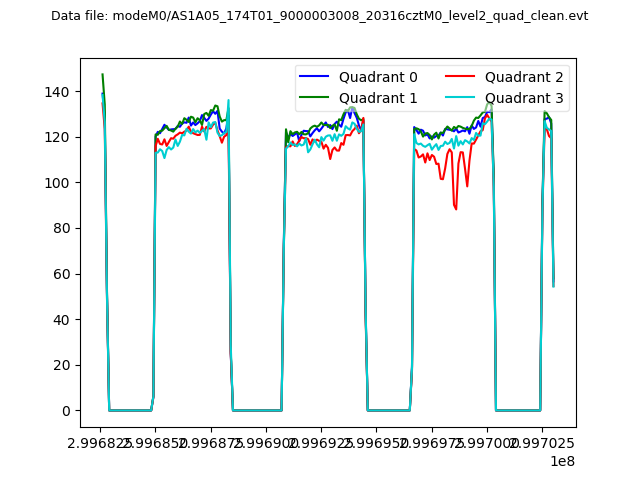 |
|
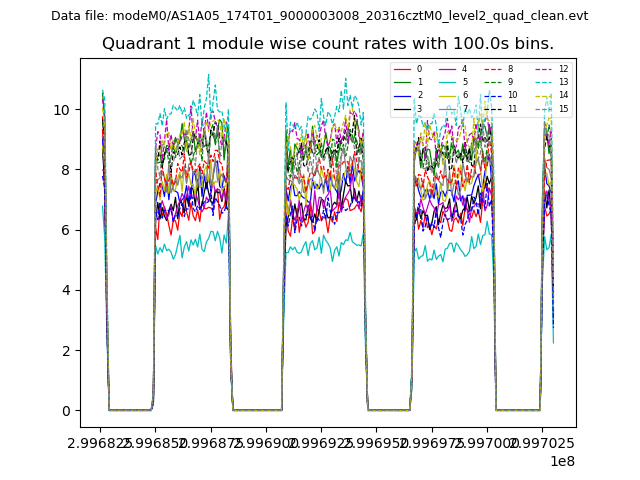
| Module-wise count rates for Quadrant A Data is divided into 100 sec bins |
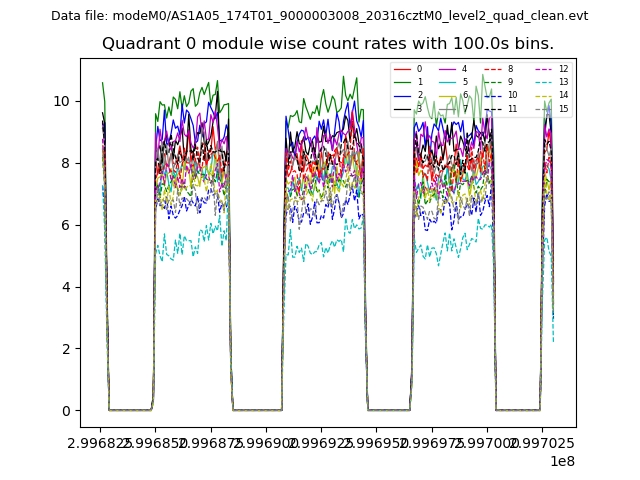 |
 |
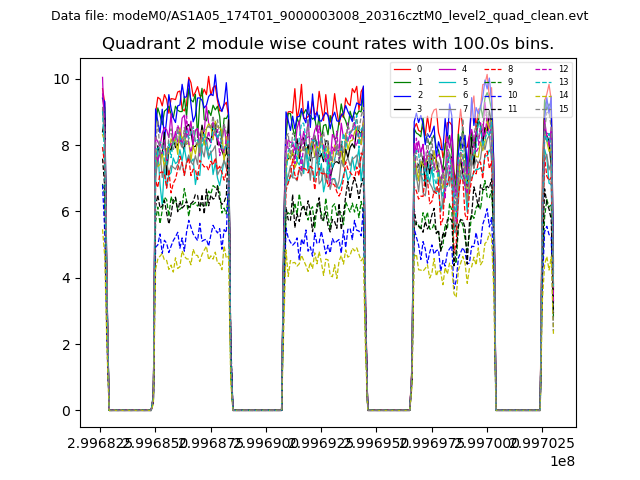
| Module-wise count rates for Quadrant B Data is divided into 100 sec bins |
 |
 |
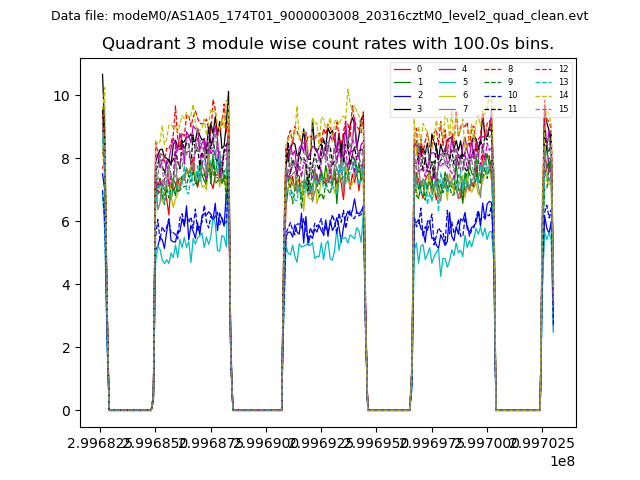
| Module-wise count rates for Quadrant C Data is divided into 100 sec bins |
 |
 |
| Module-wise count rates for Quadrant D Data is divided into 100 sec bins |
 |
 |
| Parameter | Plot |
|---|---|
| CZT HV Monitor | 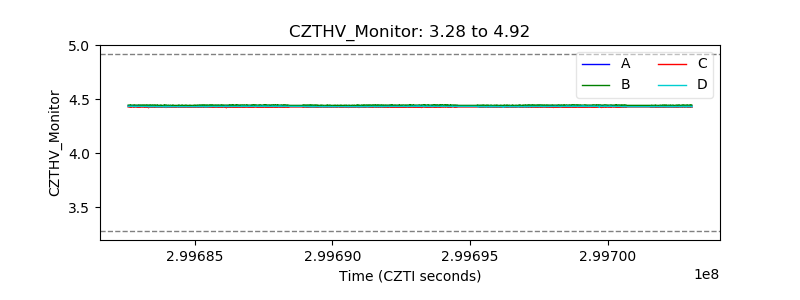 |
| D_VDD | 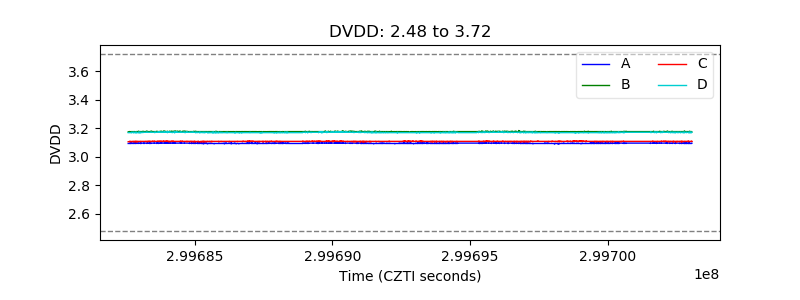 |
| Temperature 1 | 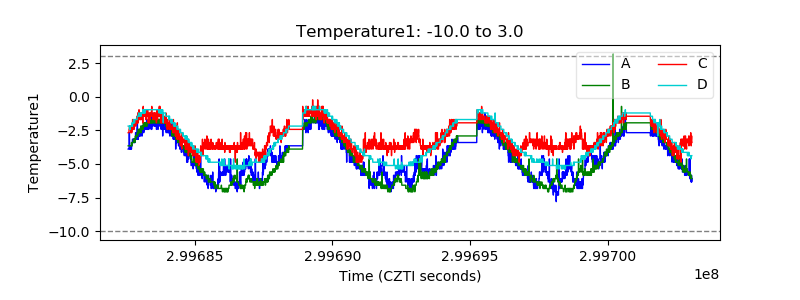 |
| Veto HV Monitor | 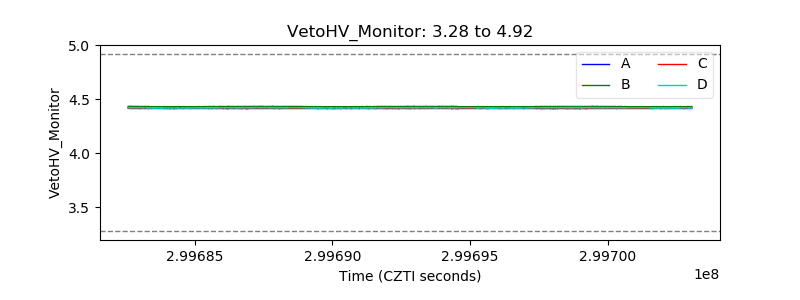 |
| Veto LLD | 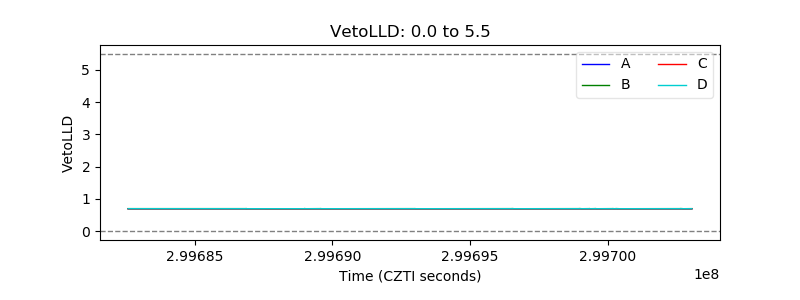 |
| Alpha Counter | 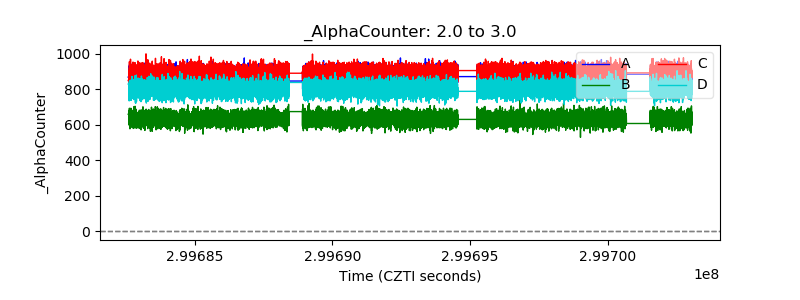 |
| _CPM_Rate | 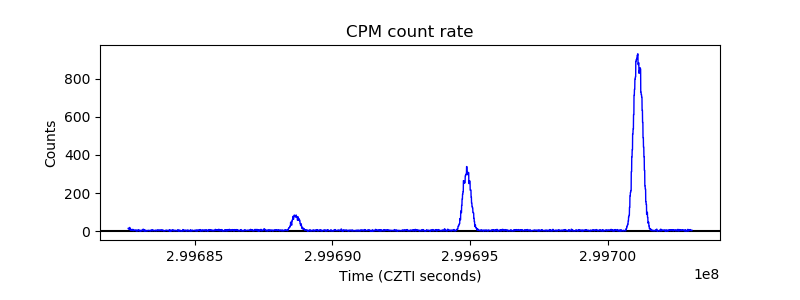 |
| CZT Counter | 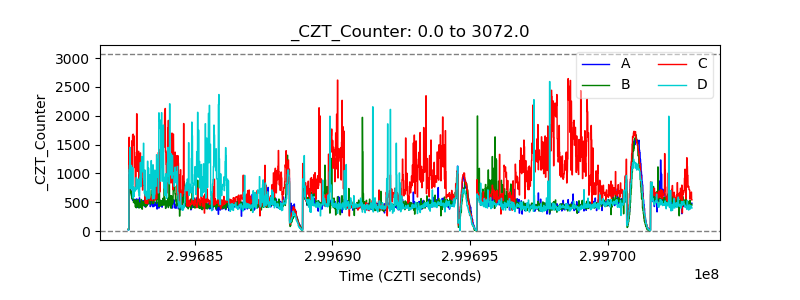 |
| +2.5 Volts monitor |  |
| +5 Volts monitor |  |
| _ROLL_ROT | 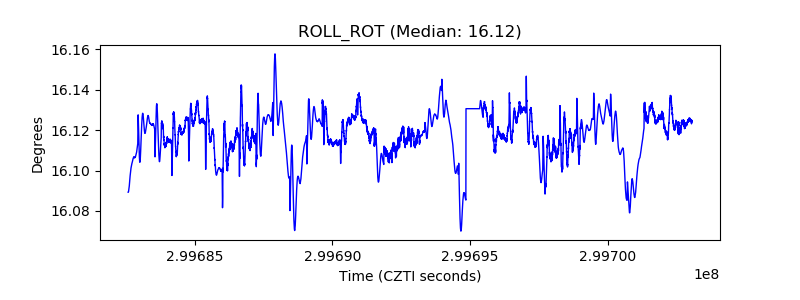 |
| _Roll_DEC | 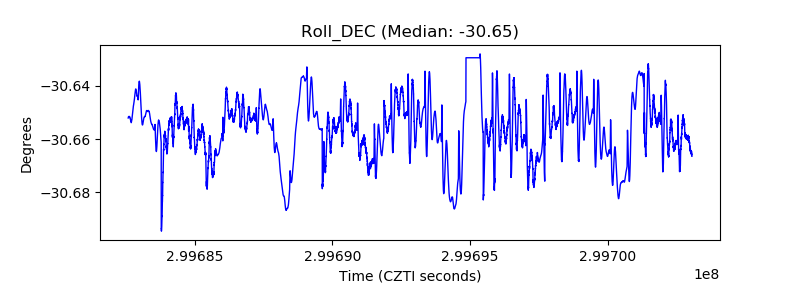 |
| _Roll_RA | 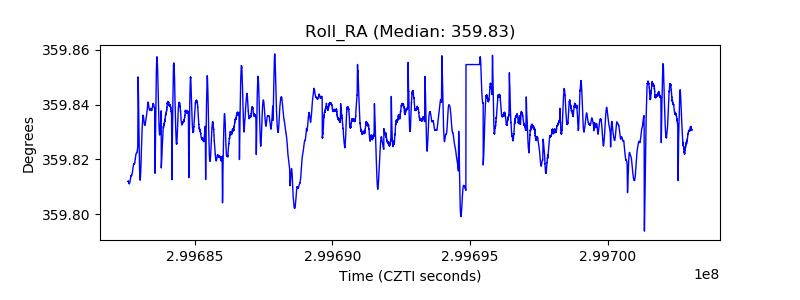 |
| Veto Counter | 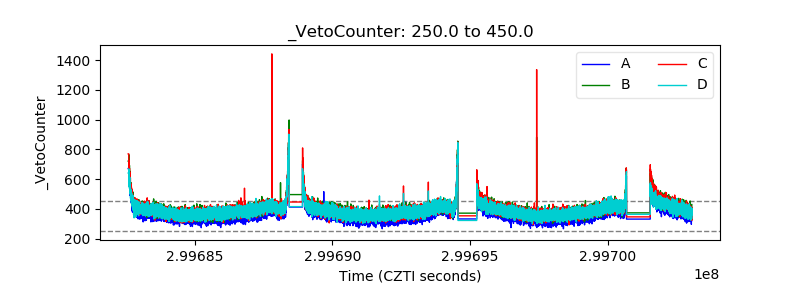 |