| Param | Original file | Final file |
|---|---|---|
| Filename | modeM0/AS1A05_174T01_9000003008_20317cztM0_level2.evt | modeM0/AS1A05_174T01_9000003008_20317cztM0_level2_quad_clean.evt |
| Size (bytes) | 498,977,280 | 93,556,800 |
| Size | 475.9 MB | 89.2 MB |
| Events in quadrant A | 3,475,934 | 592,356 |
| Events in quadrant B | 3,630,994 | 598,467 |
| Events in quadrant C | 4,105,042 | 573,921 |
| Events in quadrant D | 3,416,407 | 572,974 |
| Mode M9 | |||
|---|---|---|---|
| Quadrant | BADHDUFLAG | Total packets | Discarded packets |
| A | 0 | 19 | 0 |
| B | 0 | 19 | 0 |
| C | 0 | 19 | 0 |
| D | 0 | 19 | 0 |
| Mode M0 | |||
|---|---|---|---|
| Quadrant | BADHDUFLAG | Total packets | Discarded packets |
| A | 0 | 14967 | 2 |
| B | 0 | 15288 | 2 |
| C | 0 | 17006 | 2 |
| D | 0 | 14922 | 2 |
| Mode SS | |||
|---|---|---|---|
| Quadrant | BADHDUFLAG | Total packets | Discarded packets |
| A | 0 | 146 | 0 |
| B | 0 | 146 | 0 |
| C | 0 | 146 | 0 |
| D | 0 | 146 | 0 |
| Quadrant | Total seconds | Saturated seconds | Saturation percentage |
|---|---|---|---|
| A | 7115 | 136 | 1.911455% |
| B | 7116 | 84 | 1.180438% |
| C | 7116 | 116 | 1.630129% |
| D | 7116 | 37 | 0.519955% |
Noise dominated data is calculated using 1-second bins in cleaned event files. If a bin has >2000 counts, and if more than 50% of those come from <1% of pixels, then it is considered to be noise-dominated and hence unusable.
| Quadrant | # 1 sec bins | Bins with >0 counts | Bins with >2000 counts | High rate bins dominated by noise | Noise dominated (total time) | Noise dominated (detector-on time) | Marked lightcurve |
|---|---|---|---|---|---|---|---|
| A | 8980 | 7117 | 0 | 0 | 0.00% | 0.00% | 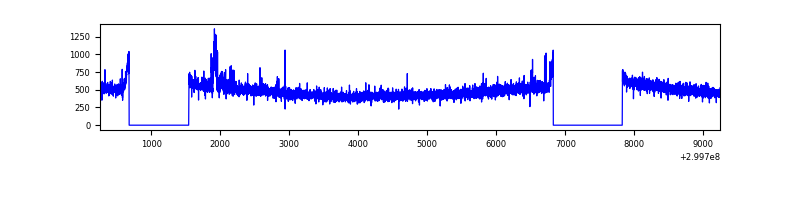 |
| B | 8981 | 7118 | 5 | 5 | 0.06% | 0.07% | 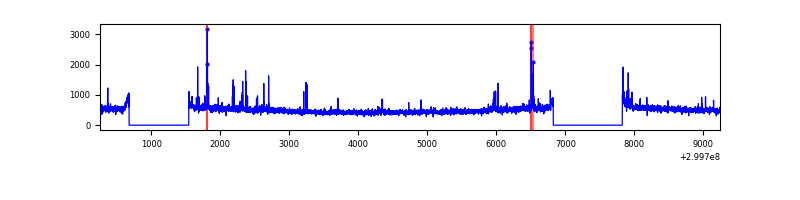 |
| C | 8981 | 7118 | 3 | 3 | 0.03% | 0.04% | 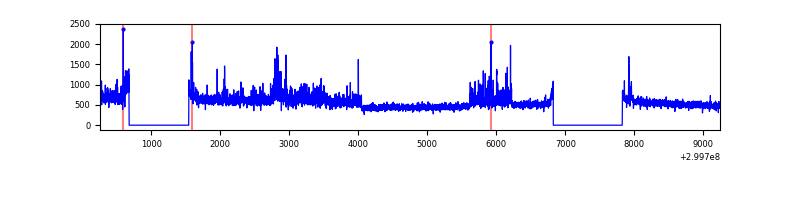 |
| D | 8981 | 7118 | 16 | 16 | 0.18% | 0.22% | 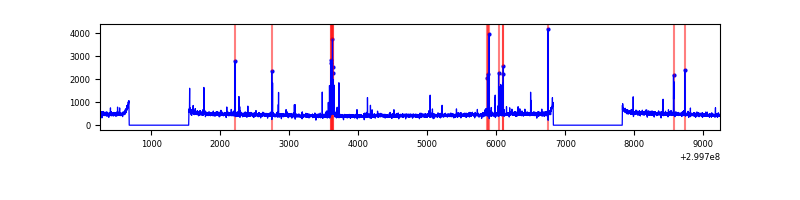 |
Top three noisy pixels from each quadrant. If the there are fewer than three noisy pixels in the level2.evt file, extra rows are filled as -1
| Pixel properties | Quadrant properties | ||||||
|---|---|---|---|---|---|---|---|
| Quadrant | DetID | PixID | Counts | Sigma | Mean | Median | Sigma |
| A | 14 | 111 | 52441 | 289.51 | 877 | 857 | 178.2 |
| A | 14 | 238 | 27669 | 150.48 | 877 | 857 | 178.2 |
| A | 13 | 254 | 11030 | 57.1 | 877 | 857 | 178.2 |
| B | 10 | 247 | 30327 | 175.6 | 875 | 852 | 167.9 |
| B | 4 | 142 | 25317 | 145.75 | 875 | 852 | 167.9 |
| B | 0 | 197 | 22987 | 131.87 | 875 | 852 | 167.9 |
| C | 3 | 9 | 651988 | 3276.09 | 845 | 851 | 198.8 |
| C | 14 | 238 | 132232 | 661.02 | 845 | 851 | 198.8 |
| C | 0 | 207 | 19989 | 96.29 | 845 | 851 | 198.8 |
| D | 9 | 1 | 61444 | 291.51 | 858 | 834 | 207.9 |
| D | 1 | 52 | 50735 | 240.01 | 858 | 834 | 207.9 |
| D | 2 | 184 | 32241 | 151.06 | 858 | 834 | 207.9 |
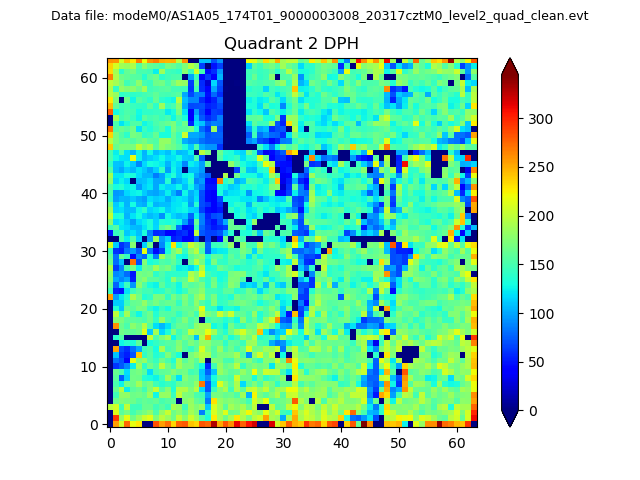
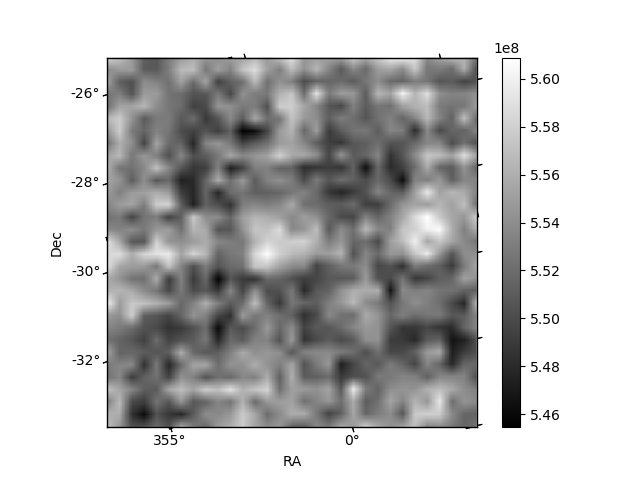
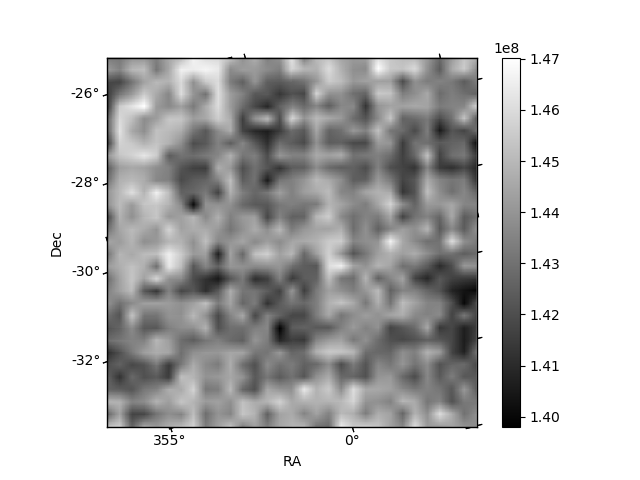
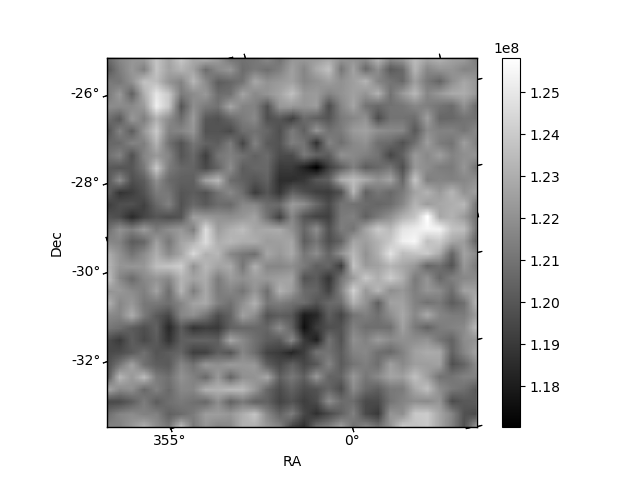
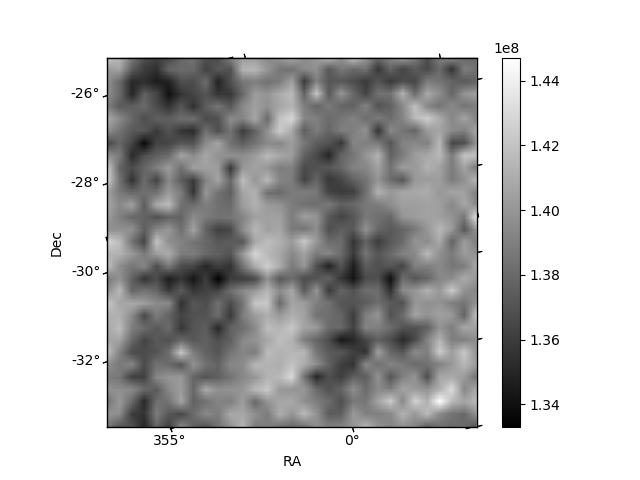
Histogram calculated using DETX and DETY for each event in the final _common_clean file
| Quadrant A | 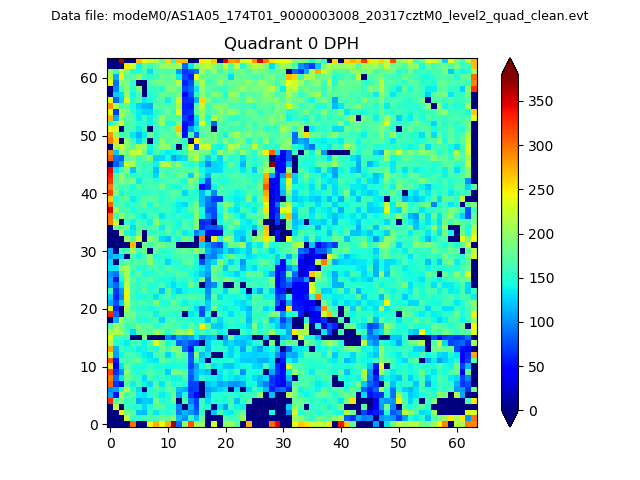 |
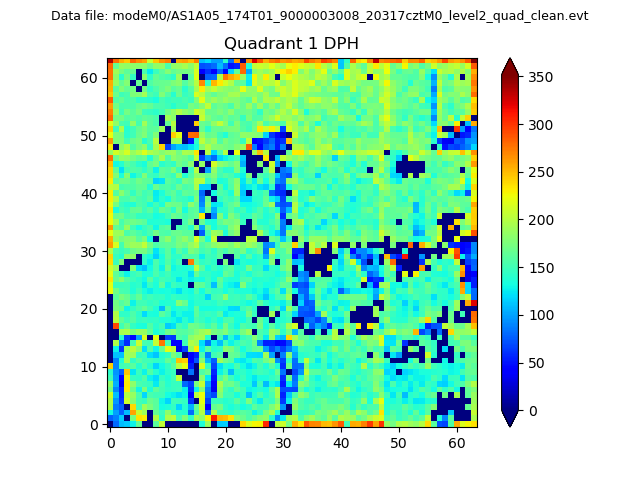 |
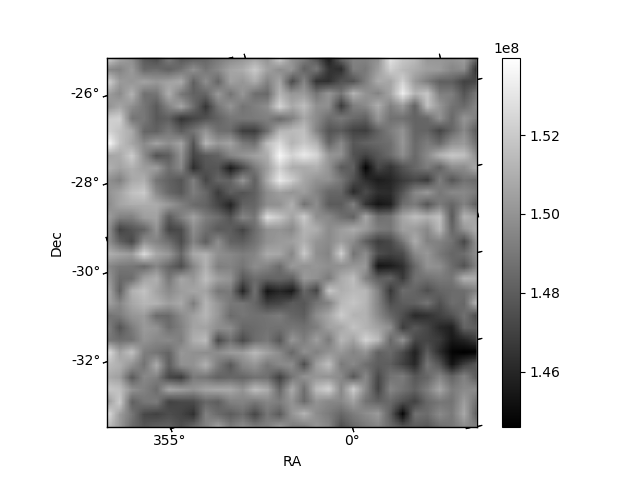
Quadrant B |
|---|---|---|---|
| Quadrant D | 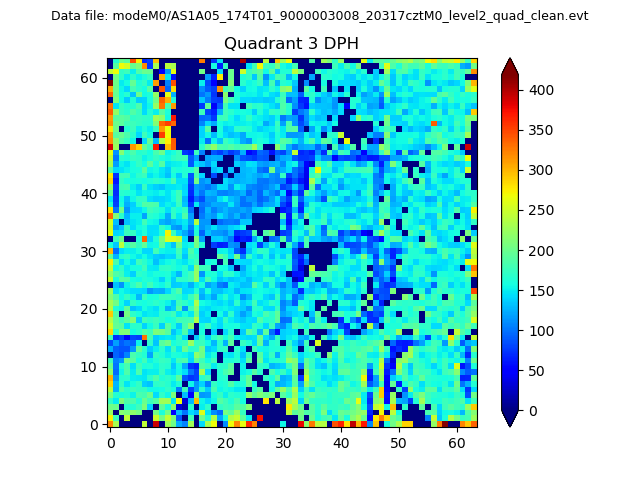 |
 |
Quadrant C |
| Plot type | Count rate plots | Images |
|---|---|---|
| Comparison with Poisson distribution Blue bars denote a histogram of data divided into 1 sec bins. Red curve is a Poisson curve with rate = median count rate of data. |
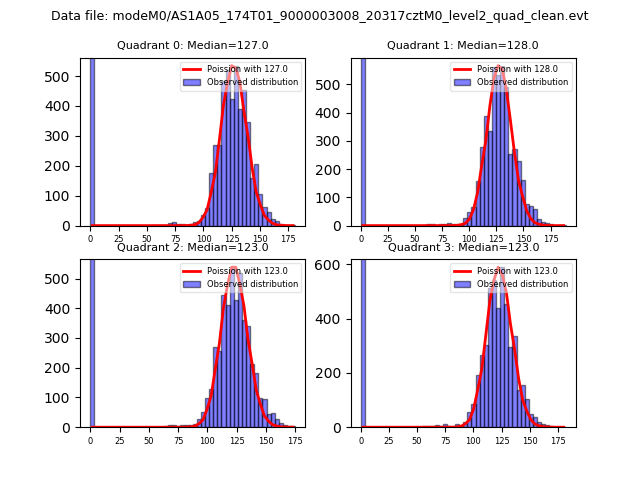 |
 |
| Quadrant-wise count rates Data is divided into 100 sec bins |
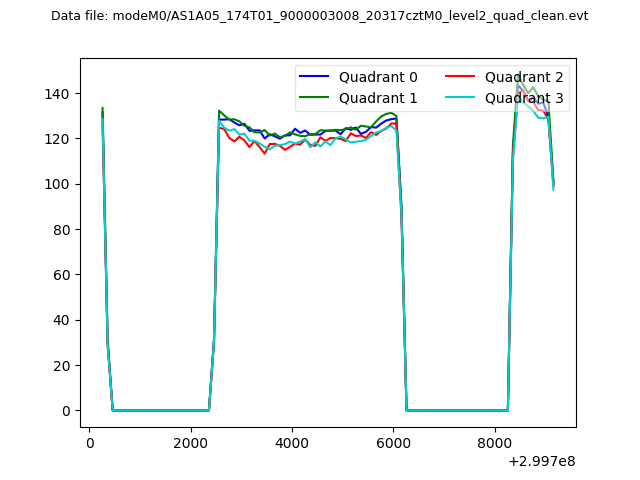 |
|
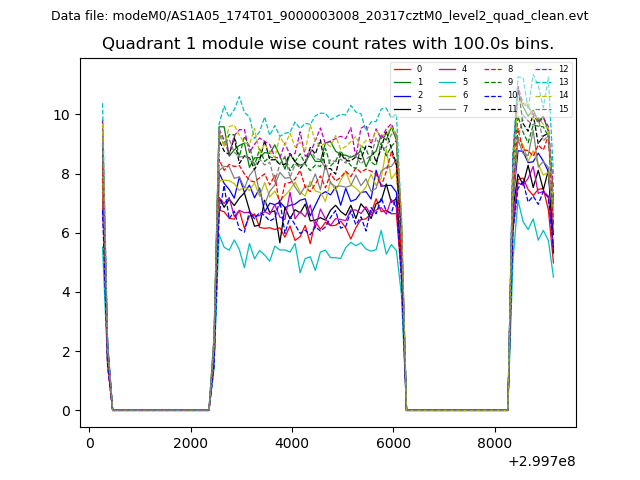
| Module-wise count rates for Quadrant A Data is divided into 100 sec bins |
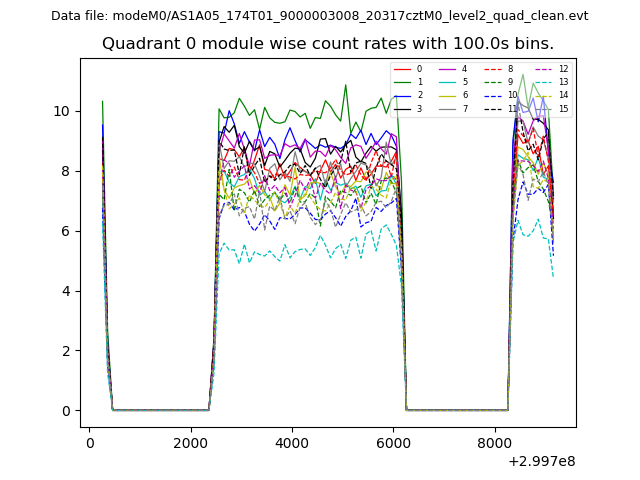 |
 |
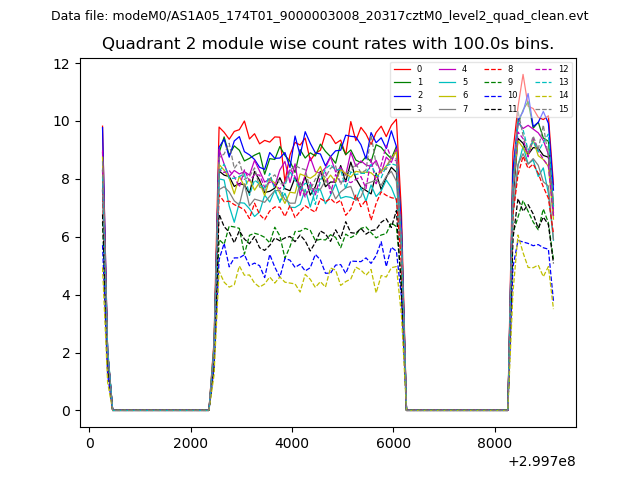
| Module-wise count rates for Quadrant B Data is divided into 100 sec bins |
 |
 |
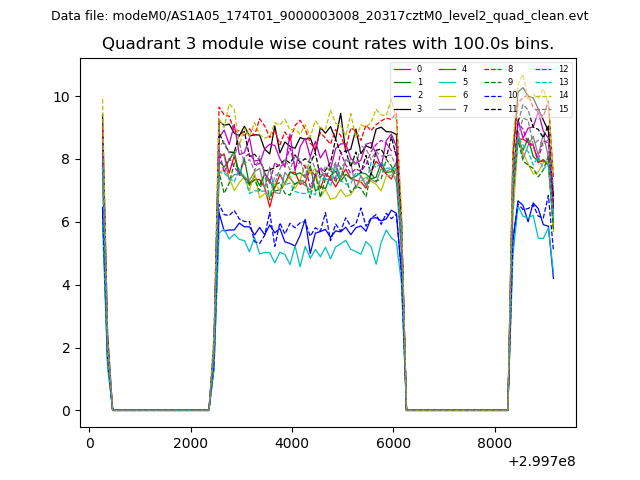
| Module-wise count rates for Quadrant C Data is divided into 100 sec bins |
 |
 |
| Module-wise count rates for Quadrant D Data is divided into 100 sec bins |
 |
 |
| Parameter | Plot |
|---|---|
| CZT HV Monitor | 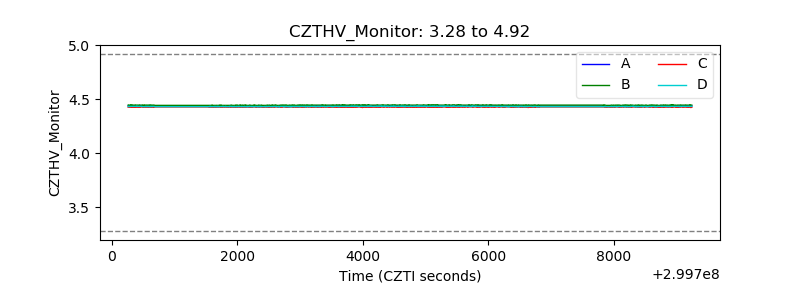 |
| D_VDD | 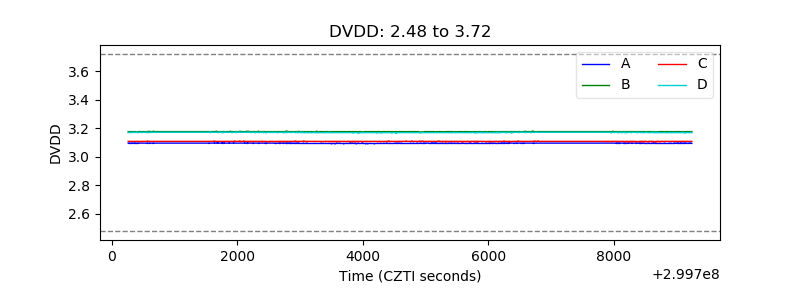 |
| Temperature 1 | 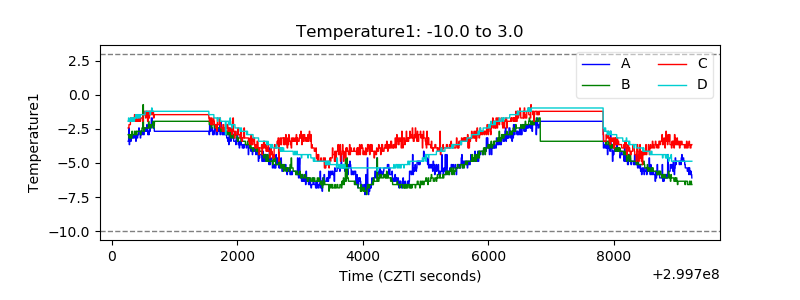 |
| Veto HV Monitor | 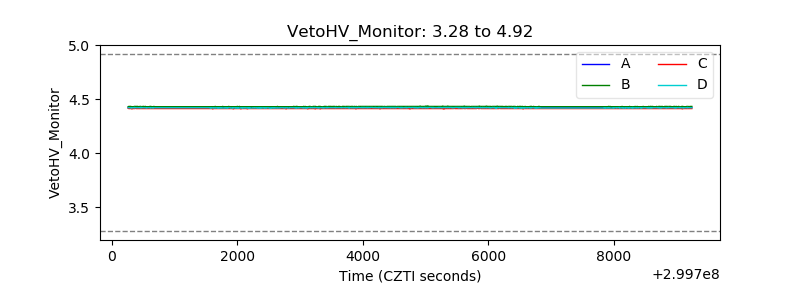 |
| Veto LLD | 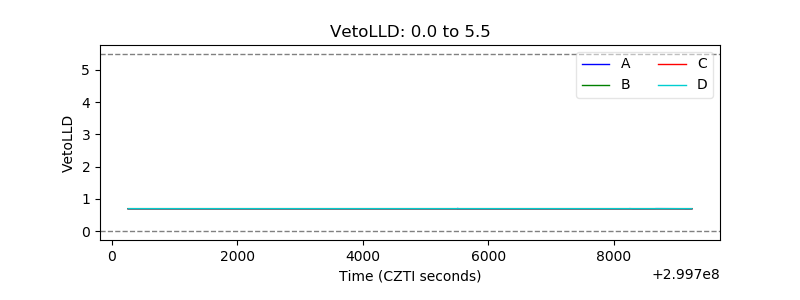 |
| Alpha Counter |  |
| _CPM_Rate | 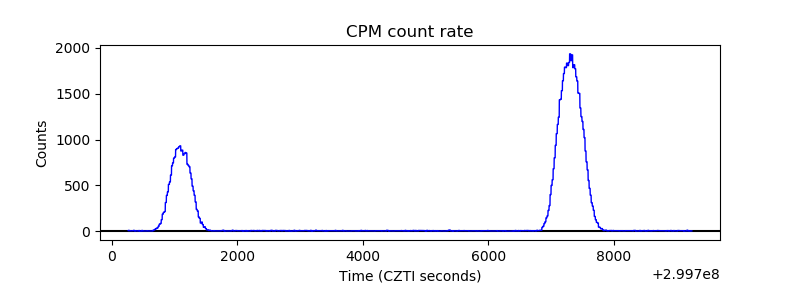 |
| CZT Counter | 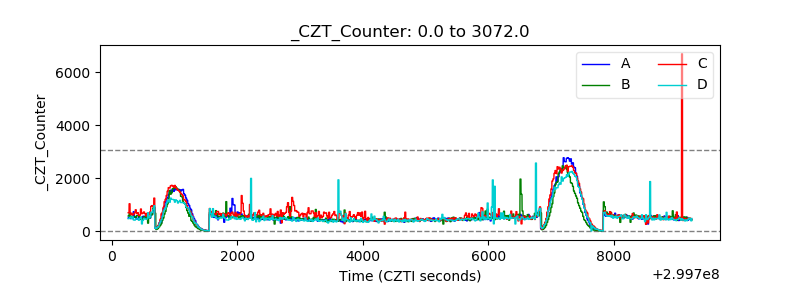 |
| +2.5 Volts monitor |  |
| +5 Volts monitor |  |
| _ROLL_ROT | 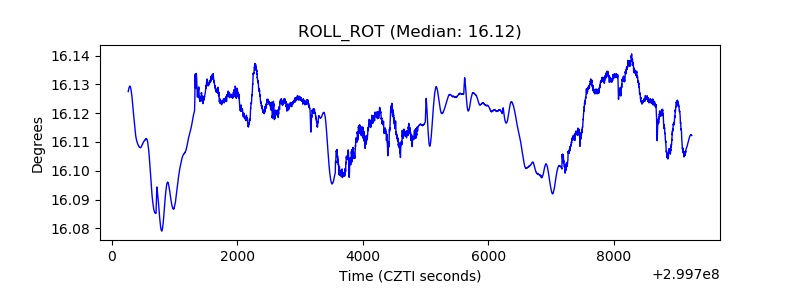 |
| _Roll_DEC | 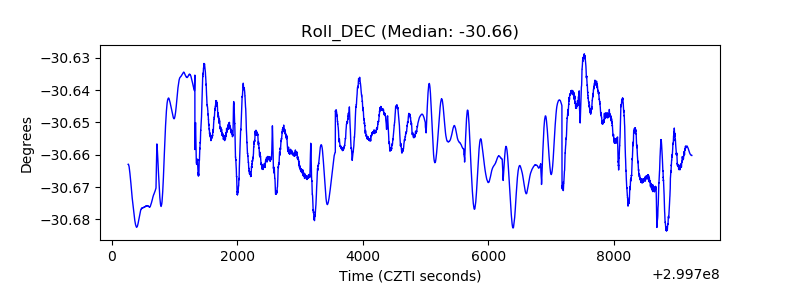 |
| _Roll_RA | 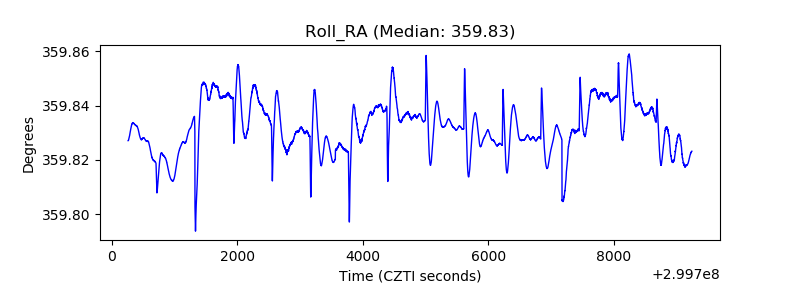 |
| Veto Counter | 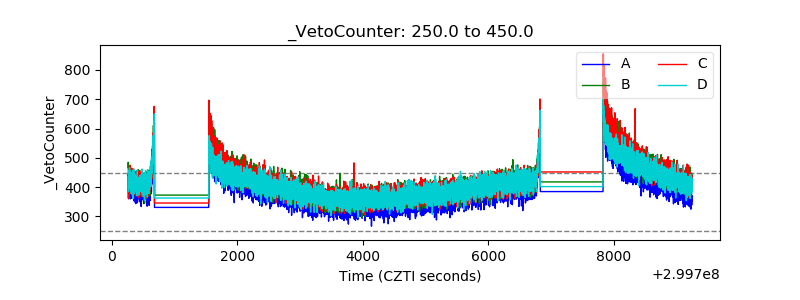 |