| Param | Original file | Final file |
|---|---|---|
| Filename | modeM0/AS1A05_174T01_9000003008_20319cztM0_level2.evt | modeM0/AS1A05_174T01_9000003008_20319cztM0_level2_quad_clean.evt |
| Size (bytes) | 480,251,520 | 101,419,200 |
| Size | 458.0 MB | 96.7 MB |
| Events in quadrant A | 3,421,114 | 651,237 |
| Events in quadrant B | 3,615,762 | 668,043 |
| Events in quadrant C | 3,445,860 | 644,308 |
| Events in quadrant D | 3,594,795 | 628,914 |
| Mode M9 | |||
|---|---|---|---|
| Quadrant | BADHDUFLAG | Total packets | Discarded packets |
| A | 0 | 22 | 0 |
| B | 0 | 22 | 0 |
| C | 0 | 22 | 0 |
| D | 0 | 22 | 0 |
| Mode M0 | |||
|---|---|---|---|
| Quadrant | BADHDUFLAG | Total packets | Discarded packets |
| A | 0 | 14575 | 2 |
| B | 0 | 15115 | 2 |
| C | 0 | 14525 | 3 |
| D | 0 | 15272 | 2 |
| Mode SS | |||
|---|---|---|---|
| Quadrant | BADHDUFLAG | Total packets | Discarded packets |
| A | 0 | 142 | 0 |
| B | 0 | 142 | 0 |
| C | 0 | 142 | 0 |
| D | 0 | 142 | 0 |
| Quadrant | Total seconds | Saturated seconds | Saturation percentage |
|---|---|---|---|
| A | 6873 | 54 | 0.785683% |
| B | 6873 | 117 | 1.702313% |
| C | 6873 | 85 | 1.236723% |
| D | 6873 | 57 | 0.829332% |
Noise dominated data is calculated using 1-second bins in cleaned event files. If a bin has >2000 counts, and if more than 50% of those come from <1% of pixels, then it is considered to be noise-dominated and hence unusable.
| Quadrant | # 1 sec bins | Bins with >0 counts | Bins with >2000 counts | High rate bins dominated by noise | Noise dominated (total time) | Noise dominated (detector-on time) | Marked lightcurve |
|---|---|---|---|---|---|---|---|
| A | 9013 | 6875 | 0 | 0 | 0.00% | 0.00% | 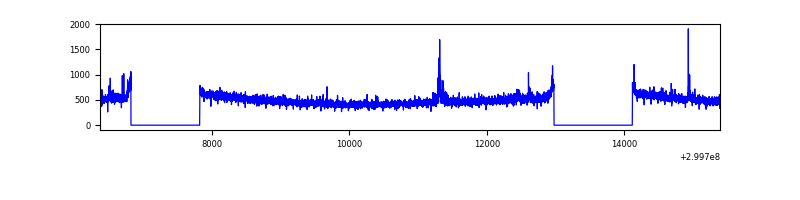 |
| B | 9013 | 6875 | 15 | 15 | 0.17% | 0.22% | 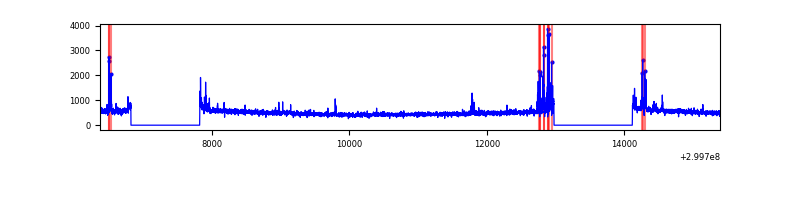 |
| C | 9013 | 6875 | 0 | 0 | 0.00% | 0.00% | 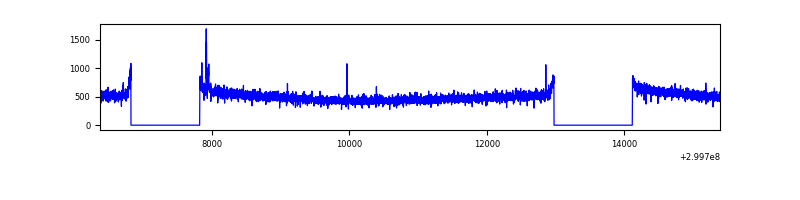 |
| D | 9013 | 6875 | 19 | 19 | 0.21% | 0.28% | 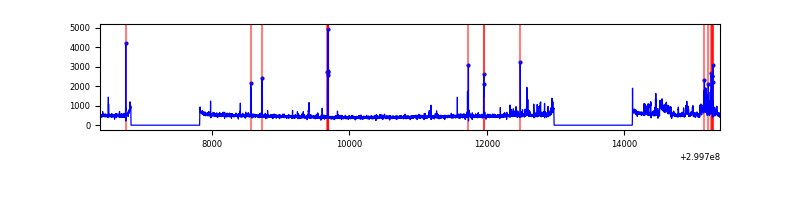 |
Top three noisy pixels from each quadrant. If the there are fewer than three noisy pixels in the level2.evt file, extra rows are filled as -1
| Pixel properties | Quadrant properties | ||||||
|---|---|---|---|---|---|---|---|
| Quadrant | DetID | PixID | Counts | Sigma | Mean | Median | Sigma |
| A | 14 | 238 | 61935 | 350.17 | 866 | 848 | 174.4 |
| A | 13 | 254 | 11231 | 59.52 | 866 | 848 | 174.4 |
| A | 11 | 29 | 9991 | 52.41 | 866 | 848 | 174.4 |
| B | 7 | 220 | 94924 | 570.56 | 867 | 845 | 164.9 |
| B | 0 | 197 | 48698 | 290.21 | 867 | 845 | 164.9 |
| B | 10 | 247 | 28640 | 168.57 | 867 | 845 | 164.9 |
| C | 14 | 238 | 133215 | 672.57 | 843 | 852 | 196.8 |
| C | 0 | 207 | 20490 | 99.79 | 843 | 852 | 196.8 |
| C | 3 | 9 | 6723 | 29.83 | 843 | 852 | 196.8 |
| D | 1 | 52 | 183299 | 892.04 | 850 | 826 | 204.6 |
| D | 9 | 1 | 95166 | 461.19 | 850 | 826 | 204.6 |
| D | 2 | 184 | 78851 | 381.43 | 850 | 826 | 204.6 |
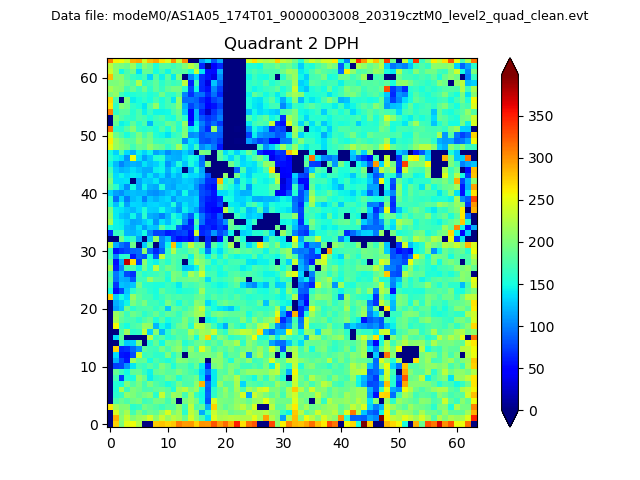
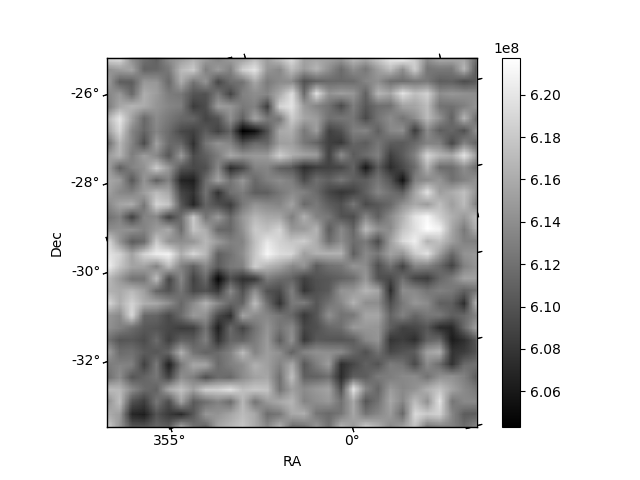
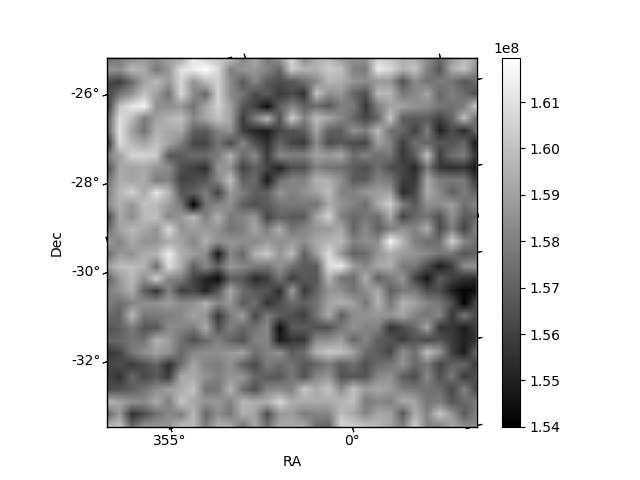
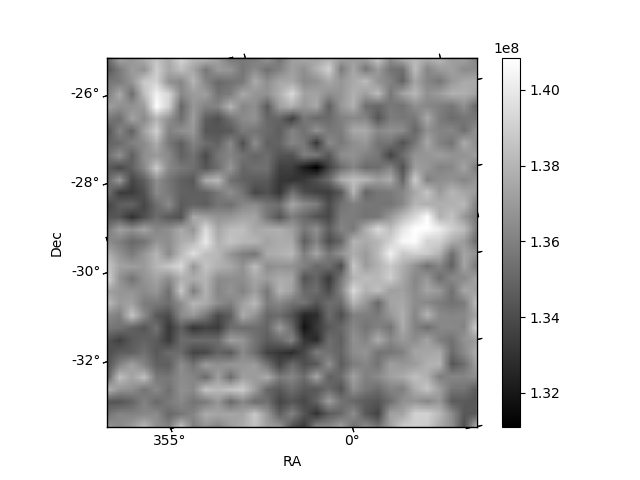
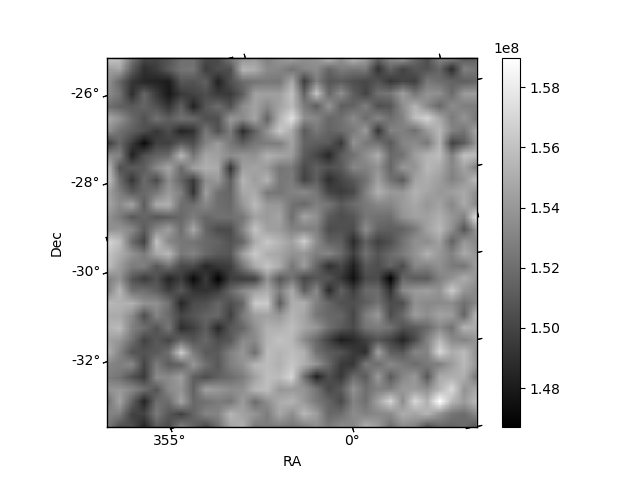
Histogram calculated using DETX and DETY for each event in the final _common_clean file
| Quadrant A | 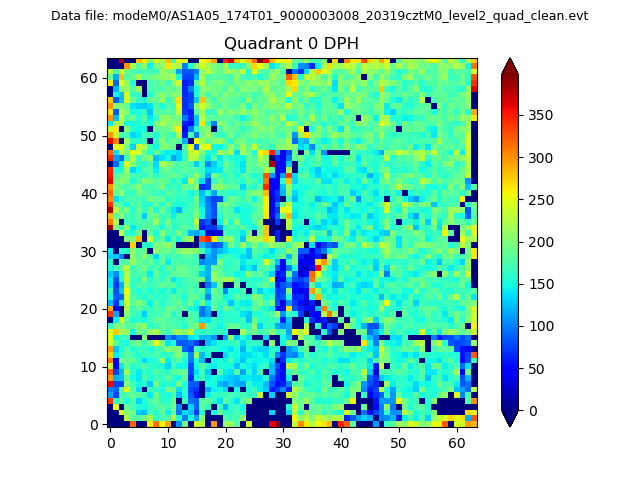 |
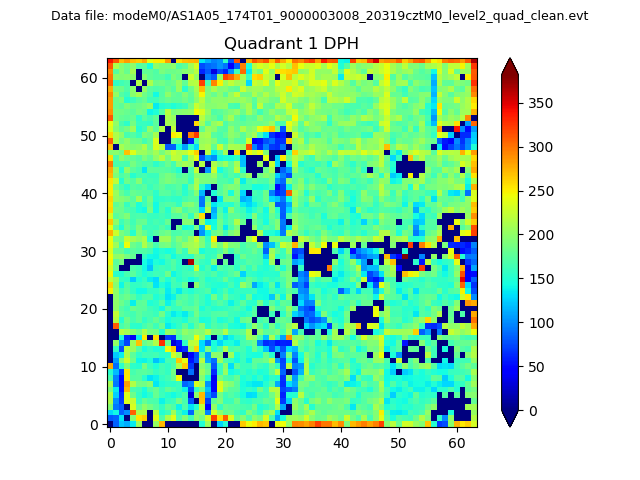 |
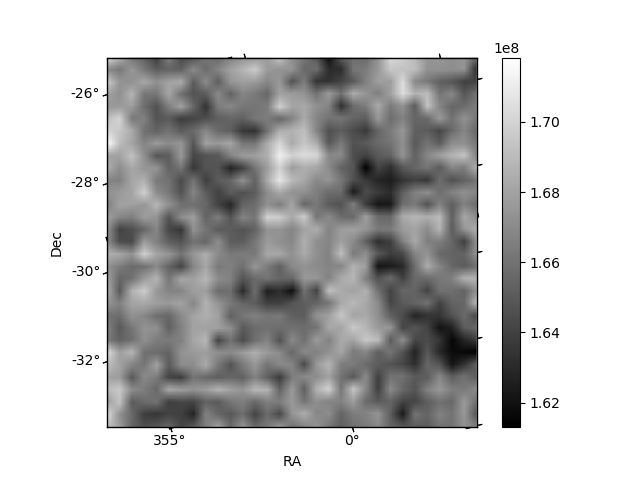
Quadrant B |
|---|---|---|---|
| Quadrant D | 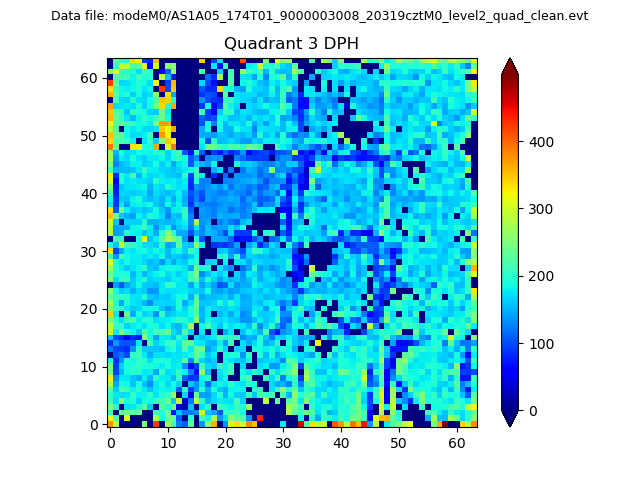 |
 |
Quadrant C |
| Plot type | Count rate plots | Images |
|---|---|---|
| Comparison with Poisson distribution Blue bars denote a histogram of data divided into 1 sec bins. Red curve is a Poisson curve with rate = median count rate of data. |
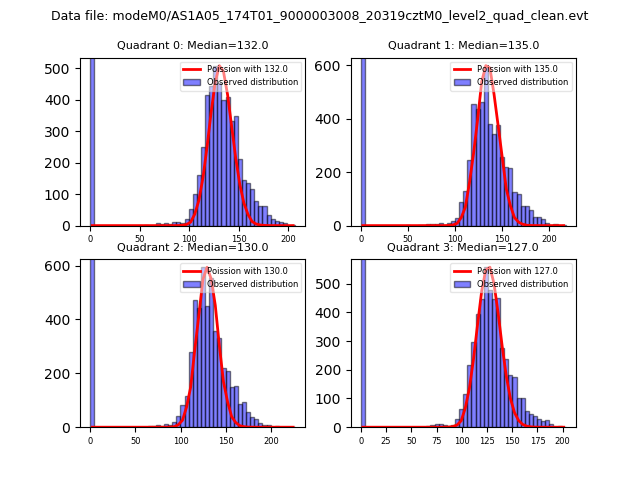 |
 |
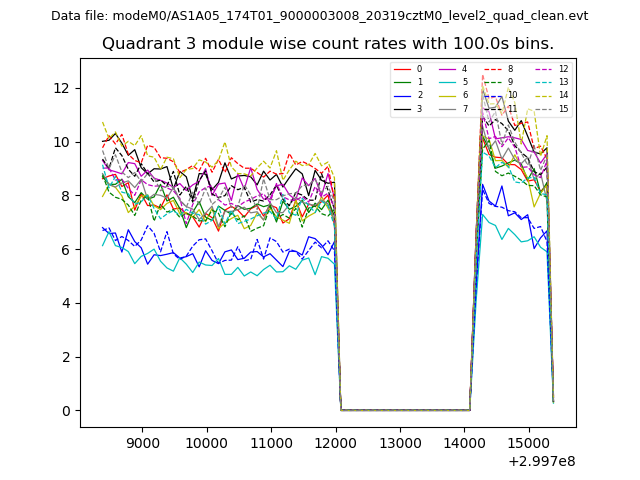
| Quadrant-wise count rates Data is divided into 100 sec bins |
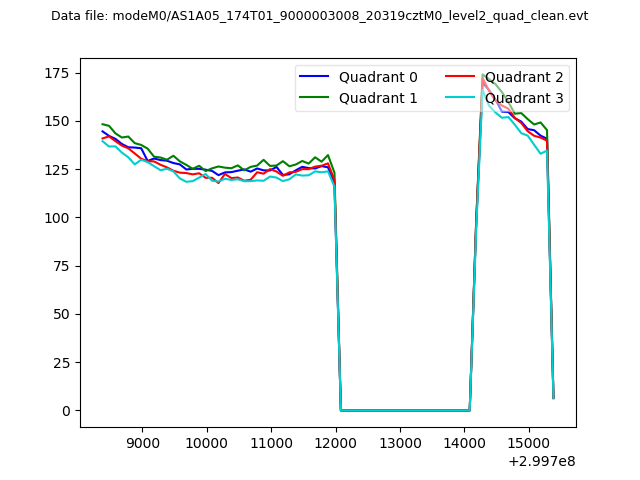 |
|
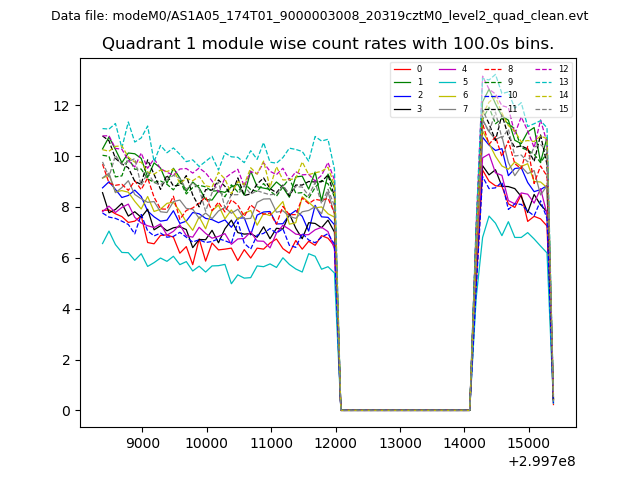
| Module-wise count rates for Quadrant A Data is divided into 100 sec bins |
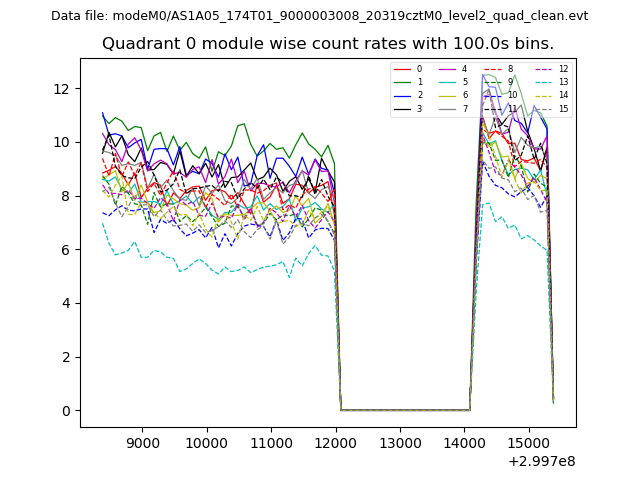 |
 |
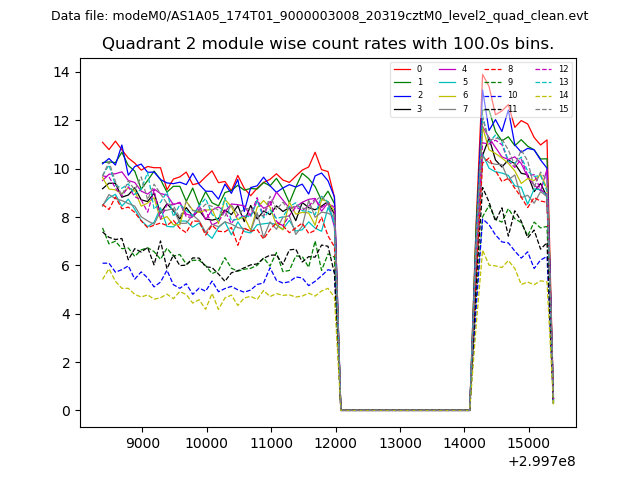
| Module-wise count rates for Quadrant B Data is divided into 100 sec bins |
 |
 |
| Module-wise count rates for Quadrant C Data is divided into 100 sec bins |
 |
 |
| Module-wise count rates for Quadrant D Data is divided into 100 sec bins |
 |
 |
| Parameter | Plot |
|---|---|
| CZT HV Monitor | 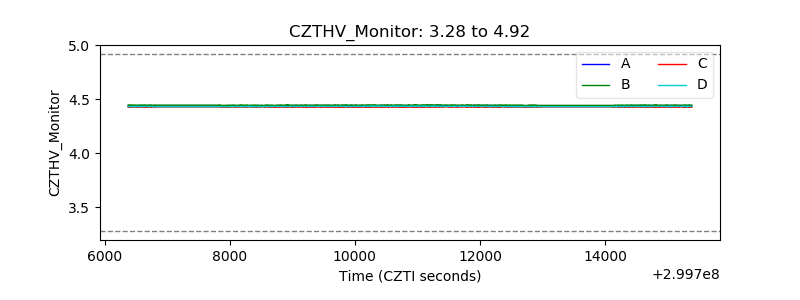 |
| D_VDD | 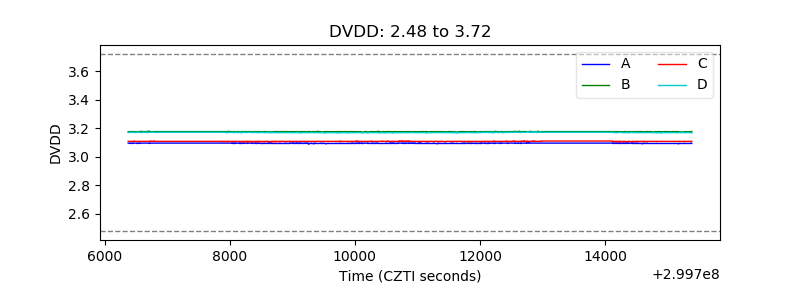 |
| Temperature 1 | 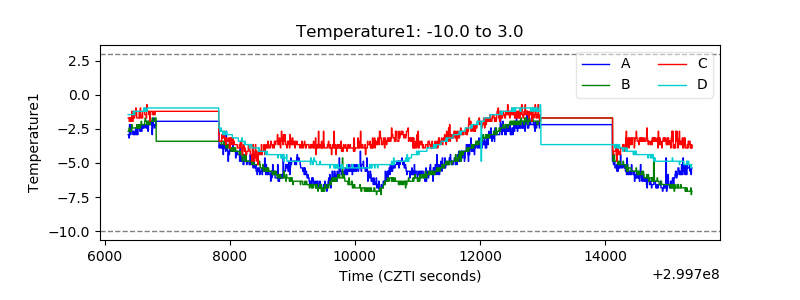 |
| Veto HV Monitor | 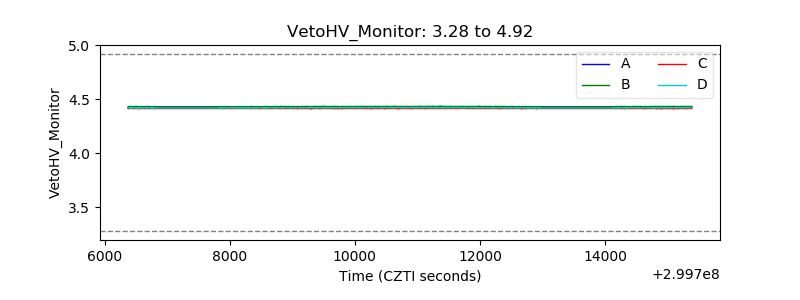 |
| Veto LLD | 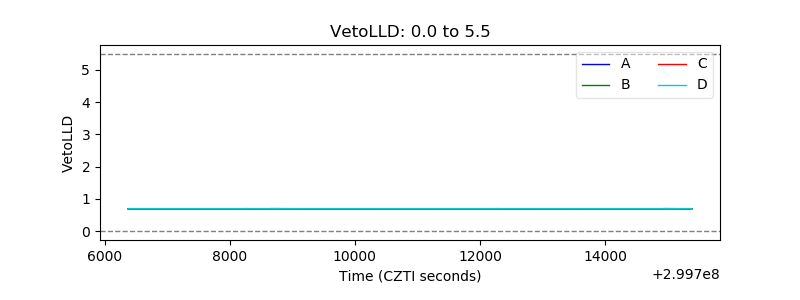 |
| Alpha Counter | 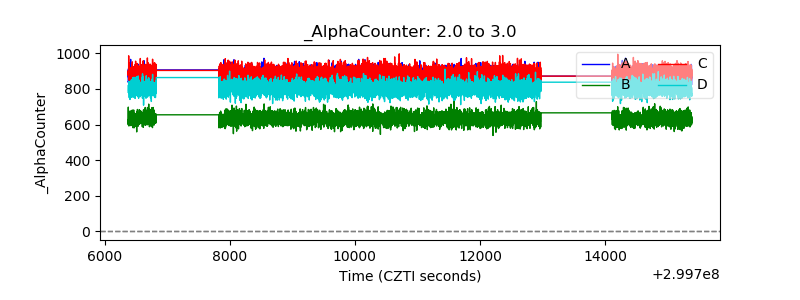 |
| _CPM_Rate | 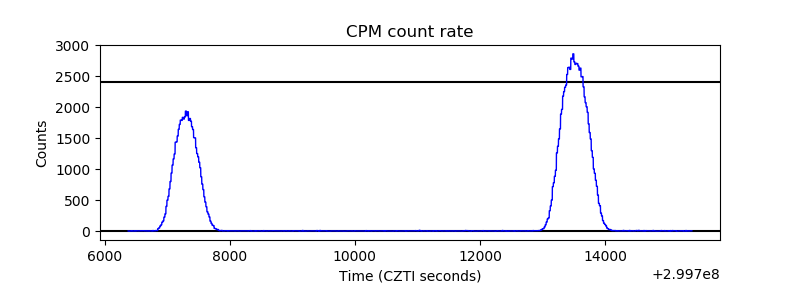 |
| CZT Counter |  |
| +2.5 Volts monitor | 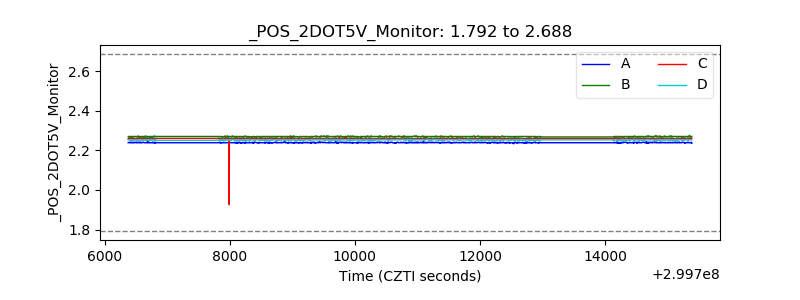 |
| +5 Volts monitor |  |
| _ROLL_ROT | 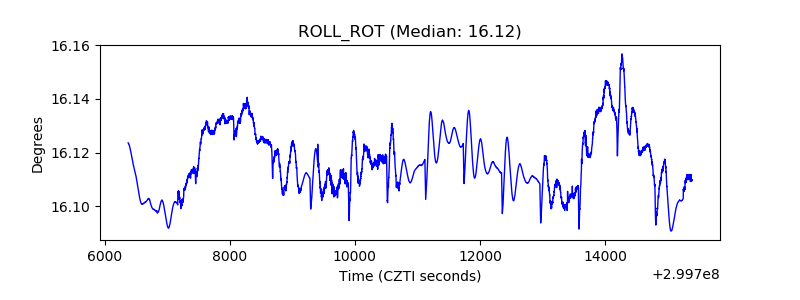 |
| _Roll_DEC | 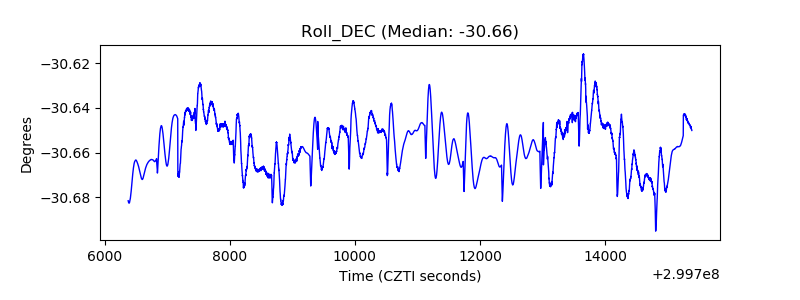 |
| _Roll_RA | 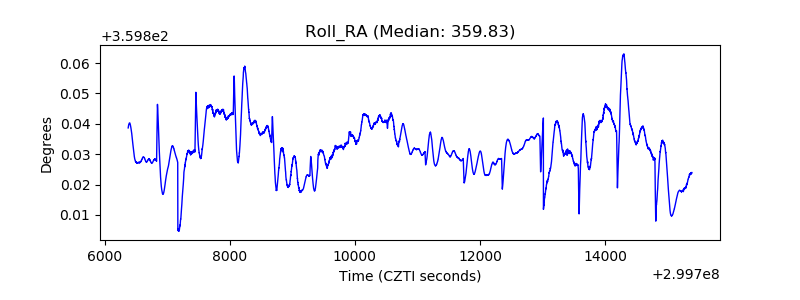 |
| Veto Counter | 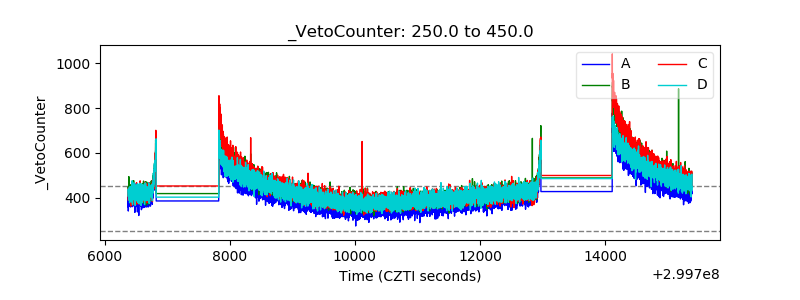 |