| Param | Original file | Final file |
|---|---|---|
| Filename | modeM0/AS1A05_174T01_9000003008_20320cztM0_level2.evt | modeM0/AS1A05_174T01_9000003008_20320cztM0_level2_quad_clean.evt |
| Size (bytes) | 479,891,520 | 108,835,200 |
| Size | 457.7 MB | 103.8 MB |
| Events in quadrant A | 3,169,799 | 714,578 |
| Events in quadrant B | 3,490,221 | 739,153 |
| Events in quadrant C | 3,262,374 | 713,123 |
| Events in quadrant D | 4,185,422 | 691,808 |
| Mode M9 | |||
|---|---|---|---|
| Quadrant | BADHDUFLAG | Total packets | Discarded packets |
| A | 0 | 20 | 0 |
| B | 0 | 21 | 0 |
| C | 0 | 21 | 0 |
| D | 0 | 21 | 0 |
| Mode M0 | |||
|---|---|---|---|
| Quadrant | BADHDUFLAG | Total packets | Discarded packets |
| A | 0 | 13416 | 2 |
| B | 0 | 14419 | 2 |
| C | 0 | 13560 | 2 |
| D | 0 | 16547 | 2 |
| Mode SS | |||
|---|---|---|---|
| Quadrant | BADHDUFLAG | Total packets | Discarded packets |
| A | 0 | 128 | 0 |
| B | 0 | 128 | 0 |
| C | 0 | 128 | 0 |
| D | 0 | 128 | 0 |
| Quadrant | Total seconds | Saturated seconds | Saturation percentage |
|---|---|---|---|
| A | 6268 | 23 | 0.366943% |
| B | 6268 | 120 | 1.914486% |
| C | 6268 | 76 | 1.212508% |
| D | 6268 | 286 | 4.562859% |
Noise dominated data is calculated using 1-second bins in cleaned event files. If a bin has >2000 counts, and if more than 50% of those come from <1% of pixels, then it is considered to be noise-dominated and hence unusable.
| Quadrant | # 1 sec bins | Bins with >0 counts | Bins with >2000 counts | High rate bins dominated by noise | Noise dominated (total time) | Noise dominated (detector-on time) | Marked lightcurve |
|---|---|---|---|---|---|---|---|
| A | 7498 | 6269 | 0 | 0 | 0.00% | 0.00% | 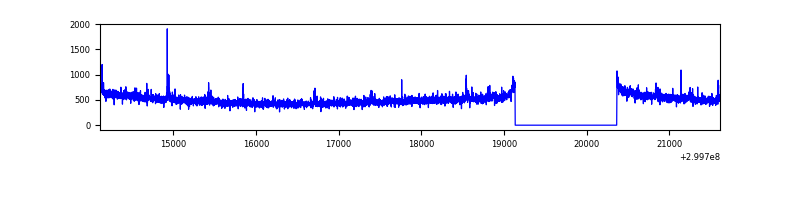 |
| B | 7498 | 6269 | 38 | 38 | 0.51% | 0.61% | 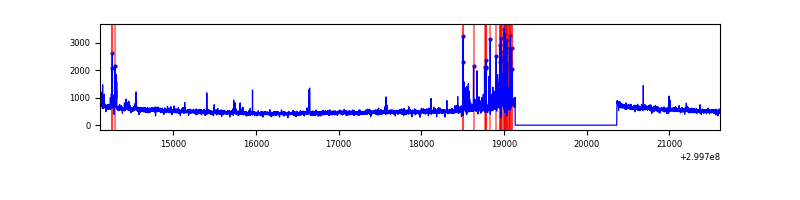 |
| C | 7498 | 6269 | 0 | 0 | 0.00% | 0.00% | 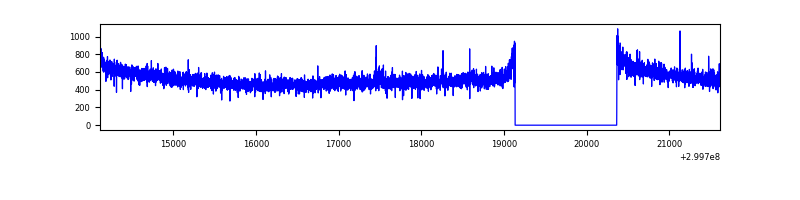 |
| D | 7498 | 6269 | 210 | 210 | 2.80% | 3.35% | 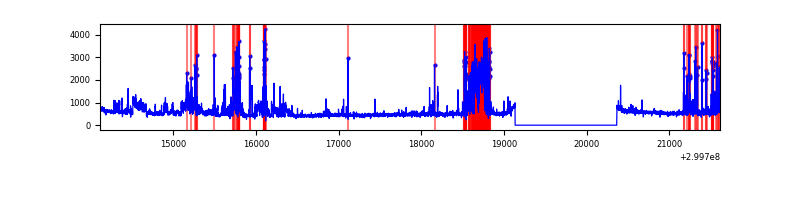 |
Top three noisy pixels from each quadrant. If the there are fewer than three noisy pixels in the level2.evt file, extra rows are filled as -1
| Pixel properties | Quadrant properties | ||||||
|---|---|---|---|---|---|---|---|
| Quadrant | DetID | PixID | Counts | Sigma | Mean | Median | Sigma |
| A | 14 | 238 | 50454 | 307.17 | 804 | 790 | 161.7 |
| A | 11 | 29 | 13649 | 79.53 | 804 | 790 | 161.7 |
| A | 13 | 254 | 10205 | 58.23 | 804 | 790 | 161.7 |
| B | 7 | 220 | 136519 | 889.73 | 808 | 786 | 152.6 |
| B | 4 | 142 | 83791 | 544.1 | 808 | 786 | 152.6 |
| B | 0 | 197 | 37845 | 242.92 | 808 | 786 | 152.6 |
| C | 14 | 238 | 124624 | 674.43 | 792 | 801 | 183.6 |
| C | 3 | 9 | 31279 | 166.01 | 792 | 801 | 183.6 |
| C | 0 | 207 | 11415 | 57.81 | 792 | 801 | 183.6 |
| D | 1 | 52 | 733942 | 3869.08 | 787 | 766 | 189.5 |
| D | 9 | 1 | 401005 | 2112.12 | 787 | 766 | 189.5 |
| D | 2 | 184 | 65592 | 342.1 | 787 | 766 | 189.5 |
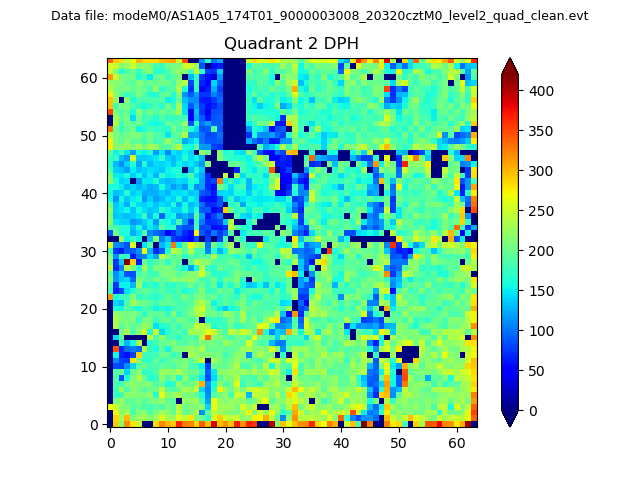
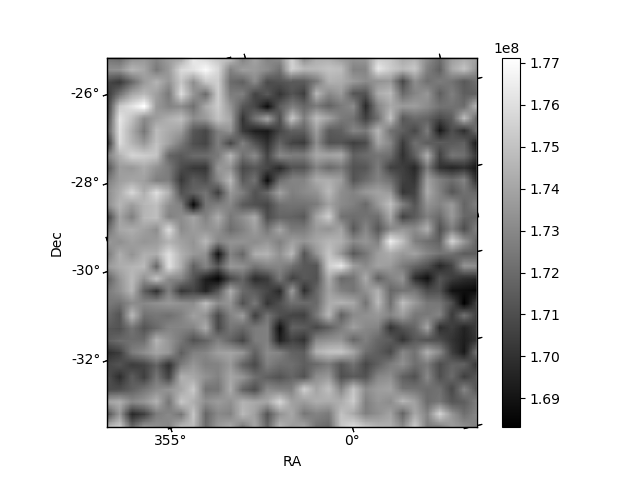
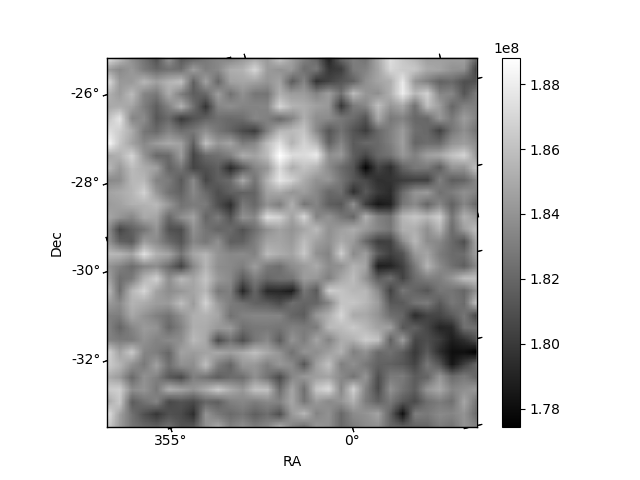
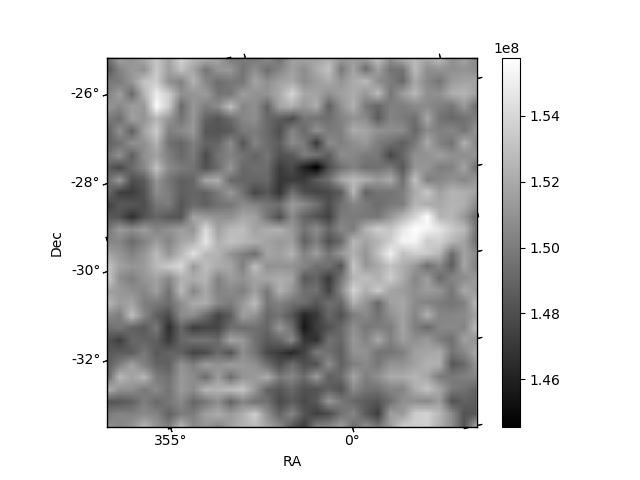
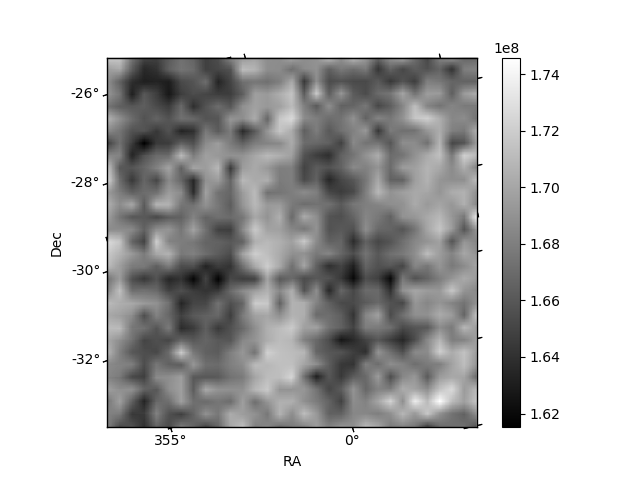
Histogram calculated using DETX and DETY for each event in the final _common_clean file
| Quadrant A | 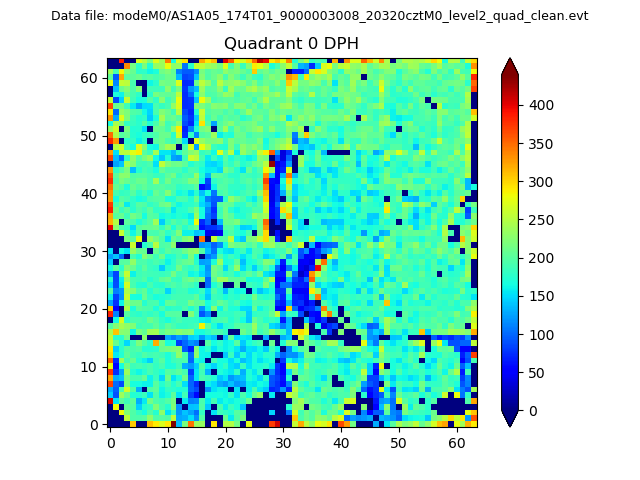 |
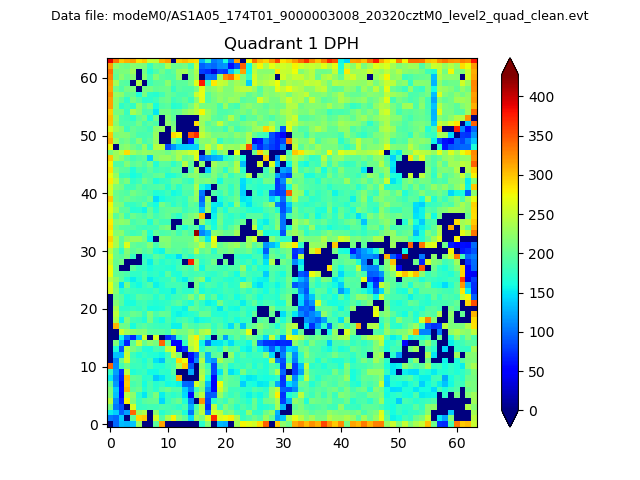 |
Quadrant B |
|---|---|---|---|
| Quadrant D | 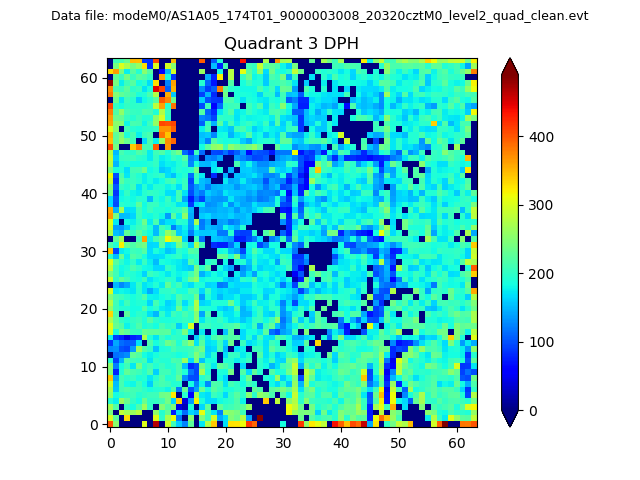 |
 |
Quadrant C |
| Plot type | Count rate plots | Images |
|---|---|---|
| Comparison with Poisson distribution Blue bars denote a histogram of data divided into 1 sec bins. Red curve is a Poisson curve with rate = median count rate of data. |
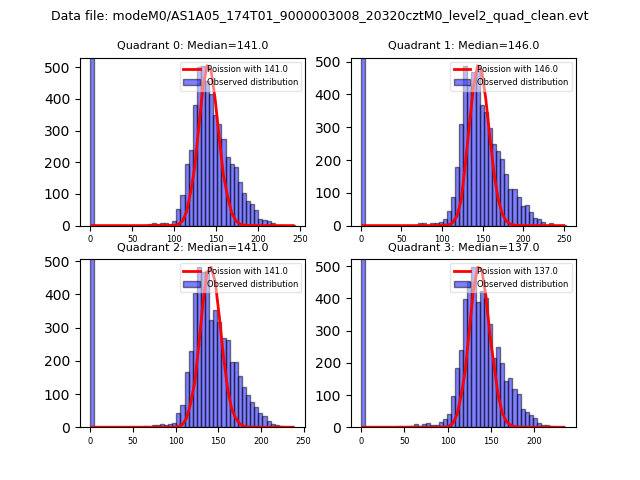 |
 |
| Quadrant-wise count rates Data is divided into 100 sec bins |
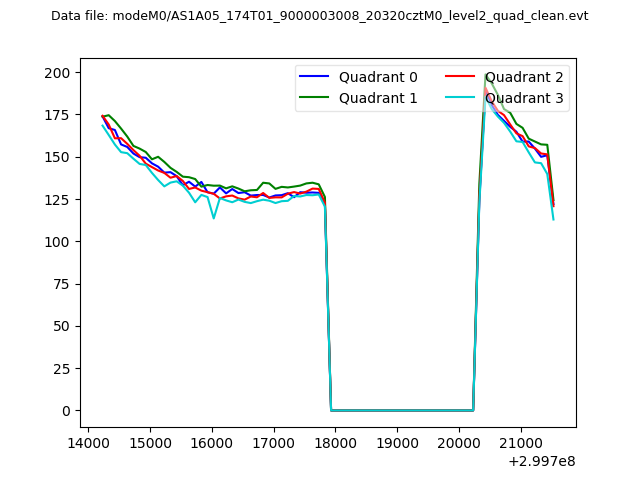 |
|
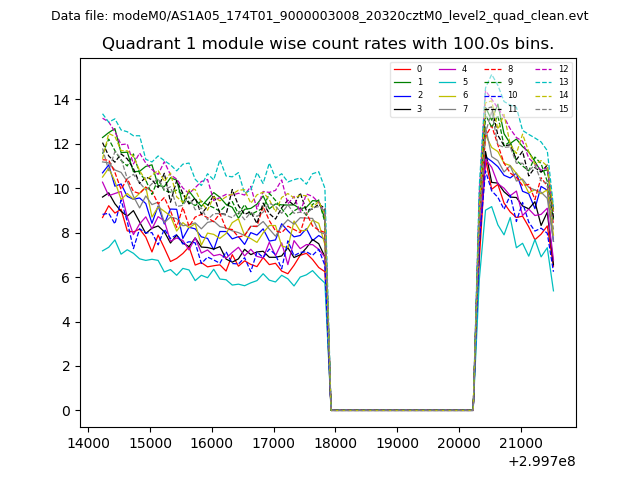
| Module-wise count rates for Quadrant A Data is divided into 100 sec bins |
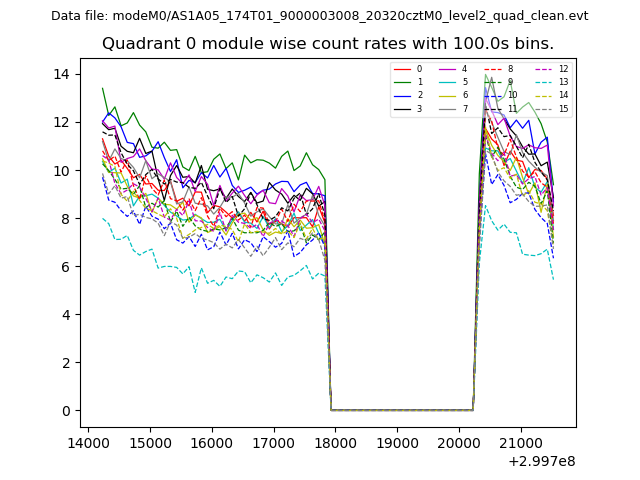 |
 |
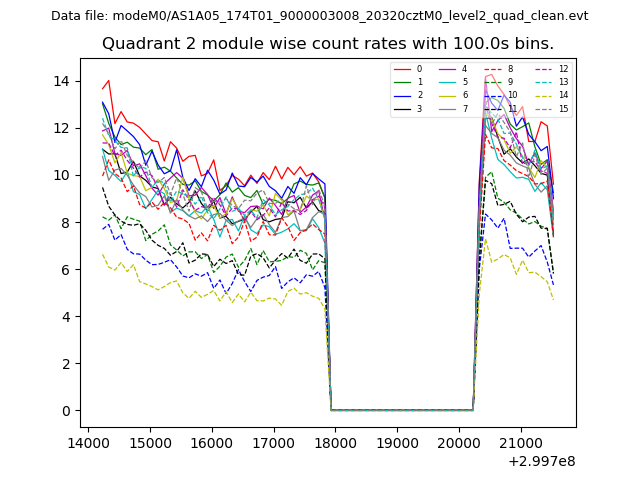
| Module-wise count rates for Quadrant B Data is divided into 100 sec bins |
 |
 |
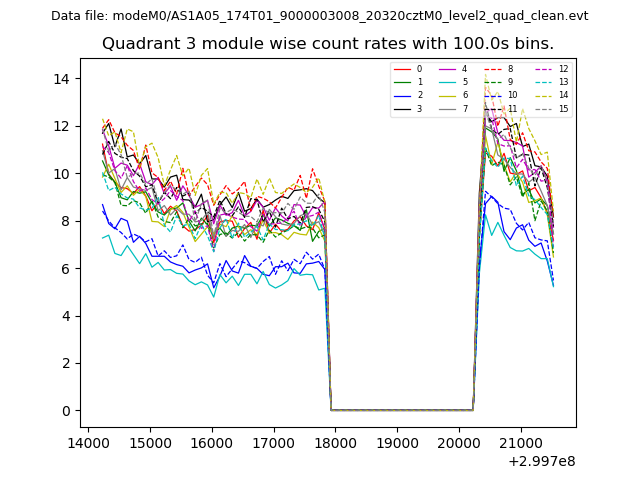
| Module-wise count rates for Quadrant C Data is divided into 100 sec bins |
 |
 |
| Module-wise count rates for Quadrant D Data is divided into 100 sec bins |
 |
 |
| Parameter | Plot |
|---|---|
| CZT HV Monitor | 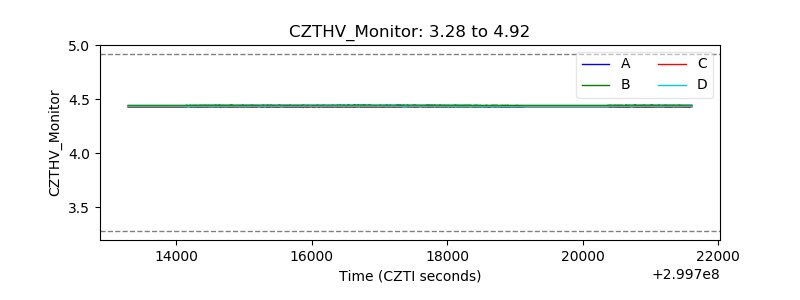 |
| D_VDD |  |
| Temperature 1 | 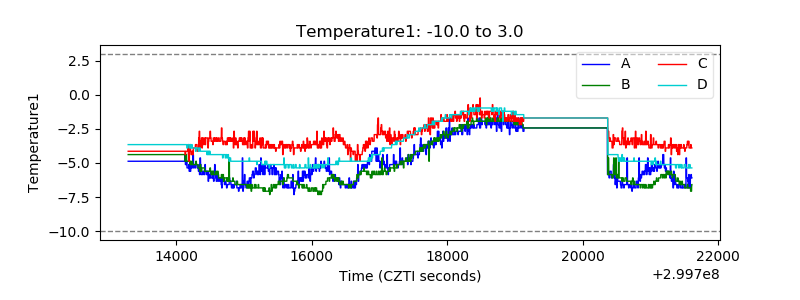 |
| Veto HV Monitor | 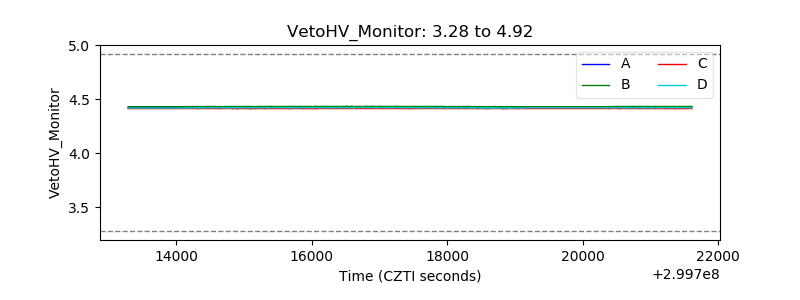 |
| Veto LLD | 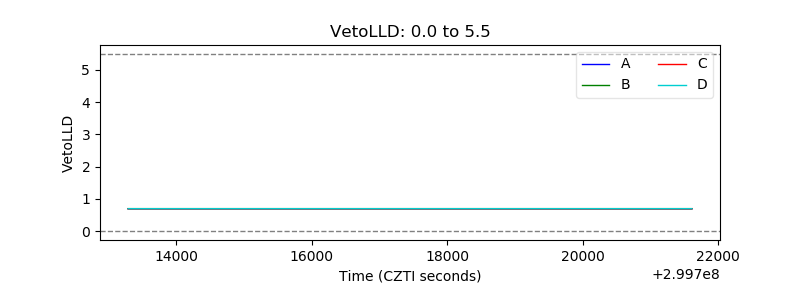 |
| Alpha Counter | 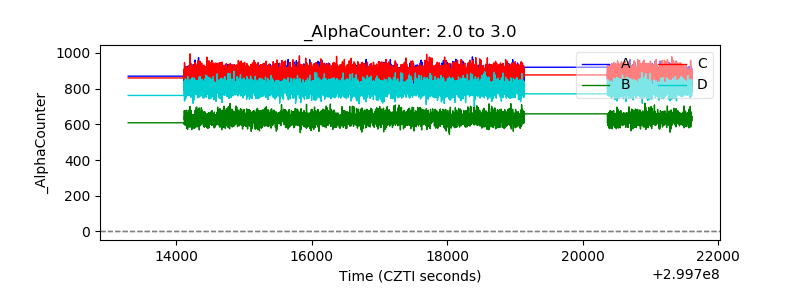 |
| _CPM_Rate | 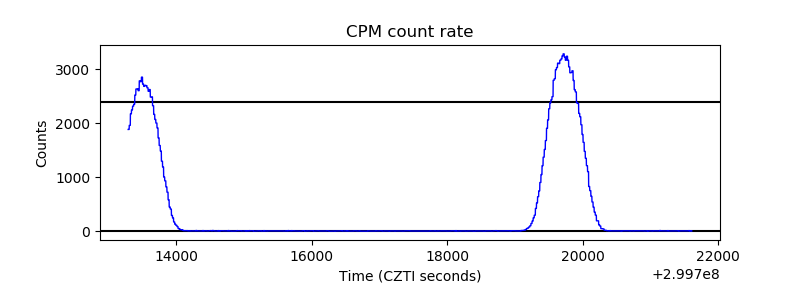 |
| CZT Counter | 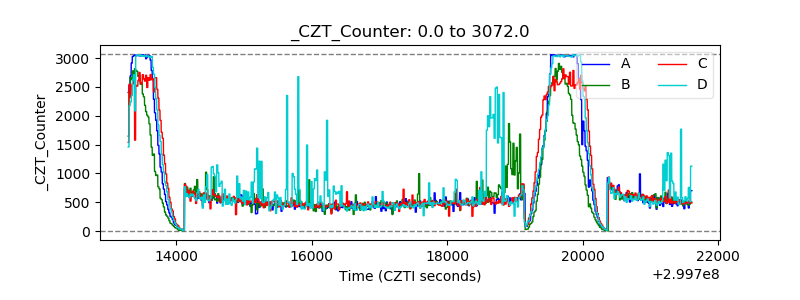 |
| +2.5 Volts monitor |  |
| +5 Volts monitor |  |
| _ROLL_ROT | 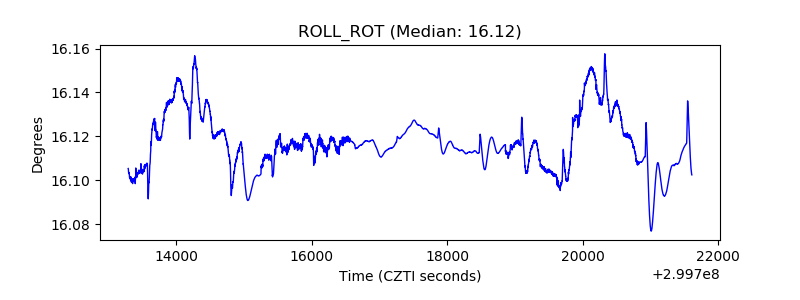 |
| _Roll_DEC | 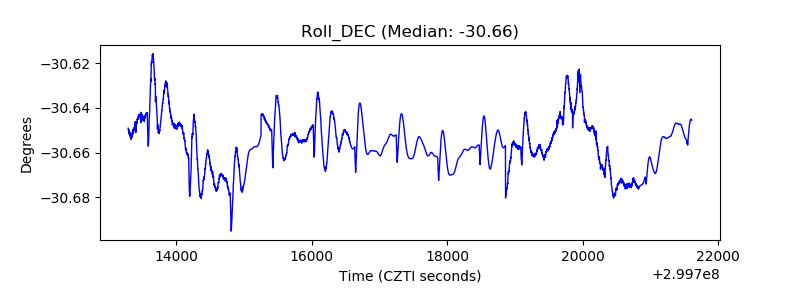 |
| _Roll_RA |  |
| Veto Counter | 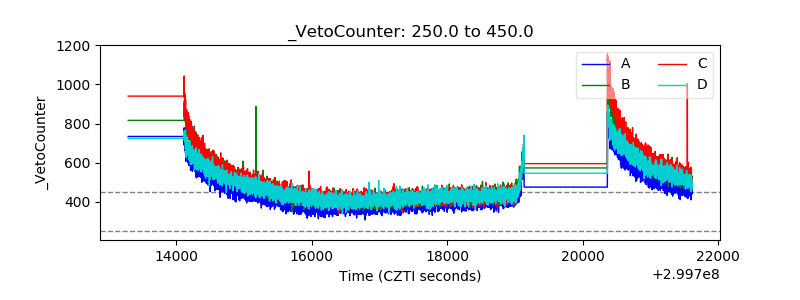 |