| Param | Original file | Final file |
|---|---|---|
| Filename | modeM0/AS1A05_174T01_9000003008_20321cztM0_level2.evt | modeM0/AS1A05_174T01_9000003008_20321cztM0_level2_quad_clean.evt |
| Size (bytes) | 456,085,440 | 109,751,040 |
| Size | 435.0 MB | 104.7 MB |
| Events in quadrant A | 3,221,253 | 718,259 |
| Events in quadrant B | 3,449,676 | 745,162 |
| Events in quadrant C | 3,311,331 | 722,379 |
| Events in quadrant D | 3,406,065 | 702,168 |
| Mode M9 | |||
|---|---|---|---|
| Quadrant | BADHDUFLAG | Total packets | Discarded packets |
| A | 0 | 23 | 0 |
| B | 0 | 24 | 0 |
| C | 0 | 24 | 0 |
| D | 0 | 24 | 0 |
| Mode M0 | |||
|---|---|---|---|
| Quadrant | BADHDUFLAG | Total packets | Discarded packets |
| A | 0 | 13455 | 3 |
| B | 0 | 14277 | 2 |
| C | 0 | 13640 | 2 |
| D | 0 | 14086 | 2 |
| Mode SS | |||
|---|---|---|---|
| Quadrant | BADHDUFLAG | Total packets | Discarded packets |
| A | 0 | 128 | 0 |
| B | 0 | 128 | 0 |
| C | 0 | 128 | 0 |
| D | 0 | 128 | 0 |
| Quadrant | Total seconds | Saturated seconds | Saturation percentage |
|---|---|---|---|
| A | 6243 | 28 | 0.448502% |
| B | 6243 | 95 | 1.521704% |
| C | 6243 | 76 | 1.217363% |
| D | 6243 | 63 | 1.009130% |
Noise dominated data is calculated using 1-second bins in cleaned event files. If a bin has >2000 counts, and if more than 50% of those come from <1% of pixels, then it is considered to be noise-dominated and hence unusable.
| Quadrant | # 1 sec bins | Bins with >0 counts | Bins with >2000 counts | High rate bins dominated by noise | Noise dominated (total time) | Noise dominated (detector-on time) | Marked lightcurve |
|---|---|---|---|---|---|---|---|
| A | 7553 | 6244 | 0 | 0 | 0.00% | 0.00% | 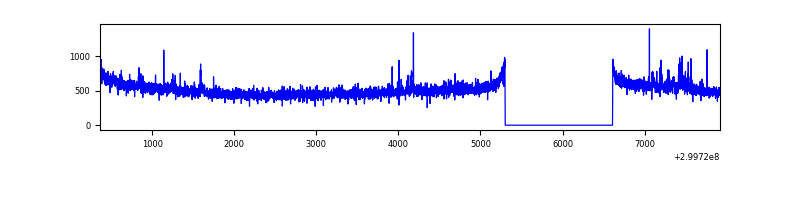 |
| B | 7553 | 6244 | 24 | 24 | 0.32% | 0.38% | 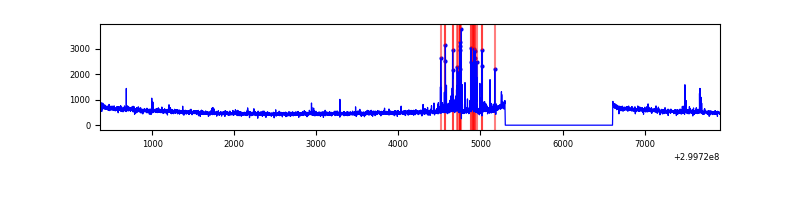 |
| C | 7553 | 6244 | 0 | 0 | 0.00% | 0.00% | 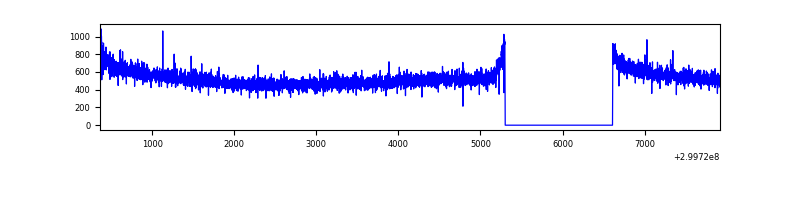 |
| D | 7553 | 6244 | 36 | 36 | 0.48% | 0.58% | 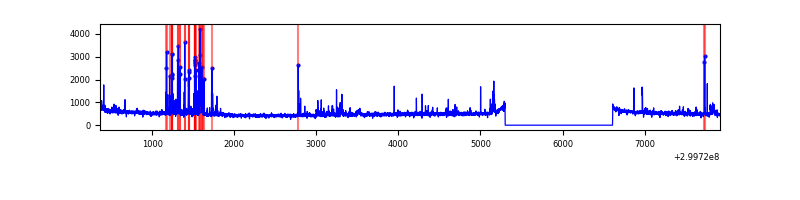 |
Top three noisy pixels from each quadrant. If the there are fewer than three noisy pixels in the level2.evt file, extra rows are filled as -1
| Pixel properties | Quadrant properties | ||||||
|---|---|---|---|---|---|---|---|
| Quadrant | DetID | PixID | Counts | Sigma | Mean | Median | Sigma |
| A | 14 | 238 | 55303 | 333.53 | 819 | 806 | 163.4 |
| A | 11 | 29 | 9688 | 54.36 | 819 | 806 | 163.4 |
| A | 13 | 254 | 9265 | 51.77 | 819 | 806 | 163.4 |
| B | 7 | 220 | 173009 | 1118.37 | 823 | 804 | 154.0 |
| B | 0 | 230 | 24406 | 153.28 | 823 | 804 | 154.0 |
| B | 12 | 111 | 17808 | 110.43 | 823 | 804 | 154.0 |
| C | 14 | 238 | 127643 | 668.71 | 812 | 820 | 189.7 |
| C | 0 | 207 | 11848 | 58.15 | 812 | 820 | 189.7 |
| C | 13 | 61 | 5557 | 24.98 | 812 | 820 | 189.7 |
| D | 9 | 1 | 272403 | 1374.7 | 815 | 795 | 197.6 |
| D | 1 | 52 | 31969 | 157.78 | 815 | 795 | 197.6 |
| D | 2 | 234 | 28218 | 138.8 | 815 | 795 | 197.6 |
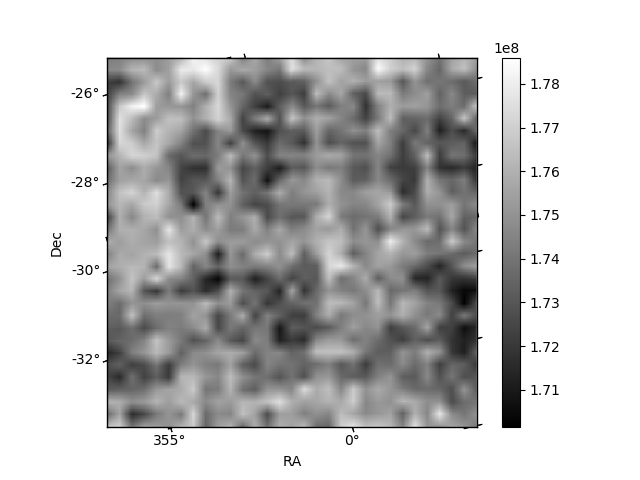
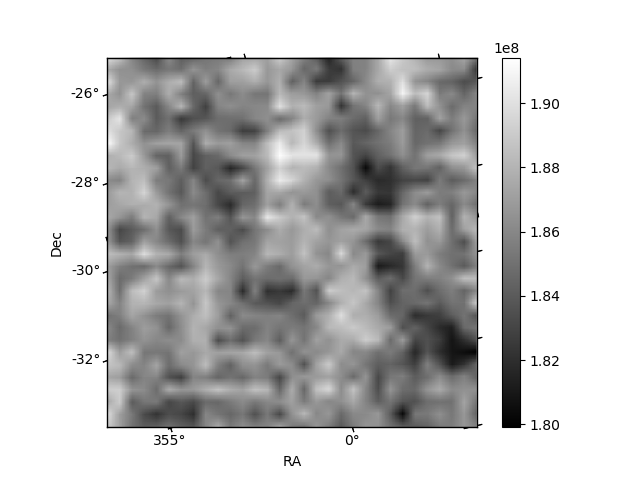
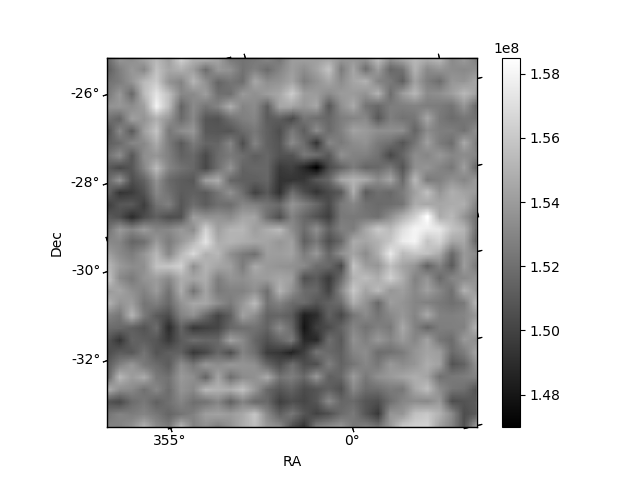
Histogram calculated using DETX and DETY for each event in the final _common_clean file
| Quadrant A | 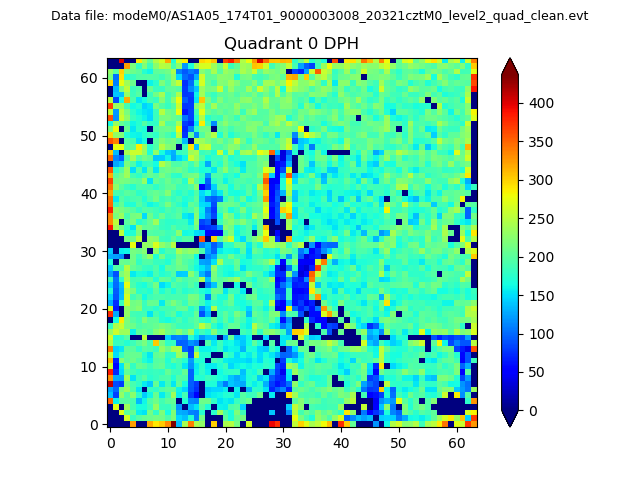 |
 |
Quadrant B |
|---|---|---|---|
| Quadrant D | 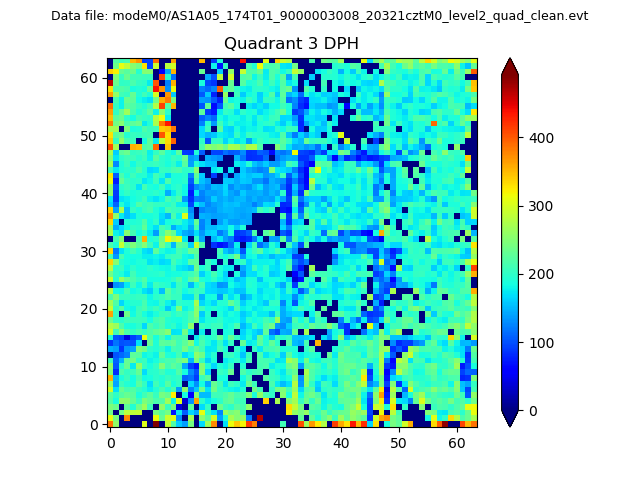 |
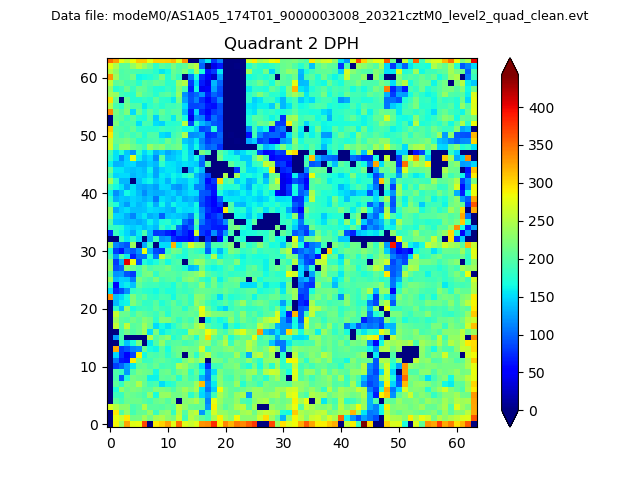 |
Quadrant C |
| Plot type | Count rate plots | Images |
|---|---|---|
| Comparison with Poisson distribution Blue bars denote a histogram of data divided into 1 sec bins. Red curve is a Poisson curve with rate = median count rate of data. |
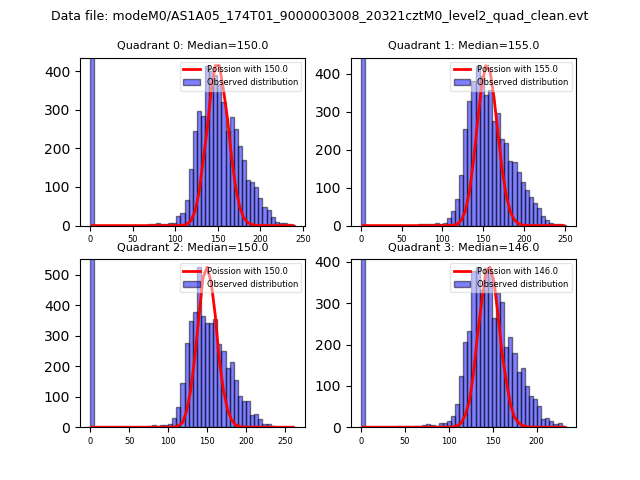 |
 |
| Quadrant-wise count rates Data is divided into 100 sec bins |
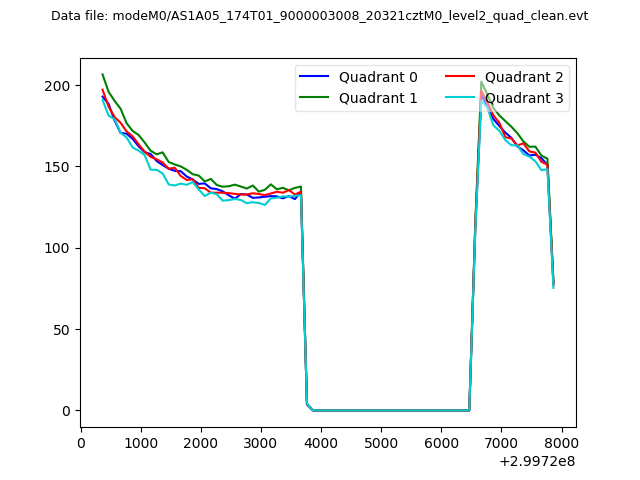 |
|
| Module-wise count rates for Quadrant A Data is divided into 100 sec bins |
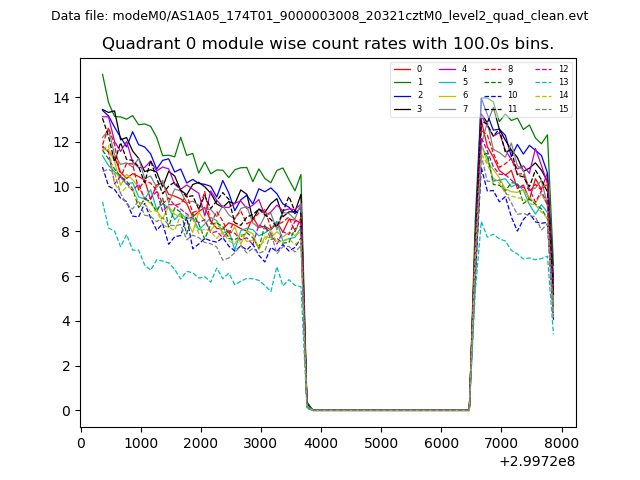 |
 |
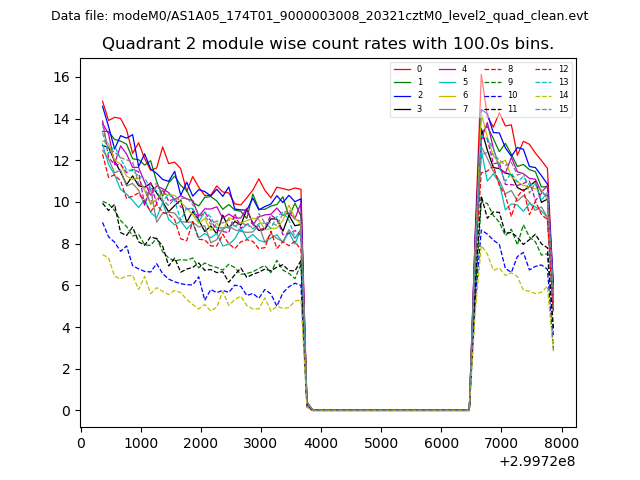
| Module-wise count rates for Quadrant B Data is divided into 100 sec bins |
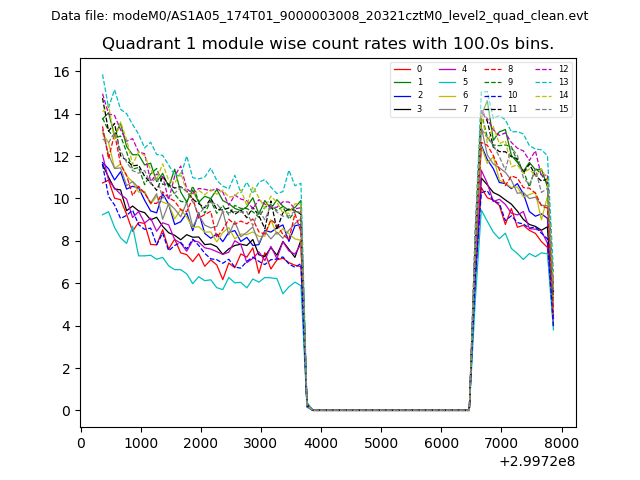 |
 |
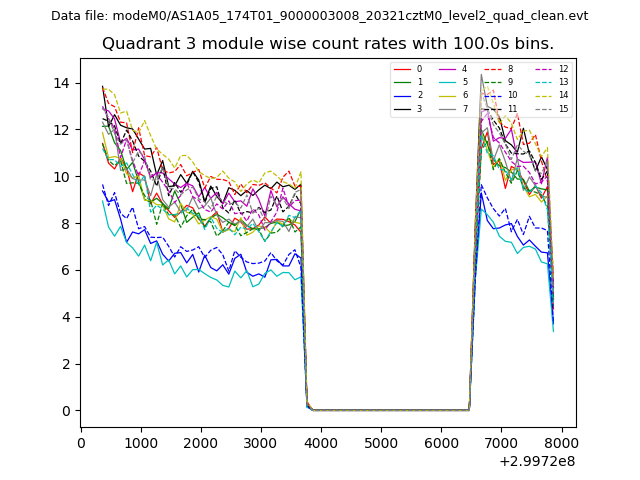
| Module-wise count rates for Quadrant C Data is divided into 100 sec bins |
 |
 |
| Module-wise count rates for Quadrant D Data is divided into 100 sec bins |
 |
 |
| Parameter | Plot |
|---|---|
| CZT HV Monitor | 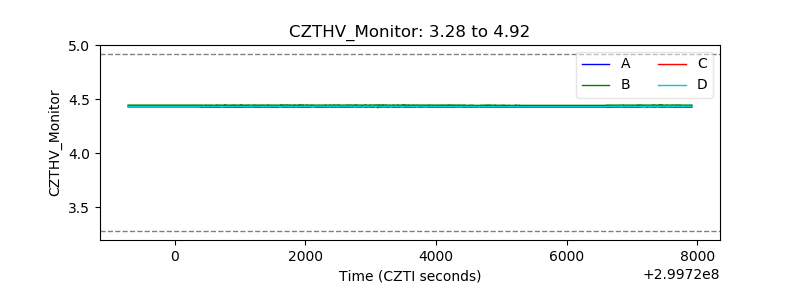 |
| D_VDD | 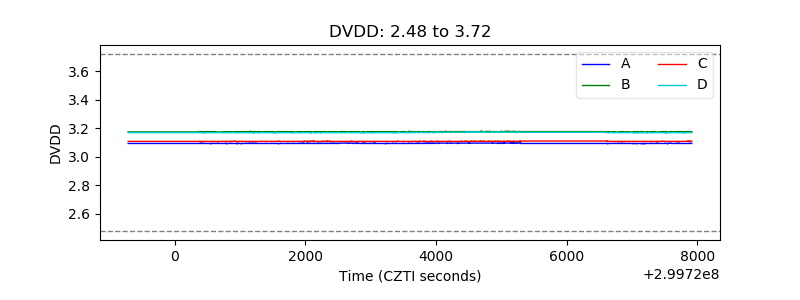 |
| Temperature 1 | 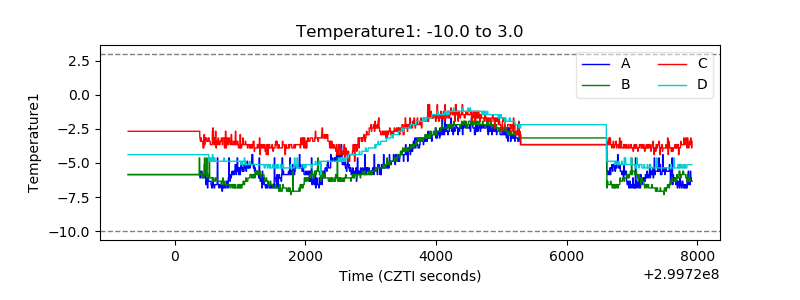 |
| Veto HV Monitor | 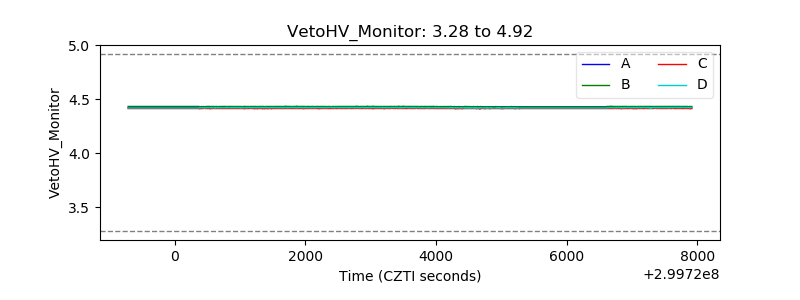 |
| Veto LLD | 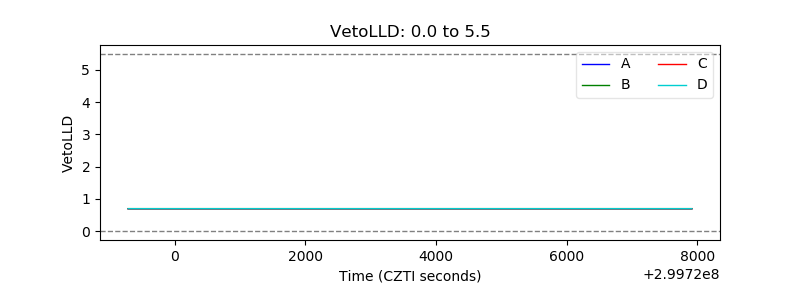 |
| Alpha Counter | 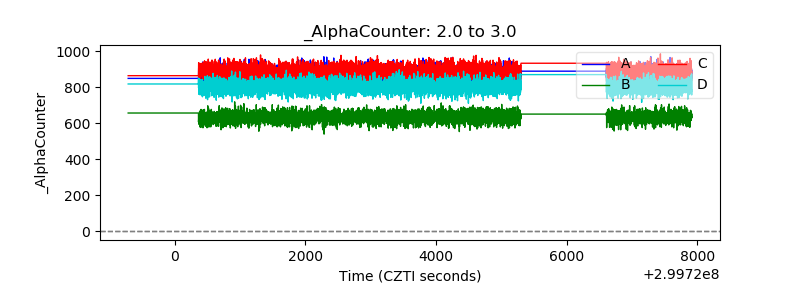 |
| _CPM_Rate | 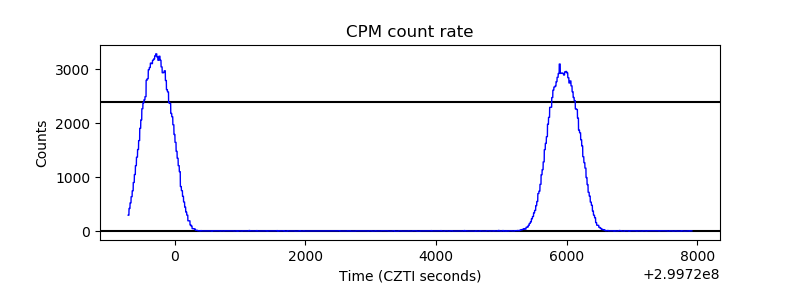 |
| CZT Counter | 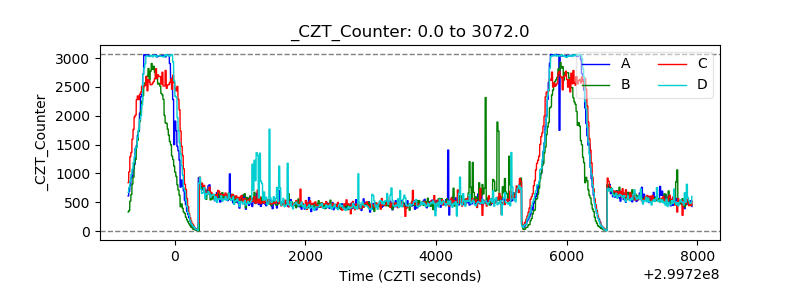 |
| +2.5 Volts monitor |  |
| +5 Volts monitor |  |
| _ROLL_ROT | 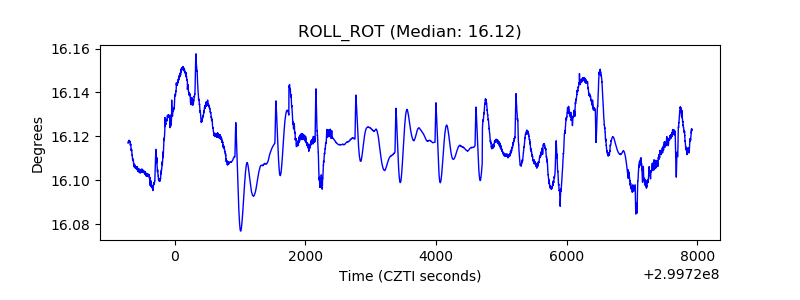 |
| _Roll_DEC | 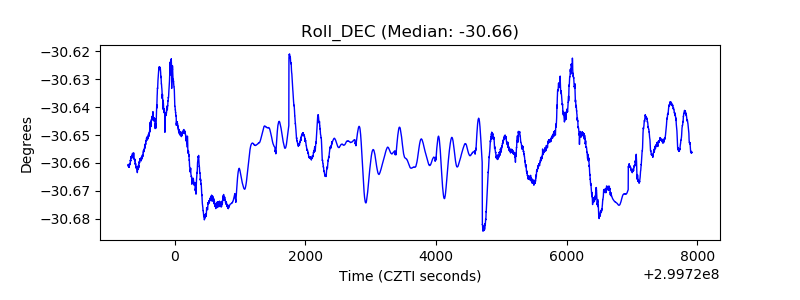 |
| _Roll_RA |  |
| Veto Counter | 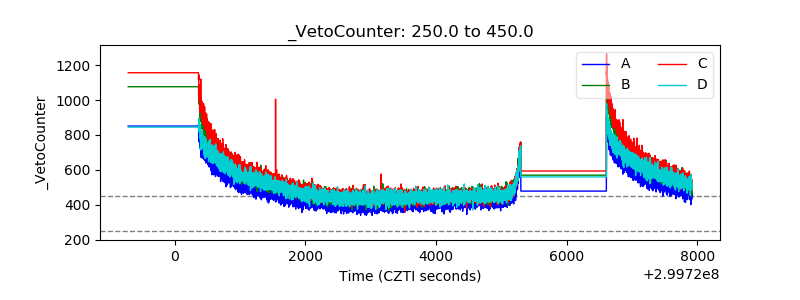 |