| Param | Original file | Final file |
|---|---|---|
| Filename | modeM0/AS1A05_174T01_9000003008_20322cztM0_level2.evt | modeM0/AS1A05_174T01_9000003008_20322cztM0_level2_quad_clean.evt |
| Size (bytes) | 447,857,280 | 102,366,720 |
| Size | 427.1 MB | 97.6 MB |
| Events in quadrant A | 3,285,117 | 665,095 |
| Events in quadrant B | 3,307,444 | 686,546 |
| Events in quadrant C | 3,363,222 | 666,288 |
| Events in quadrant D | 3,188,643 | 651,683 |
| Mode M9 | |||
|---|---|---|---|
| Quadrant | BADHDUFLAG | Total packets | Discarded packets |
| A | 0 | 17 | 0 |
| B | 0 | 18 | 0 |
| C | 0 | 18 | 0 |
| D | 0 | 18 | 0 |
| Mode M0 | |||
|---|---|---|---|
| Quadrant | BADHDUFLAG | Total packets | Discarded packets |
| A | 0 | 13543 | 2 |
| B | 0 | 13599 | 2 |
| C | 0 | 13652 | 2 |
| D | 0 | 13301 | 2 |
| Mode SS | |||
|---|---|---|---|
| Quadrant | BADHDUFLAG | Total packets | Discarded packets |
| A | 0 | 124 | 0 |
| B | 0 | 124 | 0 |
| C | 0 | 124 | 0 |
| D | 0 | 124 | 0 |
| Quadrant | Total seconds | Saturated seconds | Saturation percentage |
|---|---|---|---|
| A | 6175 | 18 | 0.291498% |
| B | 6175 | 40 | 0.647773% |
| C | 6175 | 70 | 1.133603% |
| D | 6174 | 19 | 0.307742% |
Noise dominated data is calculated using 1-second bins in cleaned event files. If a bin has >2000 counts, and if more than 50% of those come from <1% of pixels, then it is considered to be noise-dominated and hence unusable.
| Quadrant | # 1 sec bins | Bins with >0 counts | Bins with >2000 counts | High rate bins dominated by noise | Noise dominated (total time) | Noise dominated (detector-on time) | Marked lightcurve |
|---|---|---|---|---|---|---|---|
| A | 7545 | 6176 | 4 | 4 | 0.05% | 0.06% |  |
| B | 7545 | 6176 | 4 | 4 | 0.05% | 0.06% | 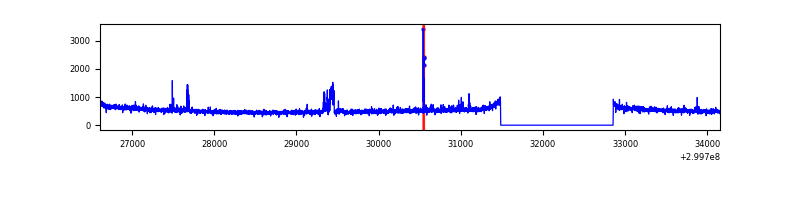 |
| C | 7545 | 6176 | 2 | 2 | 0.03% | 0.03% | 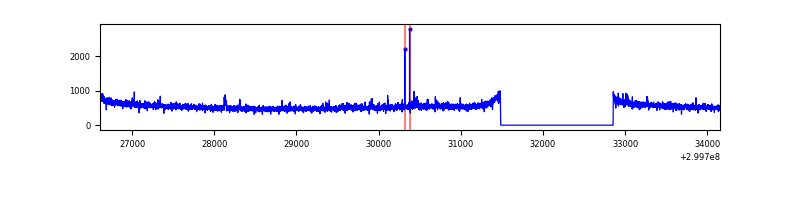 |
| D | 7544 | 6175 | 7 | 7 | 0.09% | 0.11% | 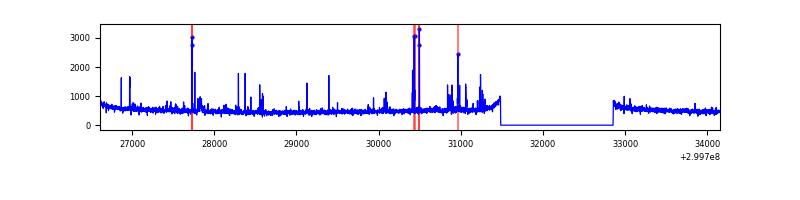 |
Top three noisy pixels from each quadrant. If the there are fewer than three noisy pixels in the level2.evt file, extra rows are filled as -1
| Pixel properties | Quadrant properties | ||||||
|---|---|---|---|---|---|---|---|
| Quadrant | DetID | PixID | Counts | Sigma | Mean | Median | Sigma |
| A | 14 | 238 | 136380 | 836.82 | 813 | 799 | 162.0 |
| A | 9 | 143 | 12372 | 71.43 | 813 | 799 | 162.0 |
| A | 13 | 254 | 8991 | 50.56 | 813 | 799 | 162.0 |
| B | 0 | 230 | 74880 | 486.94 | 813 | 793 | 152.1 |
| B | 7 | 220 | 26327 | 167.82 | 813 | 793 | 152.1 |
| B | 12 | 111 | 17719 | 111.24 | 813 | 793 | 152.1 |
| C | 14 | 238 | 126158 | 667.6 | 804 | 811 | 187.8 |
| C | 3 | 9 | 95972 | 506.83 | 804 | 811 | 187.8 |
| C | 13 | 61 | 5499 | 24.97 | 804 | 811 | 187.8 |
| D | 9 | 1 | 86307 | 437.08 | 810 | 787 | 195.7 |
| D | 1 | 52 | 25922 | 128.46 | 810 | 787 | 195.7 |
| D | 2 | 234 | 25448 | 126.04 | 810 | 787 | 195.7 |
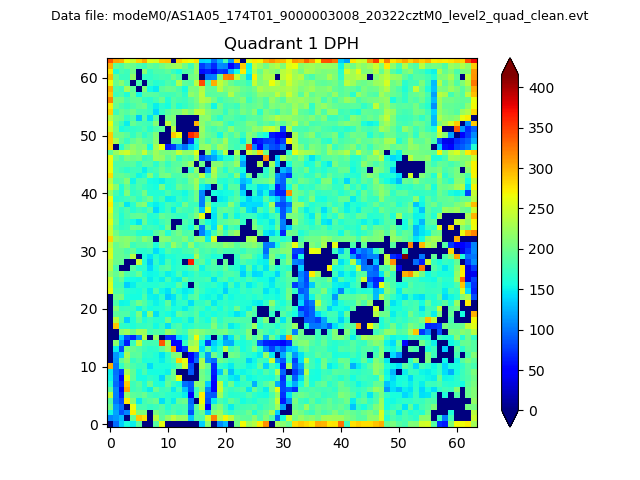
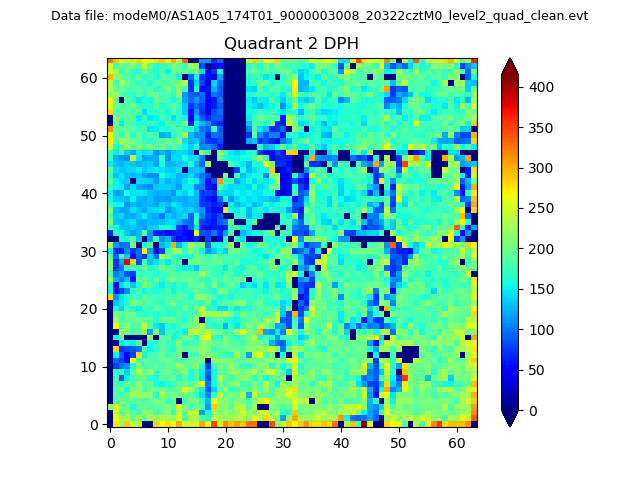
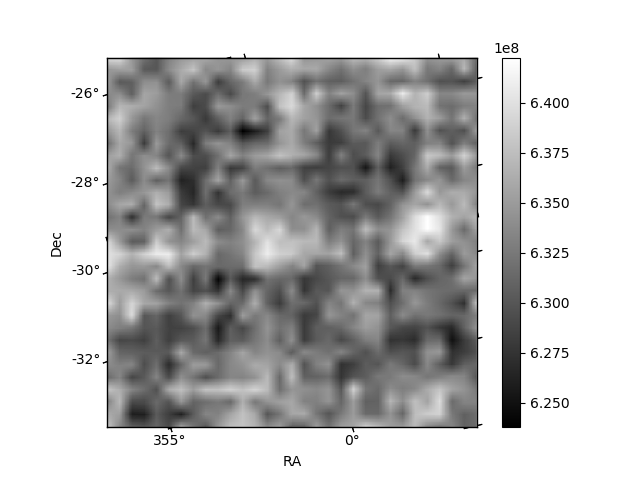
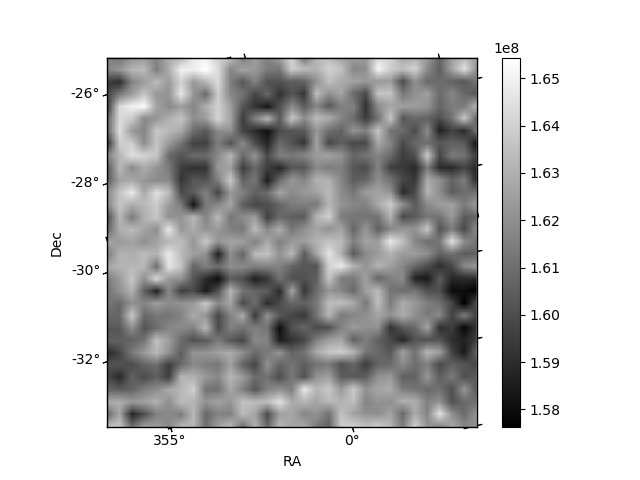
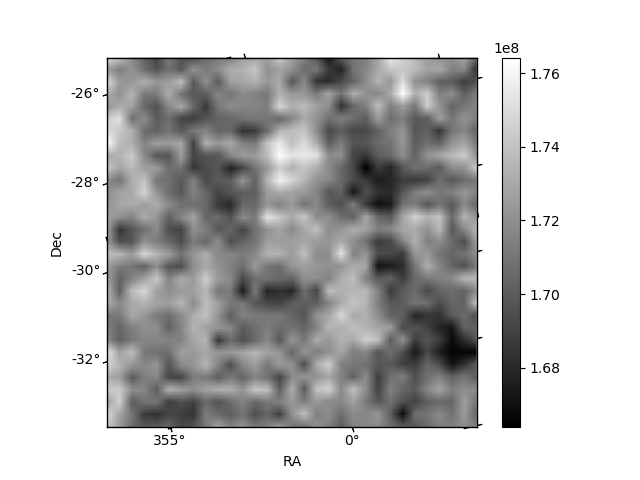
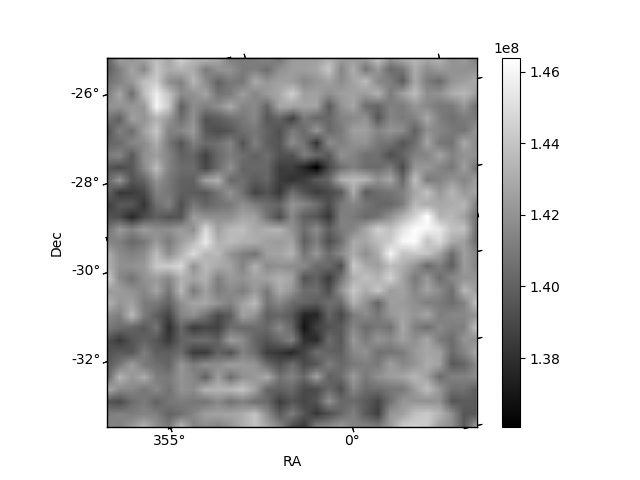
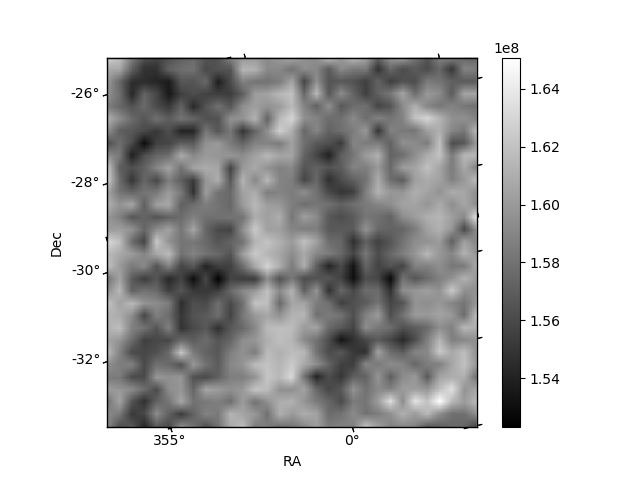
Histogram calculated using DETX and DETY for each event in the final _common_clean file
| Quadrant A | 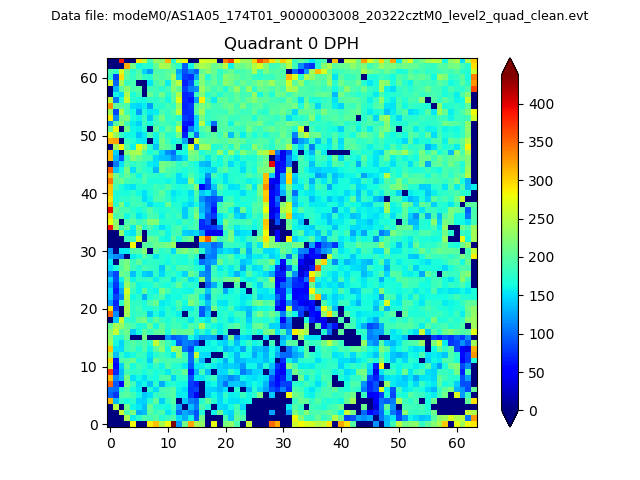 |
 |
Quadrant B |
|---|---|---|---|
| Quadrant D | 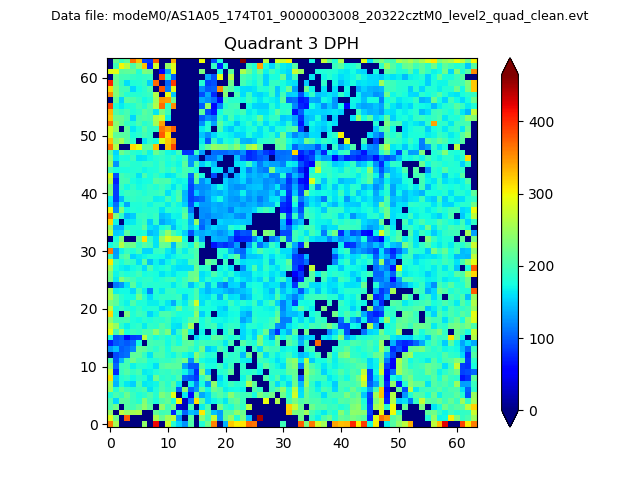 |
 |
Quadrant C |
| Plot type | Count rate plots | Images |
|---|---|---|
| Comparison with Poisson distribution Blue bars denote a histogram of data divided into 1 sec bins. Red curve is a Poisson curve with rate = median count rate of data. |
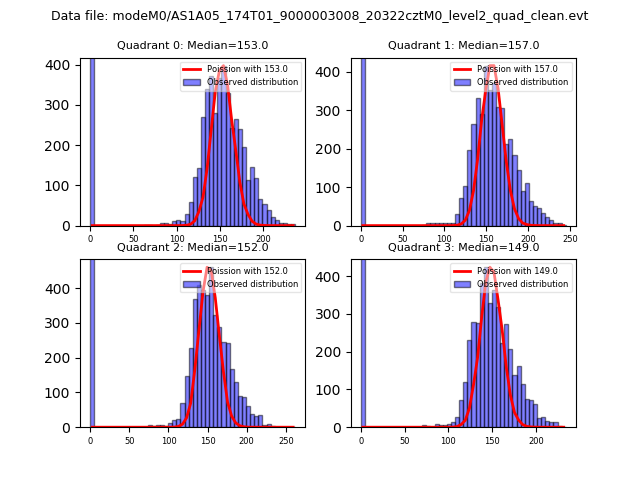 |
 |
| Quadrant-wise count rates Data is divided into 100 sec bins |
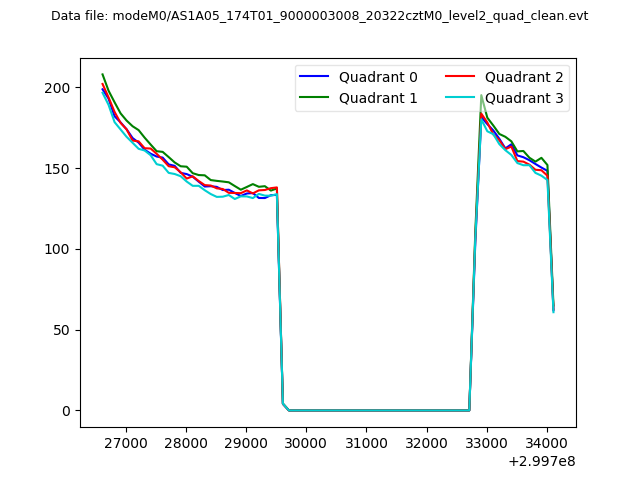 |
|
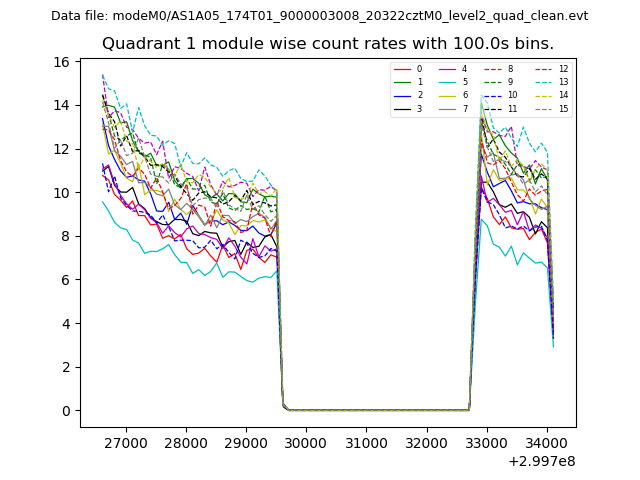
| Module-wise count rates for Quadrant A Data is divided into 100 sec bins |
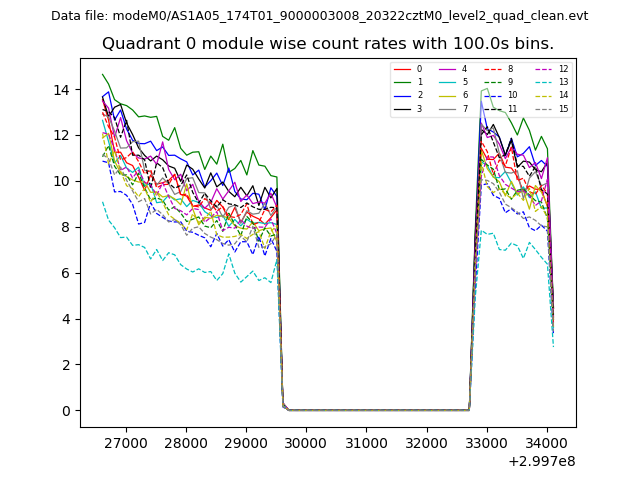 |
 |
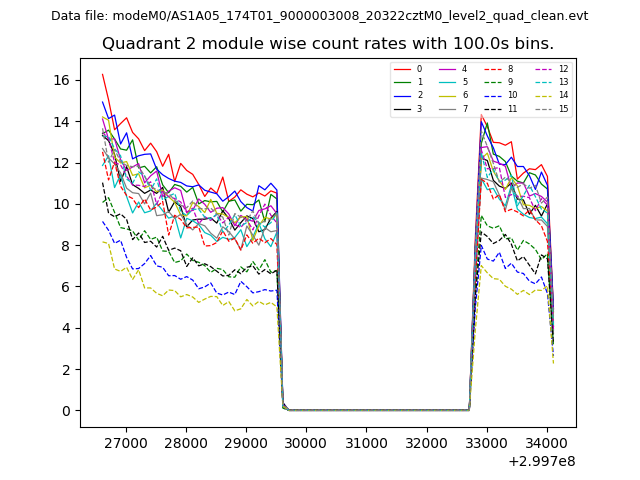
| Module-wise count rates for Quadrant B Data is divided into 100 sec bins |
 |
 |
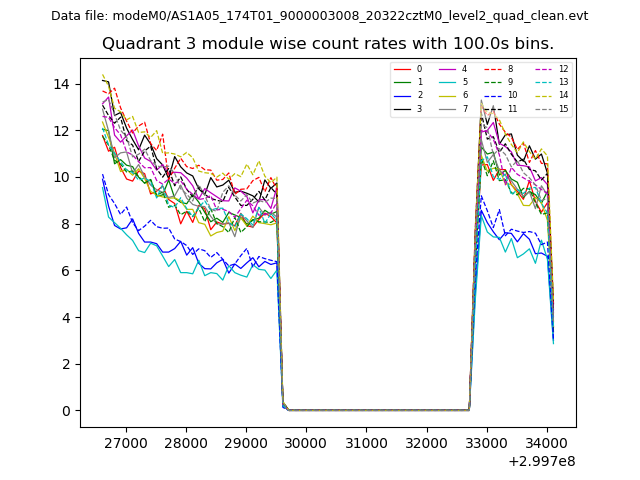
| Module-wise count rates for Quadrant C Data is divided into 100 sec bins |
 |
 |
| Module-wise count rates for Quadrant D Data is divided into 100 sec bins |
 |
 |
| Parameter | Plot |
|---|---|
| CZT HV Monitor | 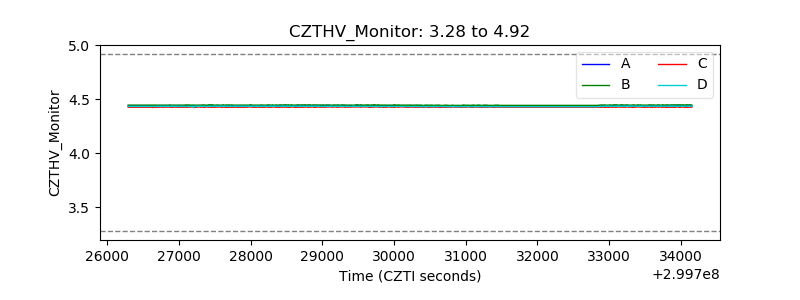 |
| D_VDD | 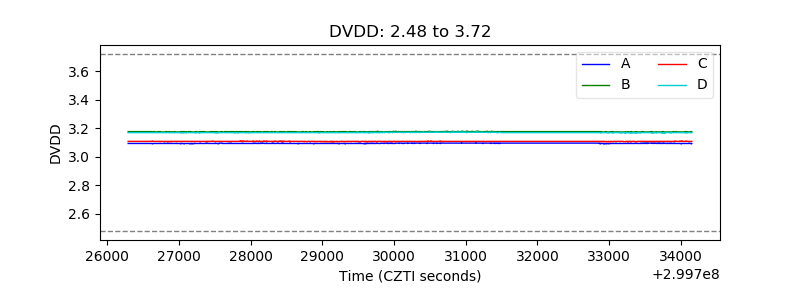 |
| Temperature 1 | 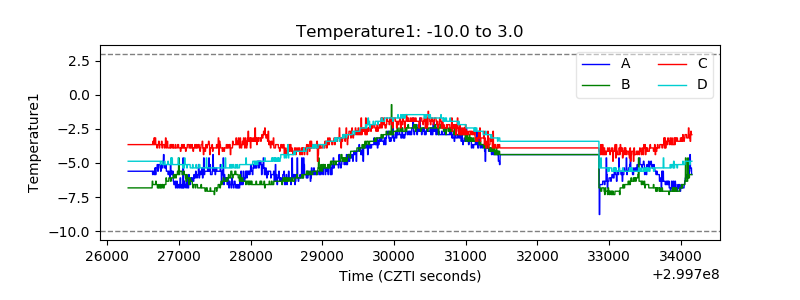 |
| Veto HV Monitor |  |
| Veto LLD | 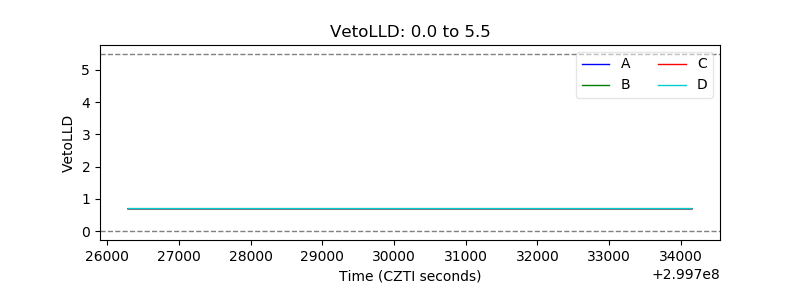 |
| Alpha Counter | 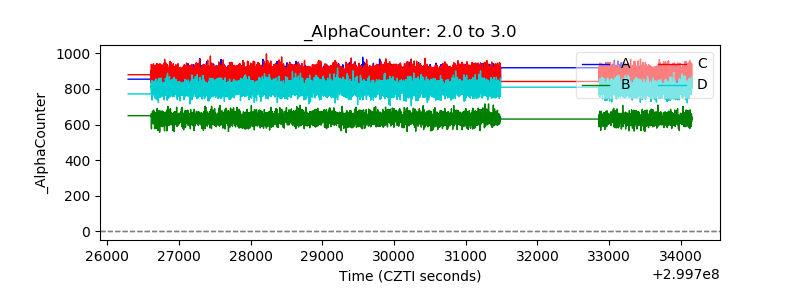 |
| _CPM_Rate | 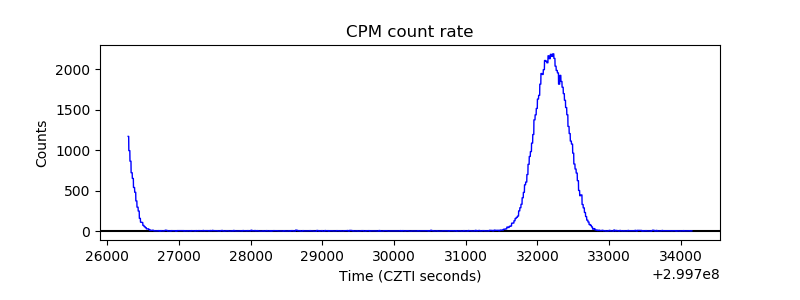 |
| CZT Counter | 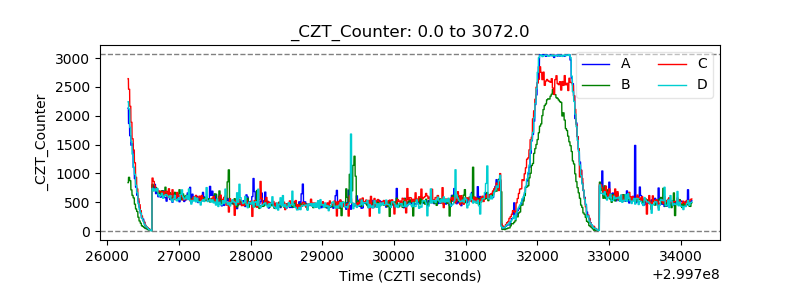 |
| +2.5 Volts monitor |  |
| +5 Volts monitor |  |
| _ROLL_ROT | 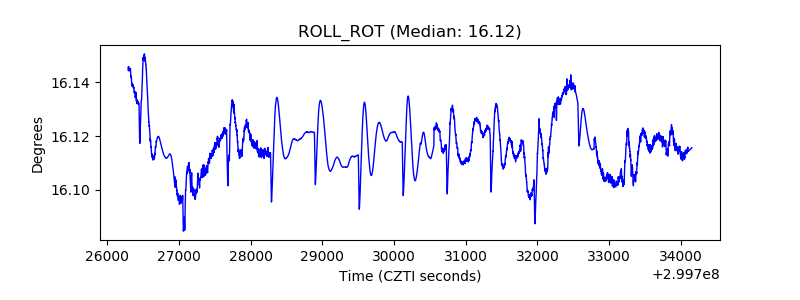 |
| _Roll_DEC | 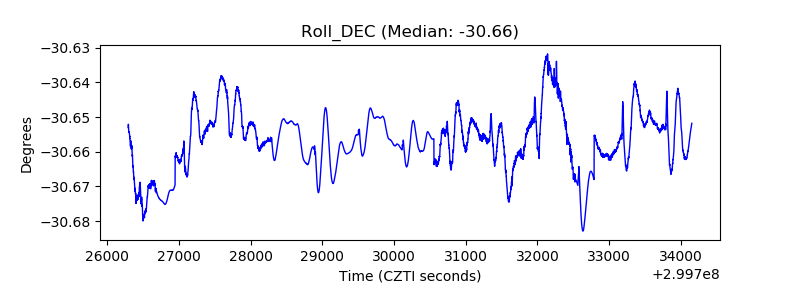 |
| _Roll_RA | 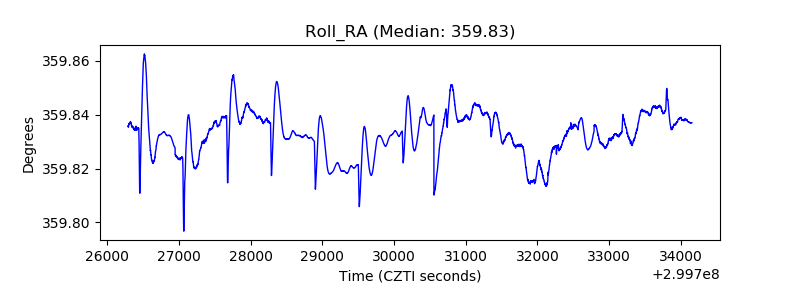 |
| Veto Counter | 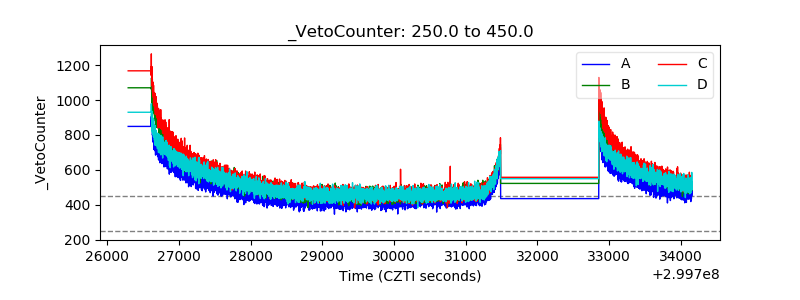 |