| Param | Original file | Final file |
|---|---|---|
| Filename | modeM0/AS1A05_174T01_9000003008_20325cztM0_level2.evt | modeM0/AS1A05_174T01_9000003008_20325cztM0_level2_quad_clean.evt |
| Size (bytes) | 487,016,640 | 89,136,000 |
| Size | 464.5 MB | 85.0 MB |
| Events in quadrant A | 3,557,038 | 562,242 |
| Events in quadrant B | 3,438,982 | 576,962 |
| Events in quadrant C | 3,339,136 | 554,386 |
| Events in quadrant D | 3,955,671 | 535,233 |
| Mode M9 | |||
|---|---|---|---|
| Quadrant | BADHDUFLAG | Total packets | Discarded packets |
| A | 0 | 7 | 0 |
| B | 0 | 7 | 0 |
| C | 0 | 7 | 0 |
| D | 0 | 7 | 0 |
| Mode M0 | |||
|---|---|---|---|
| Quadrant | BADHDUFLAG | Total packets | Discarded packets |
| A | 0 | 14881 | 1 |
| B | 0 | 14464 | 1 |
| C | 0 | 14074 | 1 |
| D | 0 | 16285 | 1 |
| Mode SS | |||
|---|---|---|---|
| Quadrant | BADHDUFLAG | Total packets | Discarded packets |
| A | 0 | 136 | 0 |
| B | 0 | 136 | 0 |
| C | 0 | 136 | 0 |
| D | 0 | 136 | 0 |
| Quadrant | Total seconds | Saturated seconds | Saturation percentage |
|---|---|---|---|
| A | 6749 | 209 | 3.096755% |
| B | 6749 | 135 | 2.000296% |
| C | 6749 | 154 | 2.281820% |
| D | 6749 | 376 | 5.571196% |
Noise dominated data is calculated using 1-second bins in cleaned event files. If a bin has >2000 counts, and if more than 50% of those come from <1% of pixels, then it is considered to be noise-dominated and hence unusable.
| Quadrant | # 1 sec bins | Bins with >0 counts | Bins with >2000 counts | High rate bins dominated by noise | Noise dominated (total time) | Noise dominated (detector-on time) | Marked lightcurve |
|---|---|---|---|---|---|---|---|
| A | 7424 | 6750 | 85 | 85 | 1.14% | 1.26% | 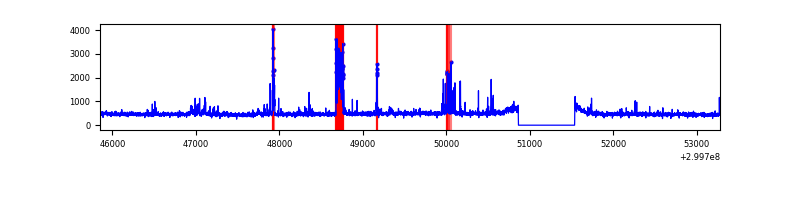 |
| B | 7424 | 6750 | 29 | 29 | 0.39% | 0.43% | 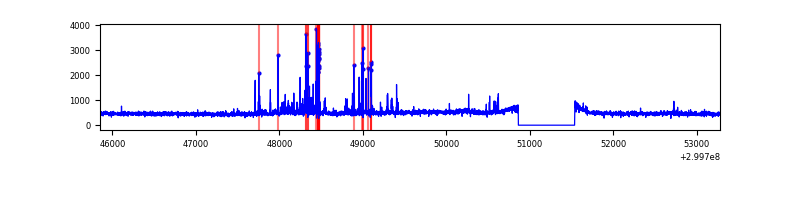 |
| C | 7424 | 6750 | 1 | 1 | 0.01% | 0.01% | 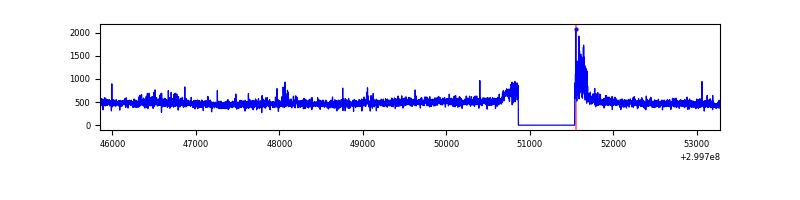 |
| D | 7424 | 6750 | 225 | 225 | 3.03% | 3.33% | 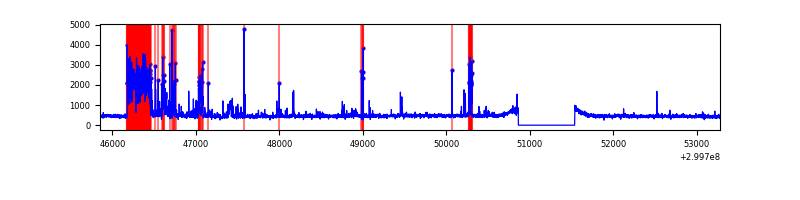 |
Top three noisy pixels from each quadrant. If the there are fewer than three noisy pixels in the level2.evt file, extra rows are filled as -1
| Pixel properties | Quadrant properties | ||||||
|---|---|---|---|---|---|---|---|
| Quadrant | DetID | PixID | Counts | Sigma | Mean | Median | Sigma |
| A | 4 | 2 | 277662 | 1663.46 | 814 | 794 | 166.4 |
| A | 5 | 16 | 112581 | 671.63 | 814 | 794 | 166.4 |
| A | 14 | 238 | 21758 | 125.95 | 814 | 794 | 166.4 |
| B | 7 | 220 | 179638 | 1158.02 | 808 | 788 | 154.4 |
| B | 0 | 214 | 27001 | 169.72 | 808 | 788 | 154.4 |
| B | 0 | 230 | 20168 | 125.48 | 808 | 788 | 154.4 |
| C | 14 | 238 | 124578 | 669.95 | 788 | 795 | 184.8 |
| C | 0 | 207 | 64290 | 343.65 | 788 | 795 | 184.8 |
| C | 3 | 9 | 47640 | 253.54 | 788 | 795 | 184.8 |
| D | 1 | 52 | 812812 | 4182.98 | 801 | 778 | 194.1 |
| D | 9 | 1 | 80371 | 410.0 | 801 | 778 | 194.1 |
| D | 2 | 234 | 26934 | 134.74 | 801 | 778 | 194.1 |
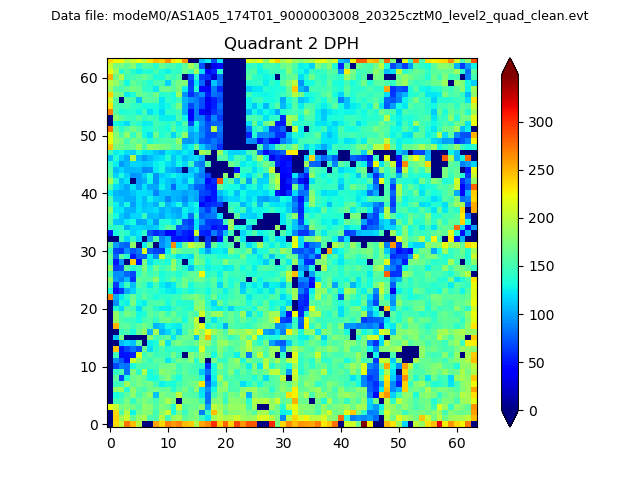
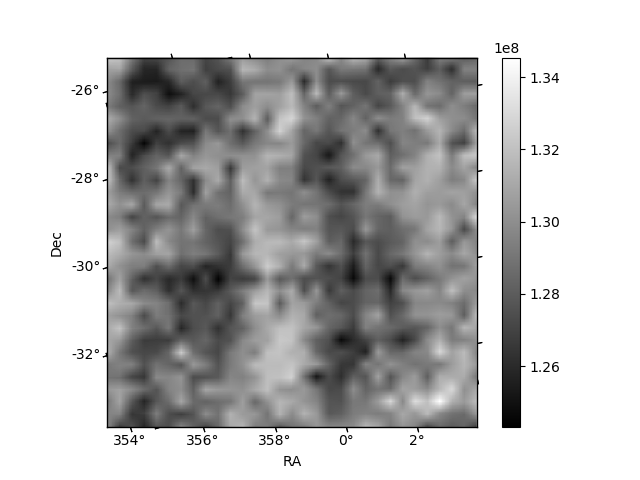
Histogram calculated using DETX and DETY for each event in the final _common_clean file
| Quadrant A | 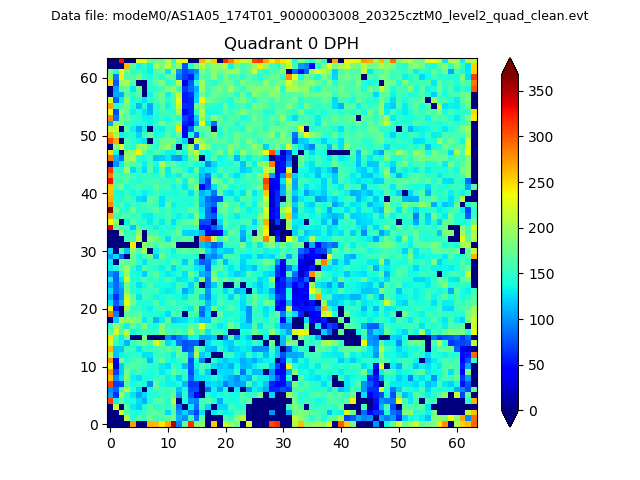 |
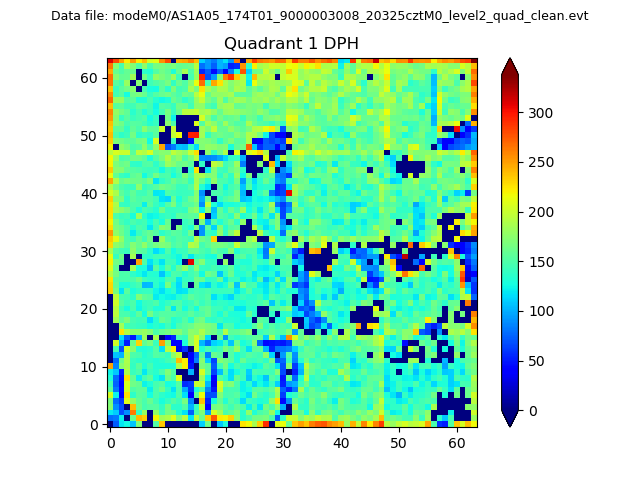 |
Quadrant B |
|---|---|---|---|
| Quadrant D | 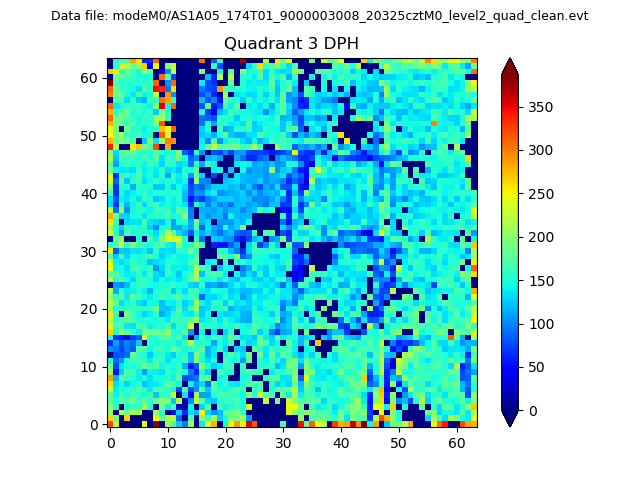 |
 |
Quadrant C |
| Plot type | Count rate plots | Images |
|---|---|---|
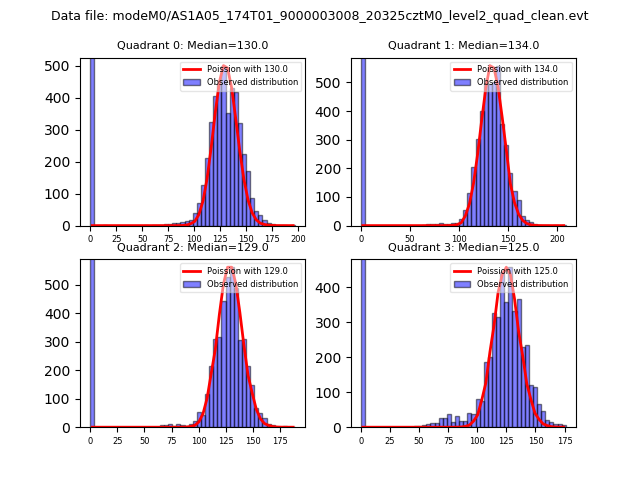
| Comparison with Poisson distribution Blue bars denote a histogram of data divided into 1 sec bins. Red curve is a Poisson curve with rate = median count rate of data. |
 |
 |
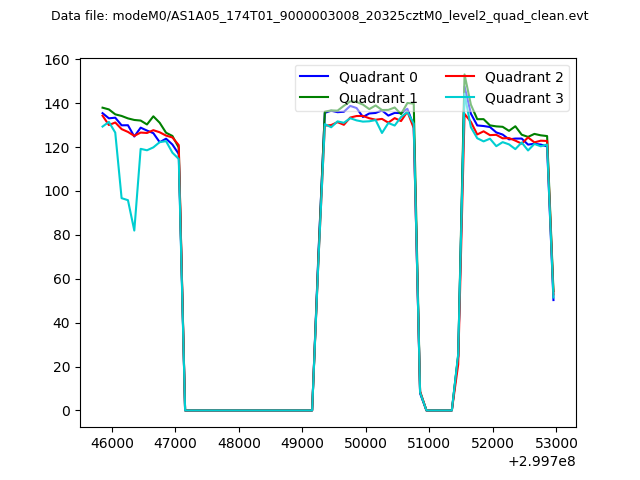
| Quadrant-wise count rates Data is divided into 100 sec bins |
 |
|
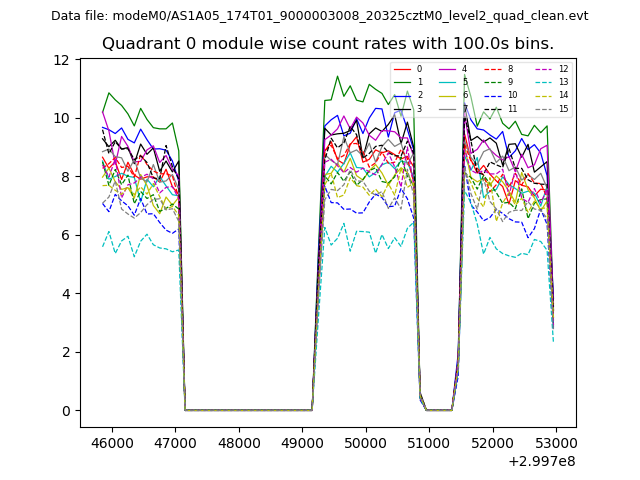
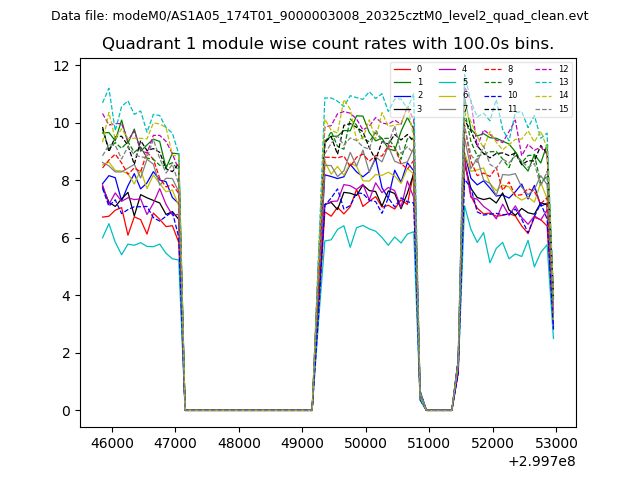
| Module-wise count rates for Quadrant A Data is divided into 100 sec bins |
 |
 |
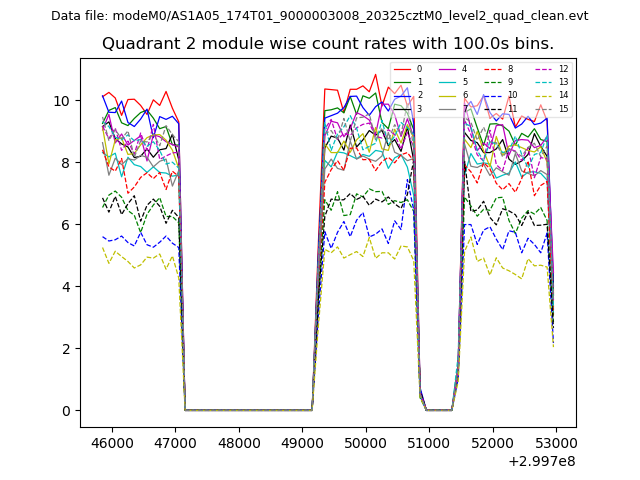
| Module-wise count rates for Quadrant B Data is divided into 100 sec bins |
 |
 |
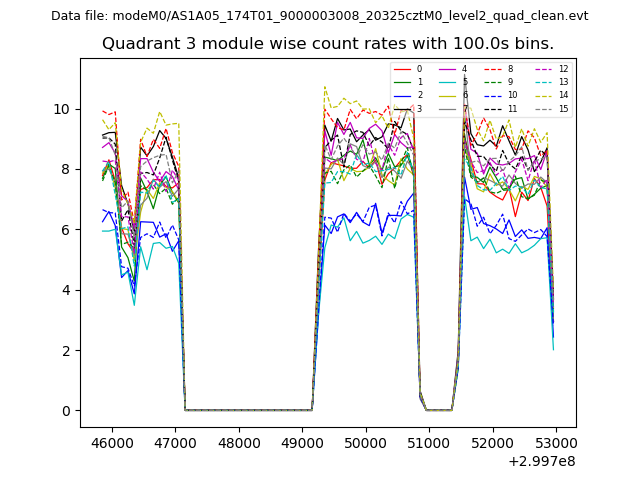
| Module-wise count rates for Quadrant C Data is divided into 100 sec bins |
 |
 |
| Module-wise count rates for Quadrant D Data is divided into 100 sec bins |
 |
 |
| Parameter | Plot |
|---|---|
| CZT HV Monitor | 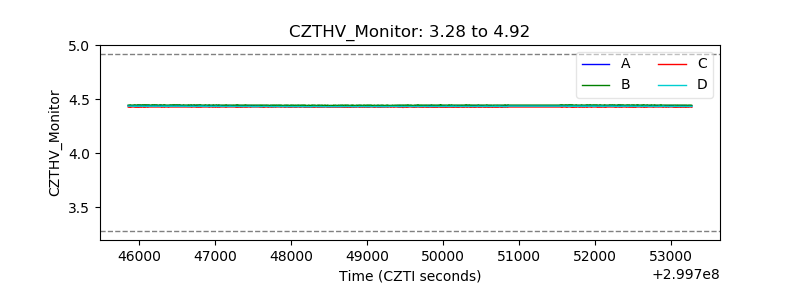 |
| D_VDD | 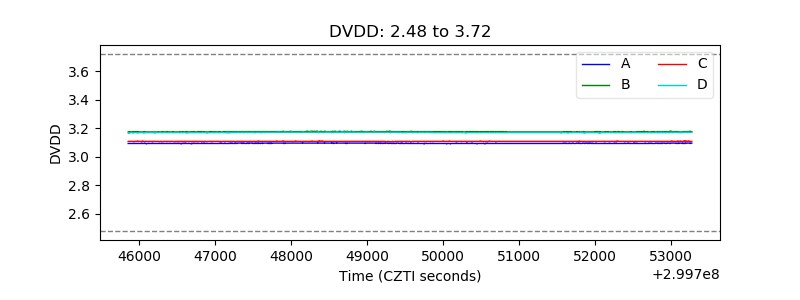 |
| Temperature 1 | 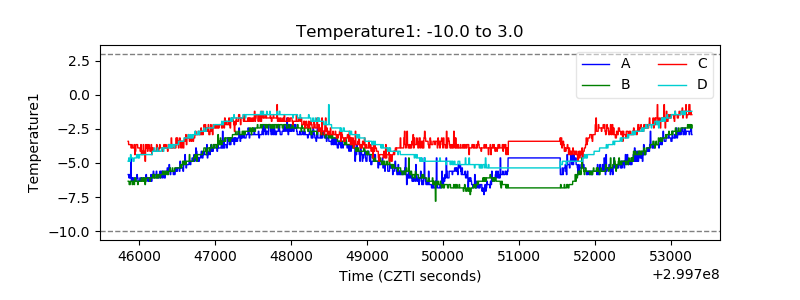 |
| Veto HV Monitor | 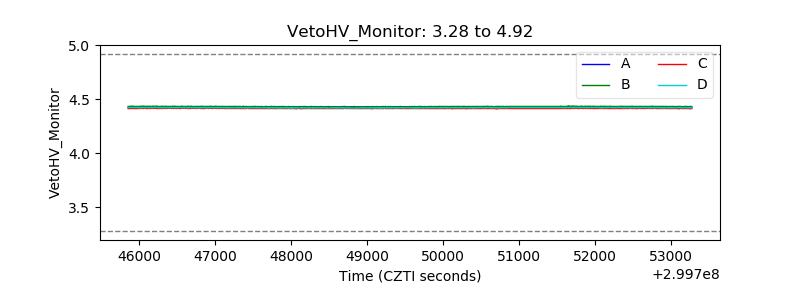 |
| Veto LLD | 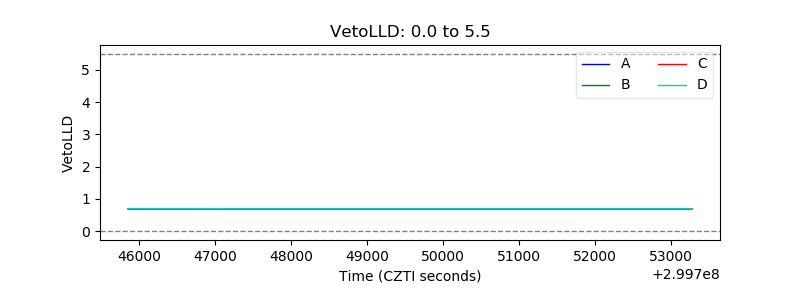 |
| Alpha Counter | 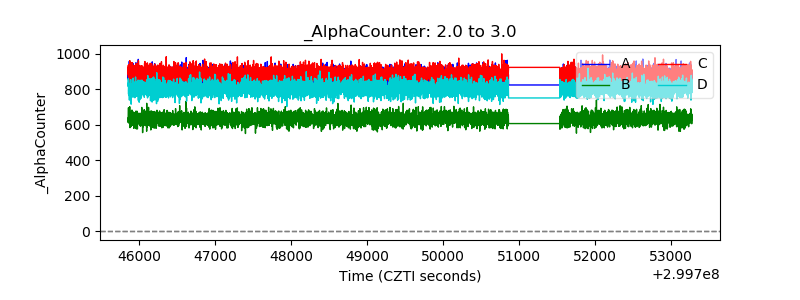 |
| _CPM_Rate | 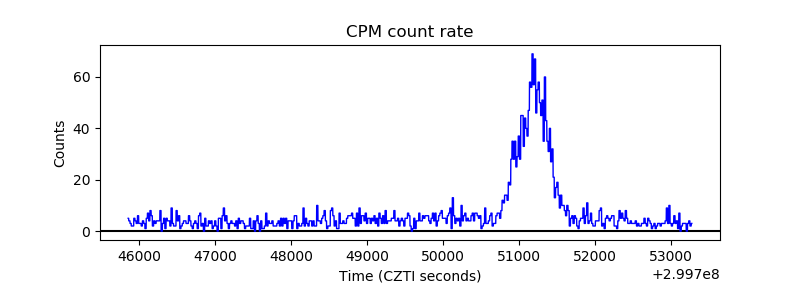 |
| CZT Counter | 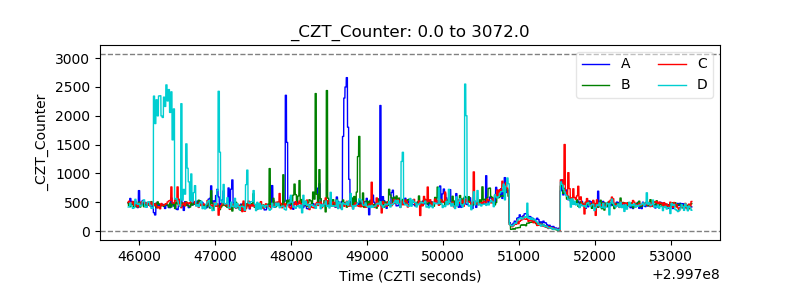 |
| +2.5 Volts monitor | 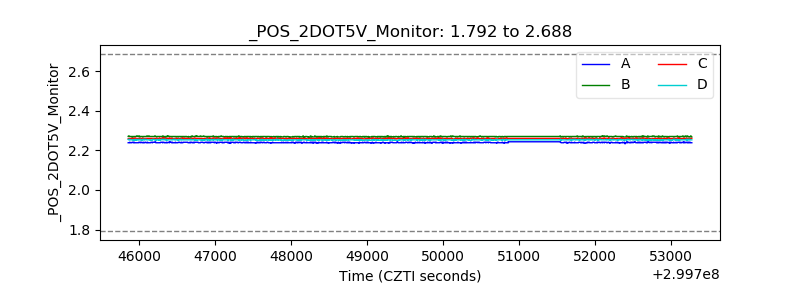 |
| +5 Volts monitor |  |
| _ROLL_ROT | 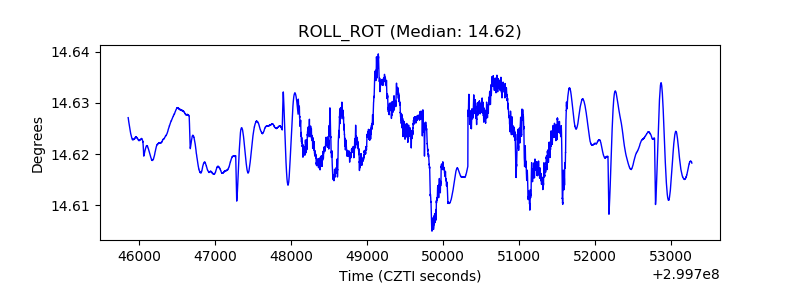 |
| _Roll_DEC | 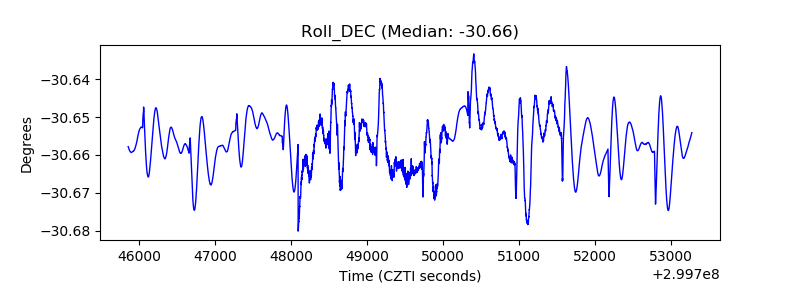 |
| _Roll_RA | 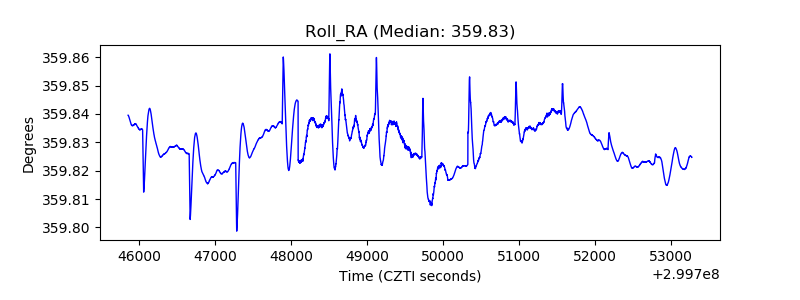 |
| Veto Counter | 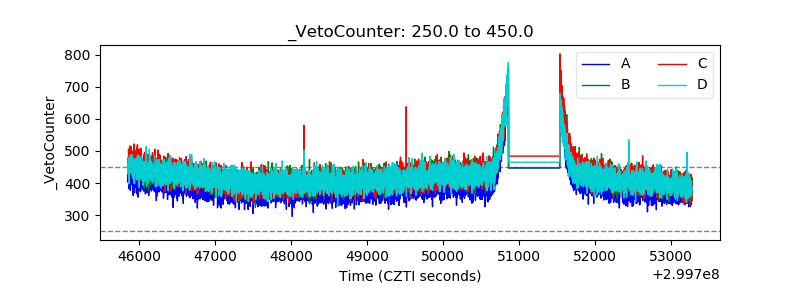 |