| Param | Original file | Final file |
|---|---|---|
| Filename | modeM0/AS1A05_174T01_9000003008_20326cztM0_level2.evt | modeM0/AS1A05_174T01_9000003008_20326cztM0_level2_quad_clean.evt |
| Size (bytes) | 518,492,160 | 95,054,400 |
| Size | 494.5 MB | 90.7 MB |
| Events in quadrant A | 3,569,133 | 590,206 |
| Events in quadrant B | 4,262,268 | 602,595 |
| Events in quadrant C | 3,655,903 | 586,096 |
| Events in quadrant D | 3,705,799 | 578,063 |
| Mode M9 | |||
|---|---|---|---|
| Quadrant | BADHDUFLAG | Total packets | Discarded packets |
| A | 0 | 2 | 0 |
| B | 0 | 2 | 0 |
| C | 0 | 2 | 0 |
| D | 0 | 2 | 0 |
| Mode M0 | |||
|---|---|---|---|
| Quadrant | BADHDUFLAG | Total packets | Discarded packets |
| A | 0 | 15553 | 2 |
| B | 0 | 17373 | 2 |
| C | 0 | 15567 | 2 |
| D | 0 | 16082 | 2 |
| Mode SS | |||
|---|---|---|---|
| Quadrant | BADHDUFLAG | Total packets | Discarded packets |
| A | 0 | 152 | 0 |
| B | 0 | 152 | 0 |
| C | 0 | 152 | 0 |
| D | 0 | 152 | 0 |
| Quadrant | Total seconds | Saturated seconds | Saturation percentage |
|---|---|---|---|
| A | 7491 | 303 | 4.044854% |
| B | 7491 | 480 | 6.407689% |
| C | 7492 | 309 | 4.124399% |
| D | 7492 | 285 | 3.804058% |
Noise dominated data is calculated using 1-second bins in cleaned event files. If a bin has >2000 counts, and if more than 50% of those come from <1% of pixels, then it is considered to be noise-dominated and hence unusable.
| Quadrant | # 1 sec bins | Bins with >0 counts | Bins with >2000 counts | High rate bins dominated by noise | Noise dominated (total time) | Noise dominated (detector-on time) | Marked lightcurve |
|---|---|---|---|---|---|---|---|
| A | 7641 | 7492 | 0 | 0 | 0.00% | 0.00% |  |
| B | 7641 | 7492 | 120 | 120 | 1.57% | 1.60% | 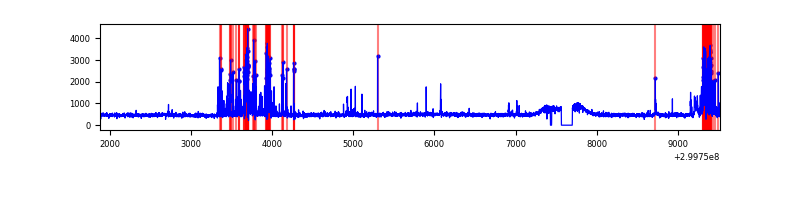 |
| C | 7642 | 7494 | 0 | 0 | 0.00% | 0.00% | 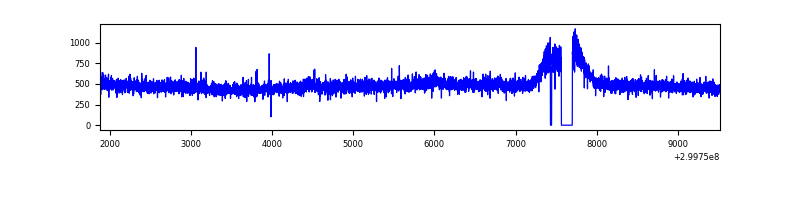 |
| D | 7642 | 7493 | 17 | 17 | 0.22% | 0.23% | 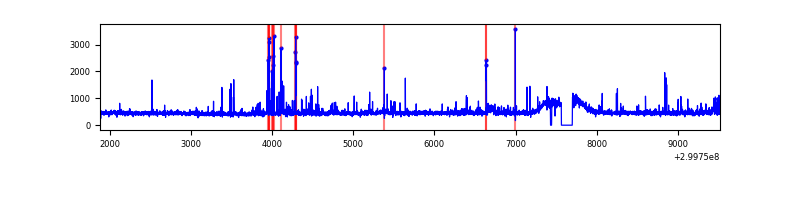 |
Top three noisy pixels from each quadrant. If the there are fewer than three noisy pixels in the level2.evt file, extra rows are filled as -1
| Pixel properties | Quadrant properties | ||||||
|---|---|---|---|---|---|---|---|
| Quadrant | DetID | PixID | Counts | Sigma | Mean | Median | Sigma |
| A | 4 | 2 | 20519 | 104.85 | 918 | 895 | 187.2 |
| A | 13 | 254 | 11055 | 54.28 | 918 | 895 | 187.2 |
| A | 0 | 226 | 7927 | 37.57 | 918 | 895 | 187.2 |
| B | 4 | 142 | 392207 | 2241.1 | 902 | 881 | 174.6 |
| B | 7 | 220 | 227518 | 1297.94 | 902 | 881 | 174.6 |
| B | 3 | 64 | 28539 | 158.4 | 902 | 881 | 174.6 |
| C | 14 | 238 | 136053 | 649.38 | 888 | 893 | 208.1 |
| C | 3 | 9 | 25288 | 117.21 | 888 | 893 | 208.1 |
| C | 10 | 91 | 14925 | 67.42 | 888 | 893 | 208.1 |
| D | 1 | 52 | 137458 | 610.42 | 911 | 883 | 223.7 |
| D | 9 | 1 | 108425 | 480.66 | 911 | 883 | 223.7 |
| D | 2 | 234 | 32950 | 143.32 | 911 | 883 | 223.7 |
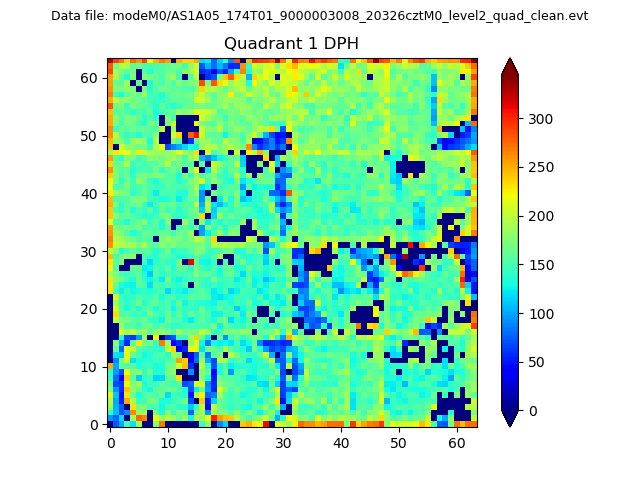
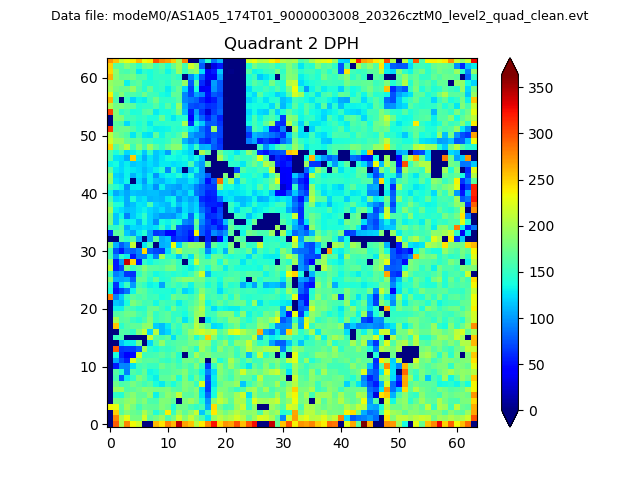
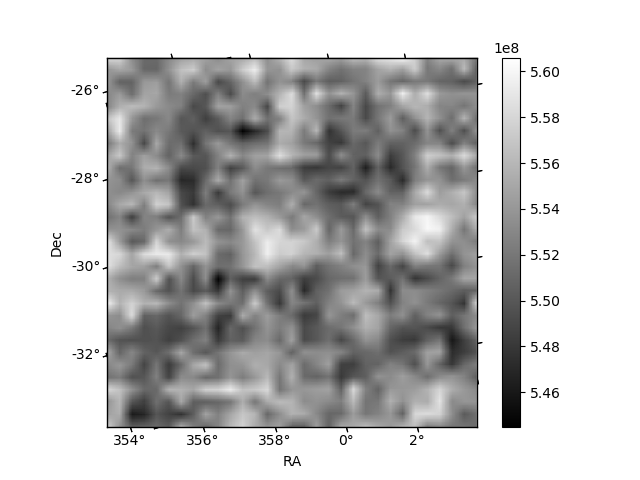
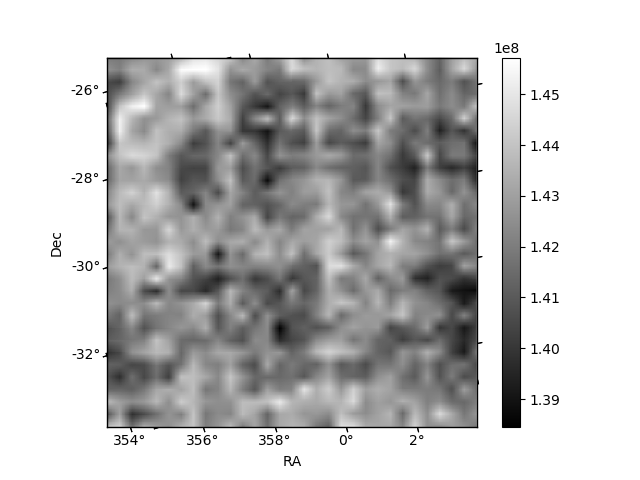
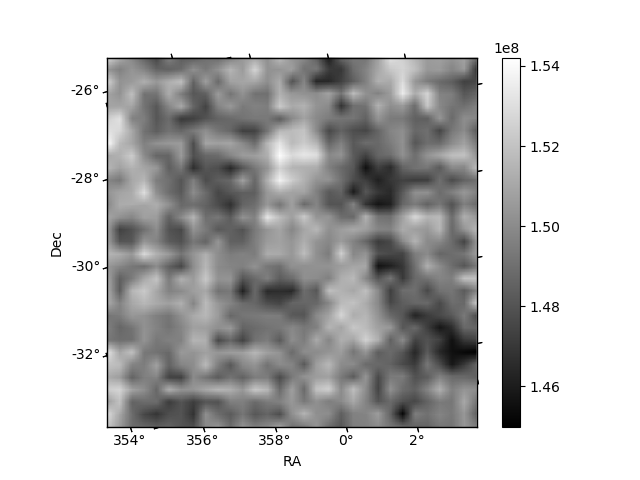
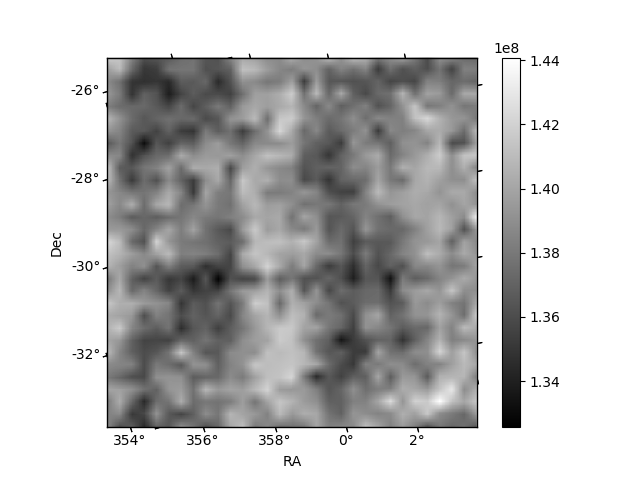
Histogram calculated using DETX and DETY for each event in the final _common_clean file
| Quadrant A | 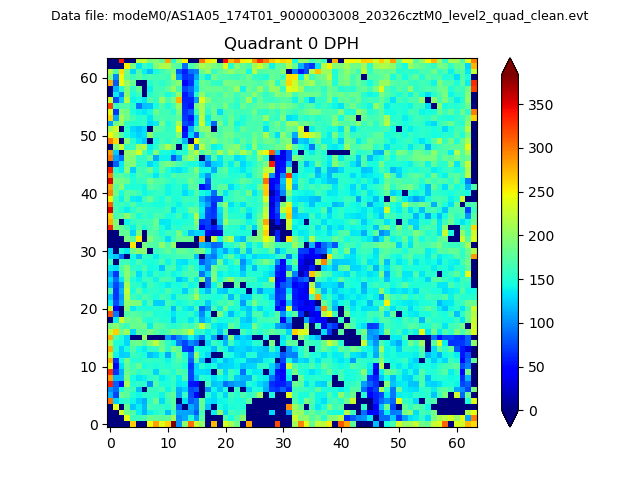 |
 |
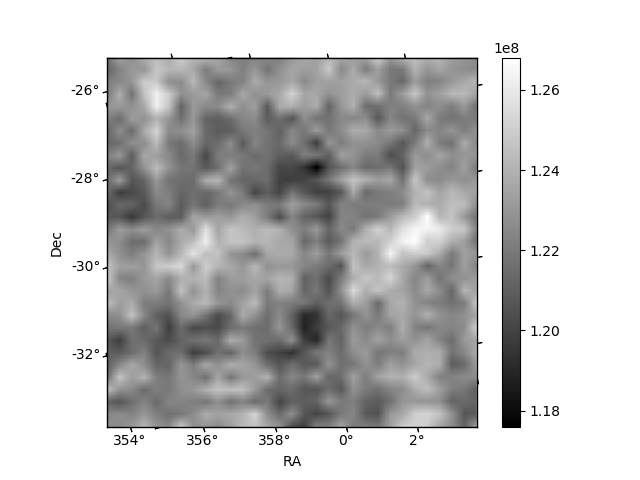
Quadrant B |
|---|---|---|---|
| Quadrant D | 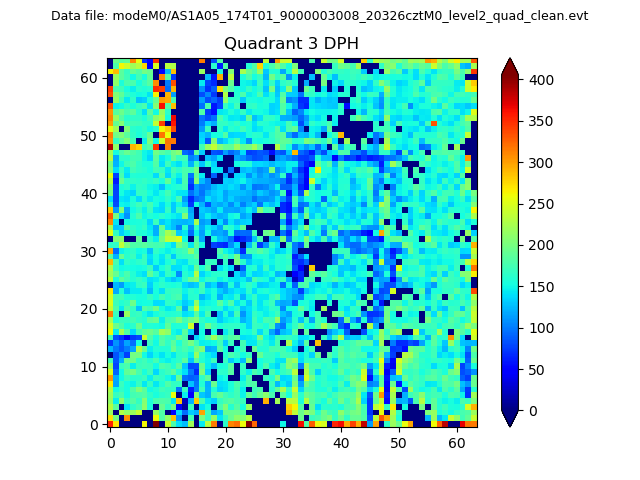 |
 |
Quadrant C |
| Plot type | Count rate plots | Images |
|---|---|---|
| Comparison with Poisson distribution Blue bars denote a histogram of data divided into 1 sec bins. Red curve is a Poisson curve with rate = median count rate of data. |
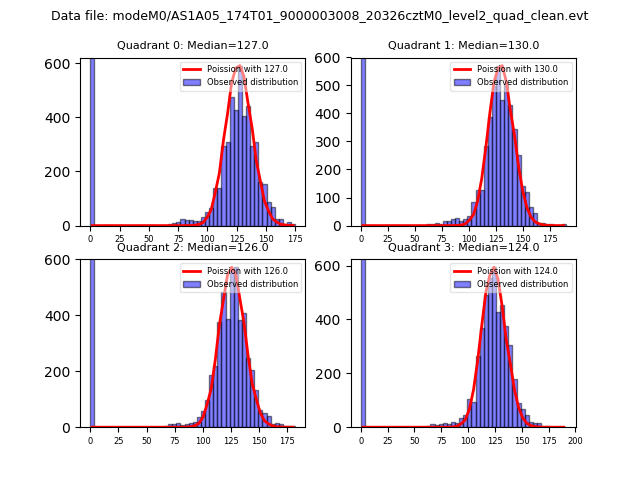 |
 |
| Quadrant-wise count rates Data is divided into 100 sec bins |
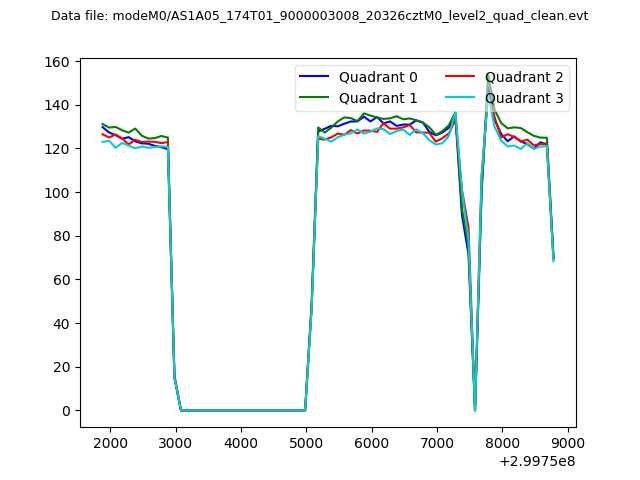 |
|
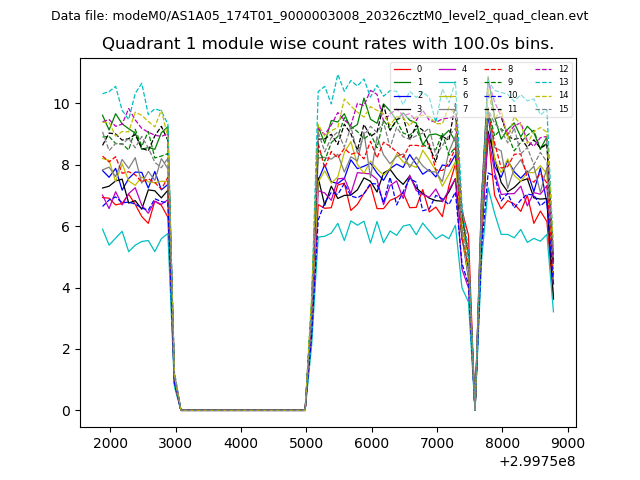
| Module-wise count rates for Quadrant A Data is divided into 100 sec bins |
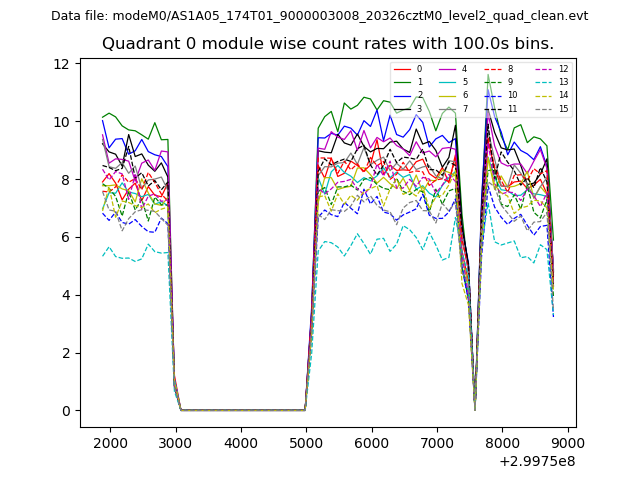 |
 |
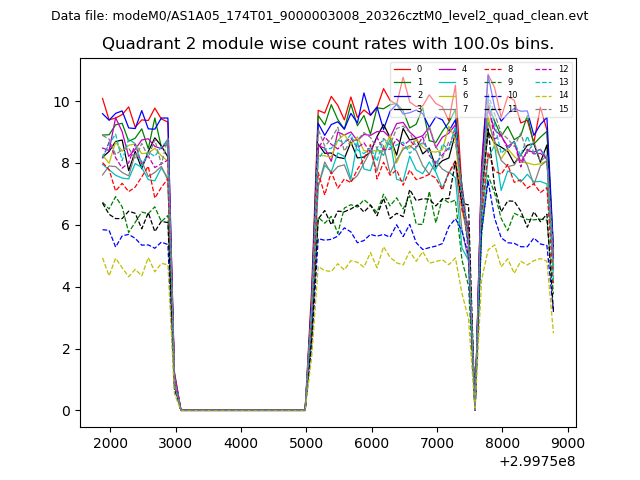
| Module-wise count rates for Quadrant B Data is divided into 100 sec bins |
 |
 |
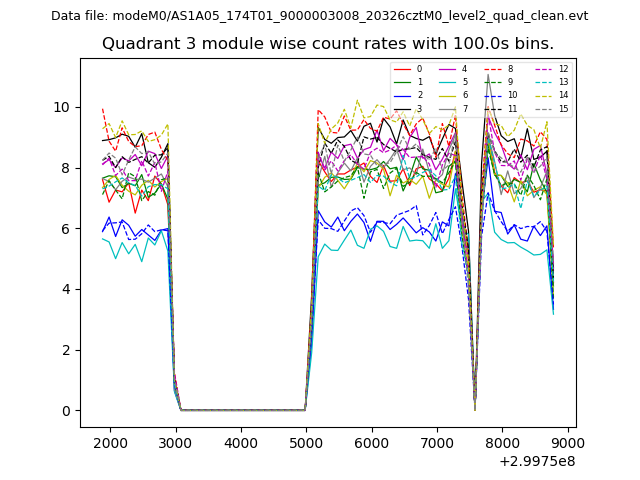
| Module-wise count rates for Quadrant C Data is divided into 100 sec bins |
 |
 |
| Module-wise count rates for Quadrant D Data is divided into 100 sec bins |
 |
 |
| Parameter | Plot |
|---|---|
| CZT HV Monitor | 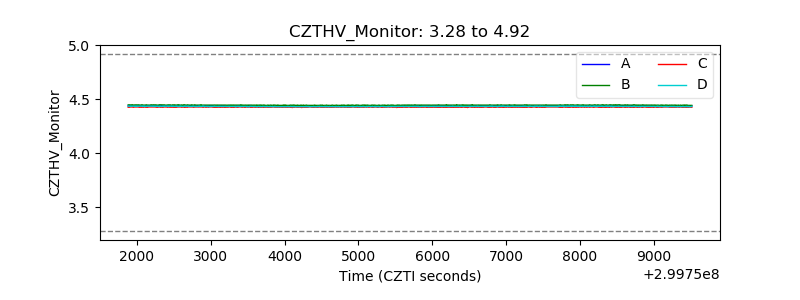 |
| D_VDD | 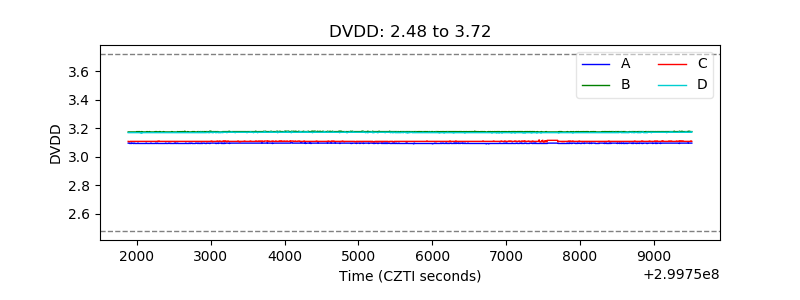 |
| Temperature 1 | 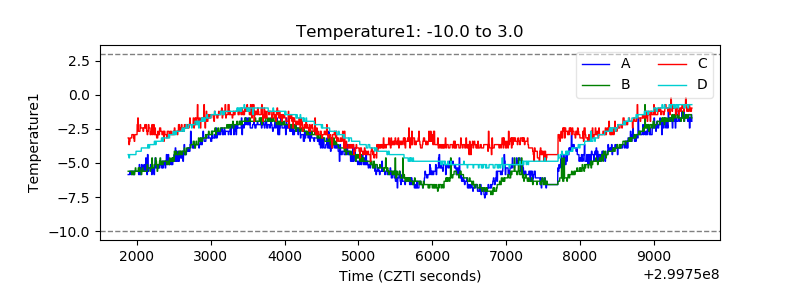 |
| Veto HV Monitor |  |
| Veto LLD | 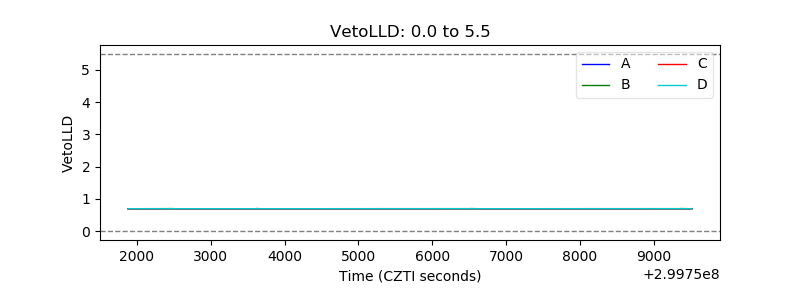 |
| Alpha Counter | 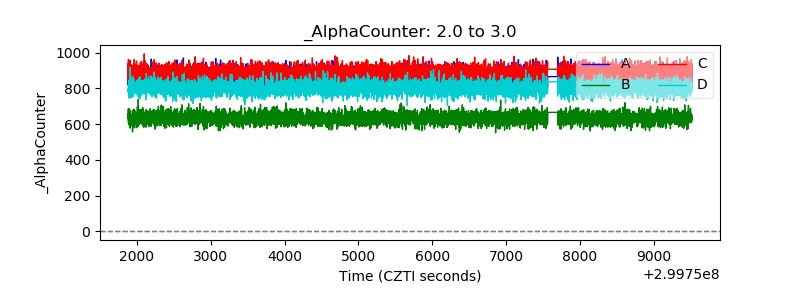 |
| _CPM_Rate | 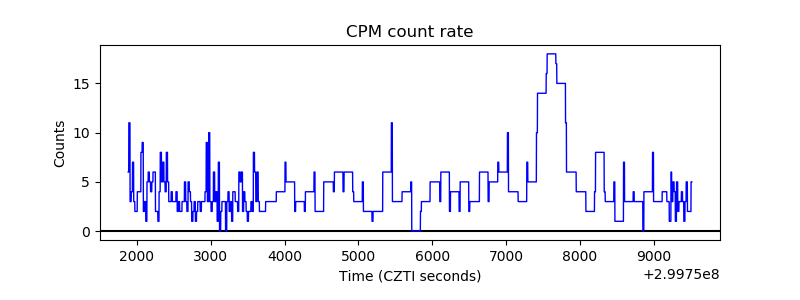 |
| CZT Counter | 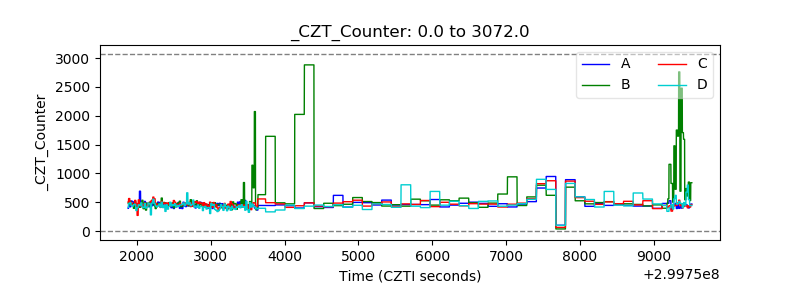 |
| +2.5 Volts monitor |  |
| +5 Volts monitor |  |
| _ROLL_ROT | 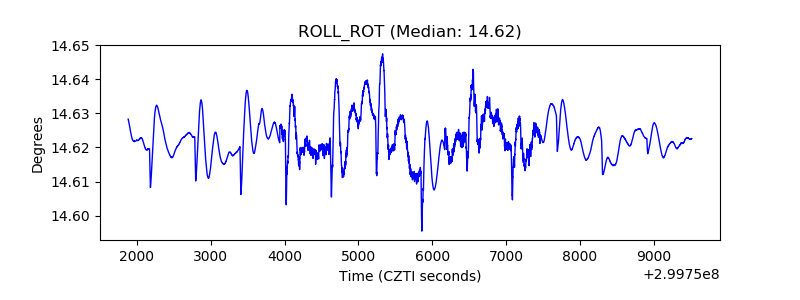 |
| _Roll_DEC | 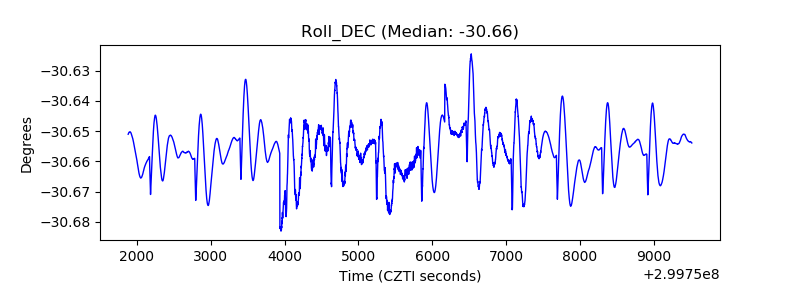 |
| _Roll_RA | 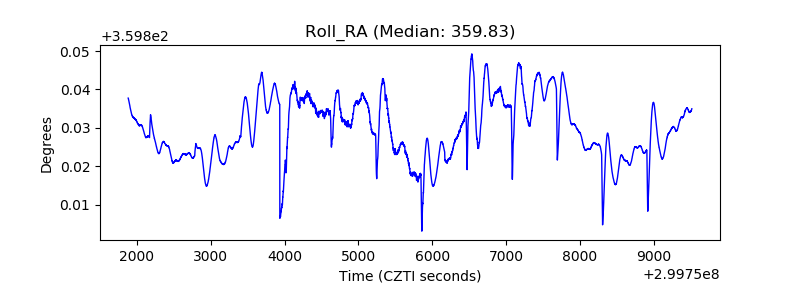 |
| Veto Counter | 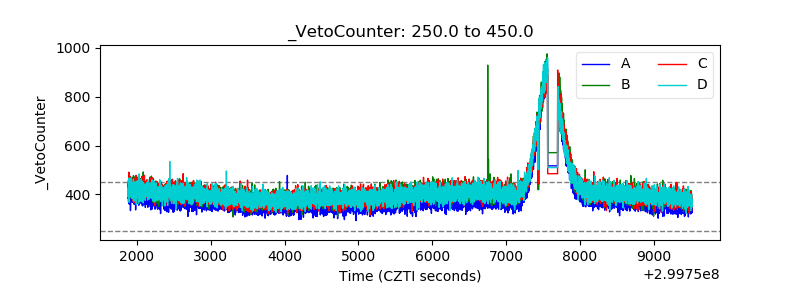 |