| Param | Original file | Final file |
|---|---|---|
| Filename | modeM0/AS1A05_174T01_9000003008_20327cztM0_level2.evt | modeM0/AS1A05_174T01_9000003008_20327cztM0_level2_quad_clean.evt |
| Size (bytes) | 535,916,160 | 91,252,800 |
| Size | 511.1 MB | 87.0 MB |
| Events in quadrant A | 3,661,924 | 563,521 |
| Events in quadrant B | 4,628,587 | 571,000 |
| Events in quadrant C | 3,619,333 | 555,799 |
| Events in quadrant D | 3,810,777 | 550,678 |
| Mode M9 | |||
|---|---|---|---|
| Quadrant | BADHDUFLAG | Total packets | Discarded packets |
| A | 0 | 2 | 0 |
| B | 0 | 2 | 0 |
| C | 0 | 2 | 0 |
| D | 0 | 2 | 0 |
| Mode M0 | |||
|---|---|---|---|
| Quadrant | BADHDUFLAG | Total packets | Discarded packets |
| A | 0 | 15777 | 1 |
| B | 0 | 18478 | 1 |
| C | 0 | 15501 | 1 |
| D | 0 | 16369 | 2 |
| Mode SS | |||
|---|---|---|---|
| Quadrant | BADHDUFLAG | Total packets | Discarded packets |
| A | 0 | 152 | 0 |
| B | 0 | 152 | 0 |
| C | 0 | 152 | 0 |
| D | 0 | 152 | 0 |
| Quadrant | Total seconds | Saturated seconds | Saturation percentage |
|---|---|---|---|
| A | 7502 | 198 | 2.639296% |
| B | 7503 | 503 | 6.703985% |
| C | 7503 | 191 | 2.545648% |
| D | 7502 | 185 | 2.466009% |
Noise dominated data is calculated using 1-second bins in cleaned event files. If a bin has >2000 counts, and if more than 50% of those come from <1% of pixels, then it is considered to be noise-dominated and hence unusable.
| Quadrant | # 1 sec bins | Bins with >0 counts | Bins with >2000 counts | High rate bins dominated by noise | Noise dominated (total time) | Noise dominated (detector-on time) | Marked lightcurve |
|---|---|---|---|---|---|---|---|
| A | 7697 | 7503 | 5 | 5 | 0.06% | 0.07% | 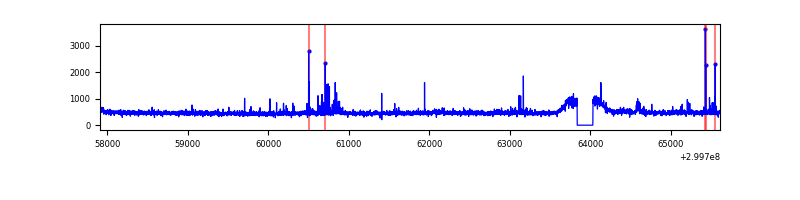 |
| B | 7698 | 7504 | 199 | 199 | 2.59% | 2.65% |  |
| C | 7698 | 7504 | 0 | 0 | 0.00% | 0.00% | 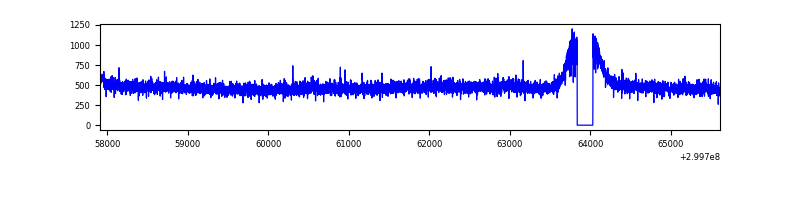 |
| D | 7697 | 7503 | 38 | 38 | 0.49% | 0.51% | 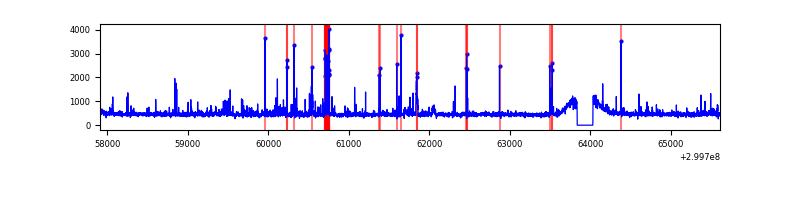 |
Top three noisy pixels from each quadrant. If the there are fewer than three noisy pixels in the level2.evt file, extra rows are filled as -1
| Pixel properties | Quadrant properties | ||||||
|---|---|---|---|---|---|---|---|
| Quadrant | DetID | PixID | Counts | Sigma | Mean | Median | Sigma |
| A | 4 | 2 | 54840 | 288.99 | 918 | 895 | 186.7 |
| A | 5 | 16 | 32369 | 168.61 | 918 | 895 | 186.7 |
| A | 14 | 238 | 25769 | 133.25 | 918 | 895 | 186.7 |
| B | 4 | 142 | 702120 | 4006.01 | 898 | 873 | 175.0 |
| B | 7 | 220 | 210365 | 1196.76 | 898 | 873 | 175.0 |
| B | 0 | 197 | 99654 | 564.31 | 898 | 873 | 175.0 |
| C | 14 | 238 | 136383 | 649.1 | 883 | 888 | 208.7 |
| C | 3 | 9 | 21137 | 97.0 | 883 | 888 | 208.7 |
| C | 3 | 233 | 14819 | 66.74 | 883 | 888 | 208.7 |
| D | 1 | 52 | 219788 | 986.63 | 906 | 880 | 221.9 |
| D | 13 | 138 | 68531 | 304.91 | 906 | 880 | 221.9 |
| D | 9 | 1 | 56288 | 249.73 | 906 | 880 | 221.9 |
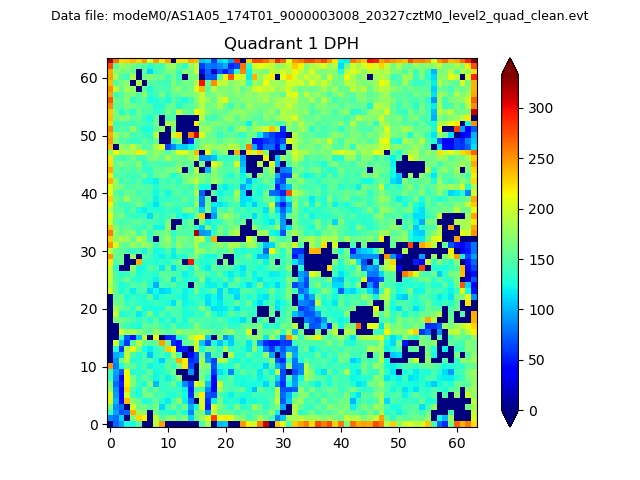
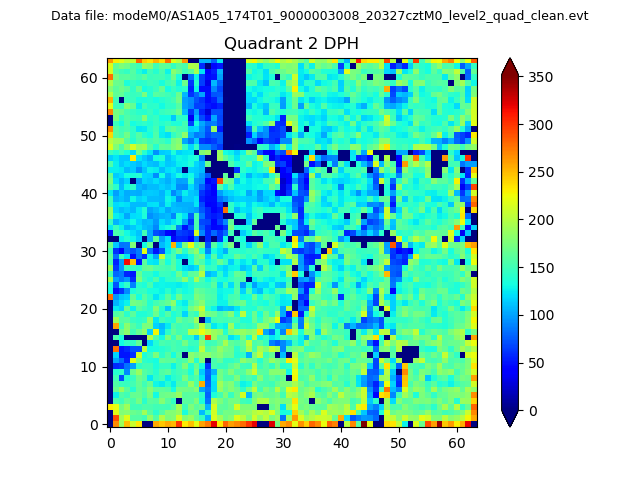
Histogram calculated using DETX and DETY for each event in the final _common_clean file
| Quadrant A | 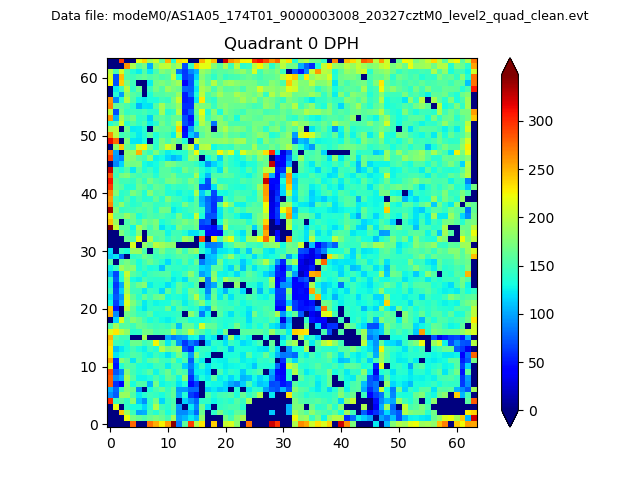 |
 |
Quadrant B |
|---|---|---|---|
| Quadrant D | 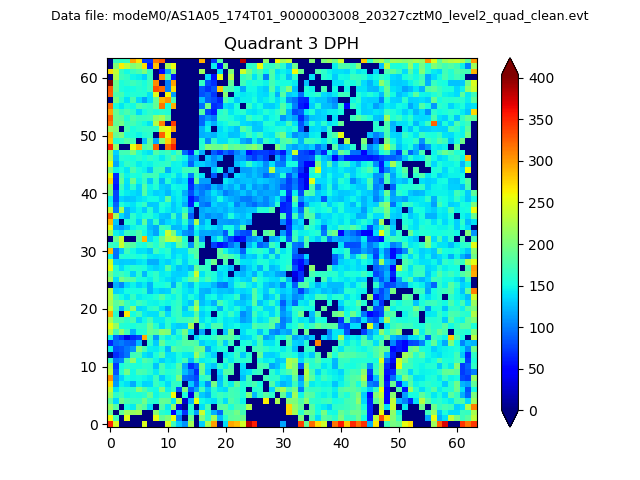 |
 |
Quadrant C |
| Plot type | Count rate plots | Images |
|---|---|---|
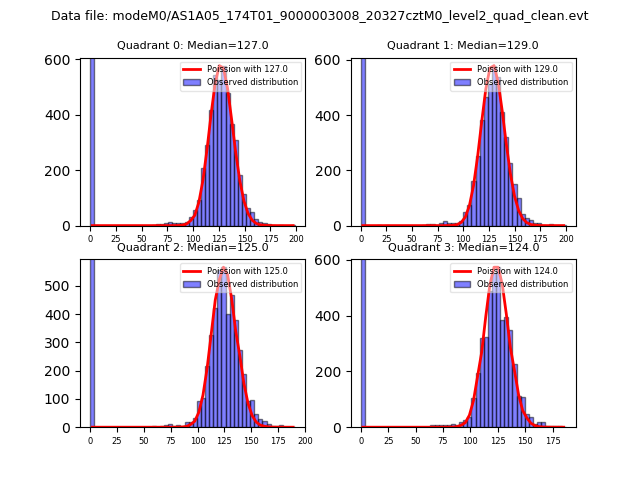
| Comparison with Poisson distribution Blue bars denote a histogram of data divided into 1 sec bins. Red curve is a Poisson curve with rate = median count rate of data. |
 |
 |
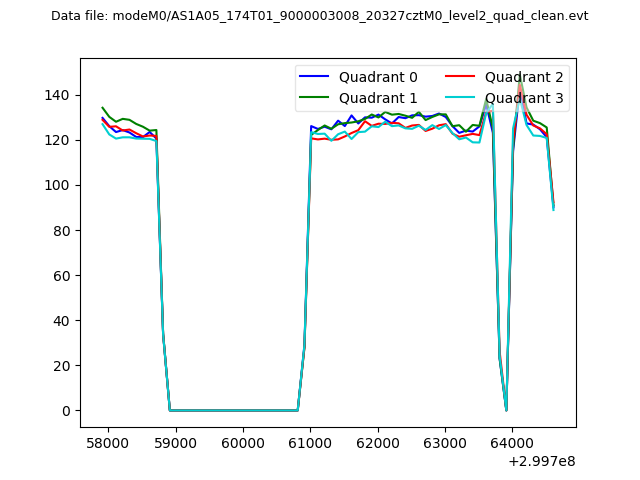
| Quadrant-wise count rates Data is divided into 100 sec bins |
 |
|
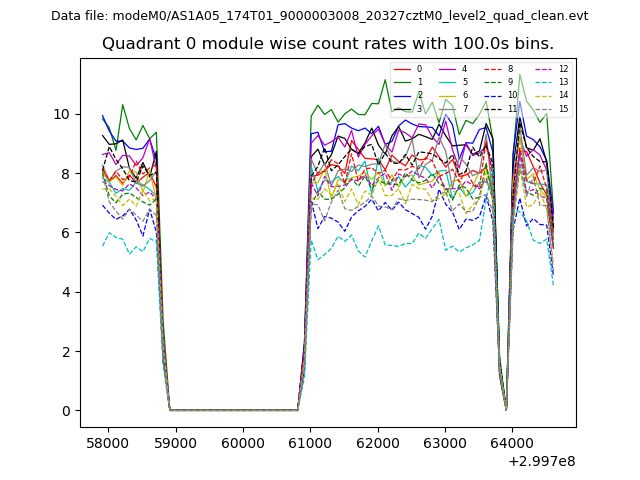
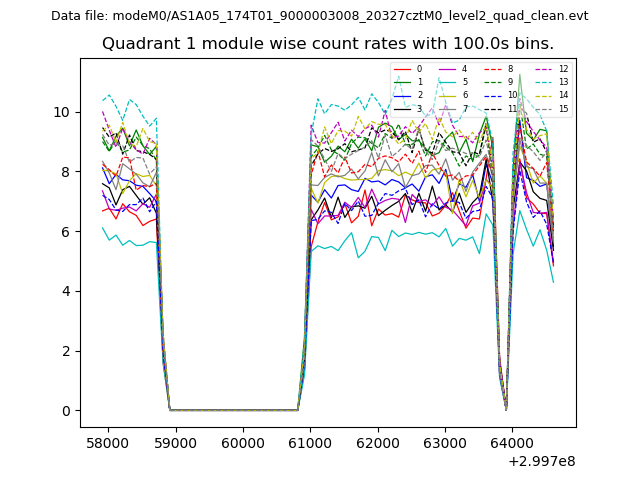
| Module-wise count rates for Quadrant A Data is divided into 100 sec bins |
 |
 |
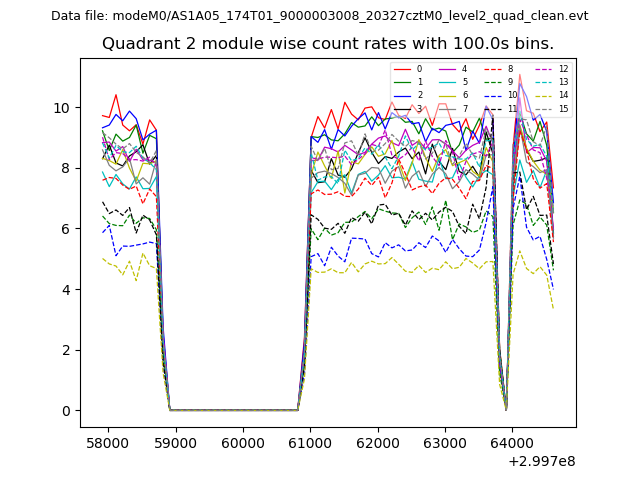
| Module-wise count rates for Quadrant B Data is divided into 100 sec bins |
 |
 |
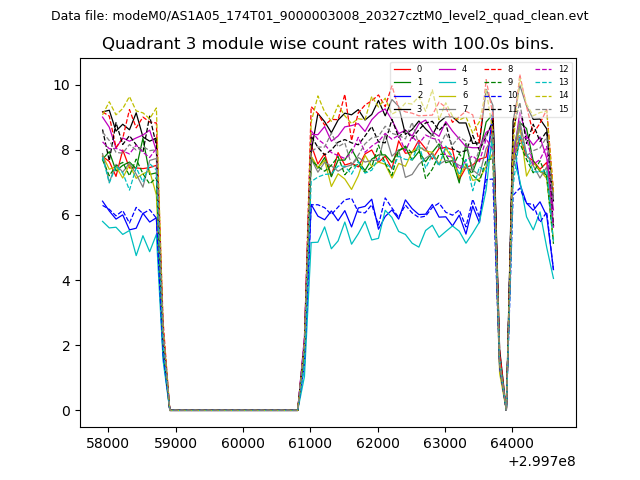
| Module-wise count rates for Quadrant C Data is divided into 100 sec bins |
 |
 |
| Module-wise count rates for Quadrant D Data is divided into 100 sec bins |
 |
 |
| Parameter | Plot |
|---|---|
| CZT HV Monitor | 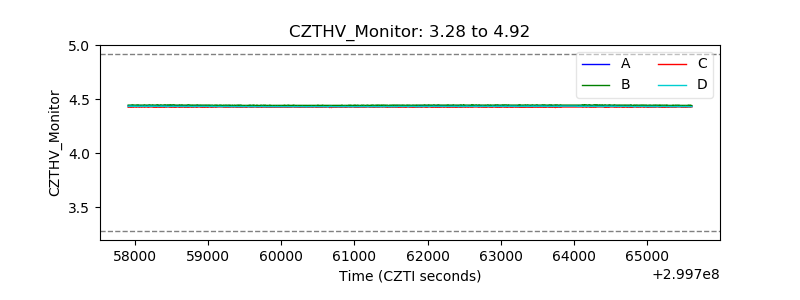 |
| D_VDD |  |
| Temperature 1 | 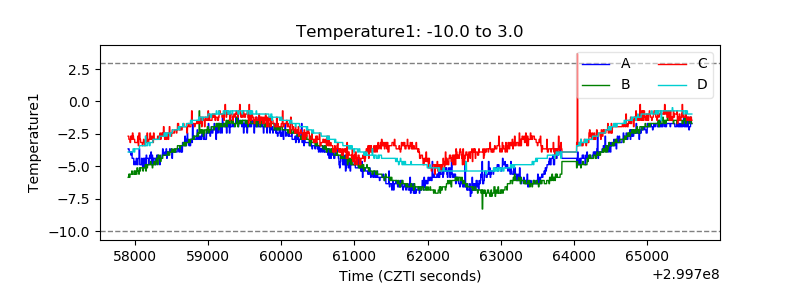 |
| Veto HV Monitor | 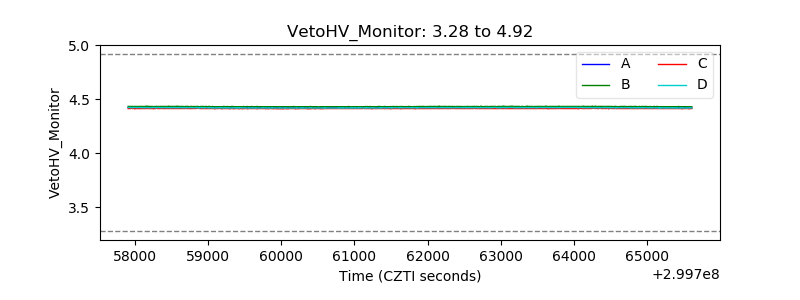 |
| Veto LLD | 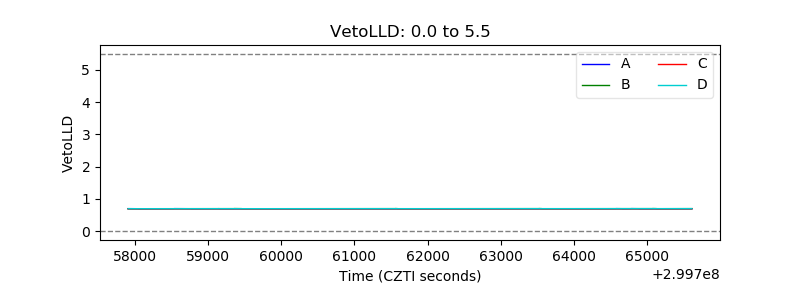 |
| Alpha Counter | 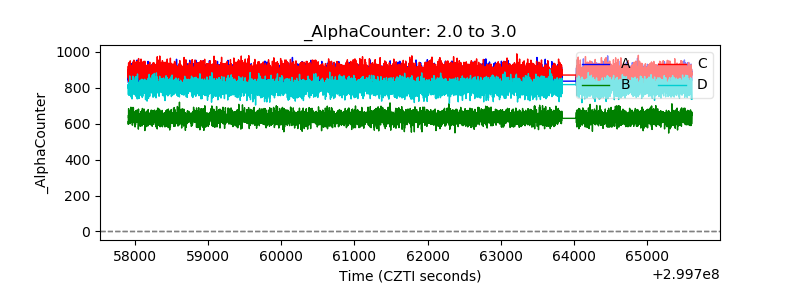 |
| _CPM_Rate | 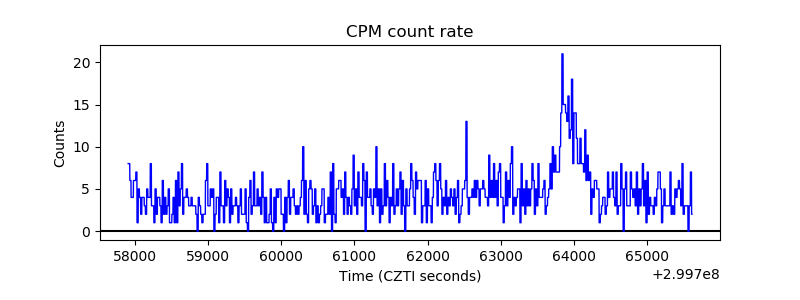 |
| CZT Counter | 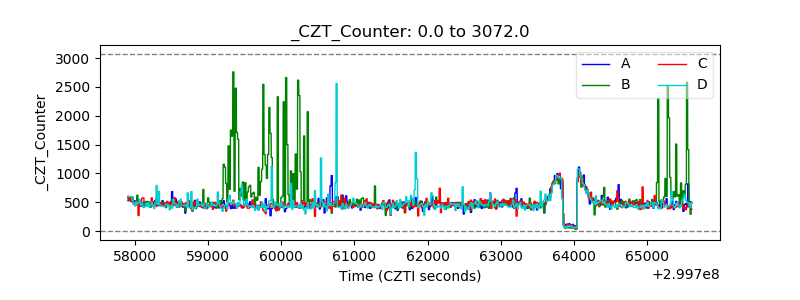 |
| +2.5 Volts monitor |  |
| +5 Volts monitor | 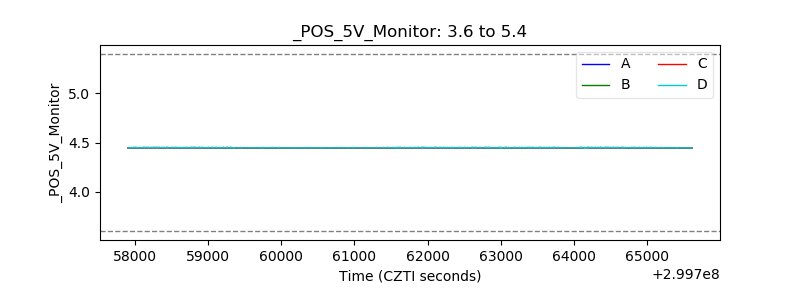 |
| _ROLL_ROT | 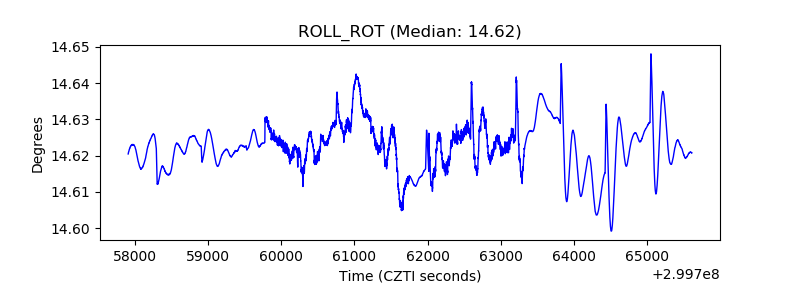 |
| _Roll_DEC | 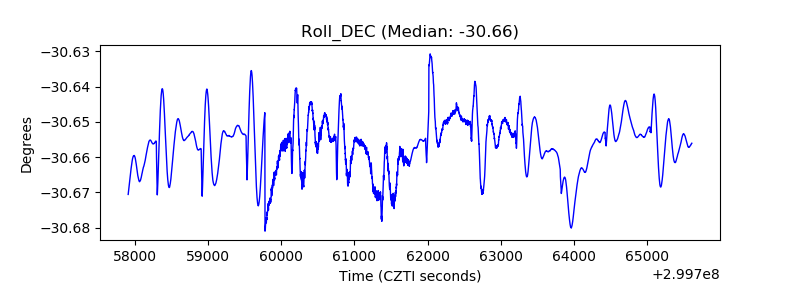 |
| _Roll_RA | 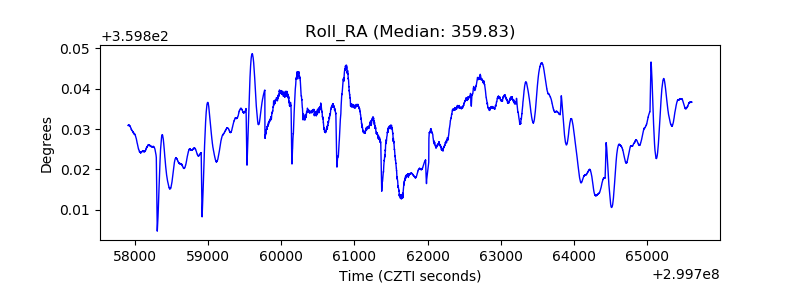 |
| Veto Counter | 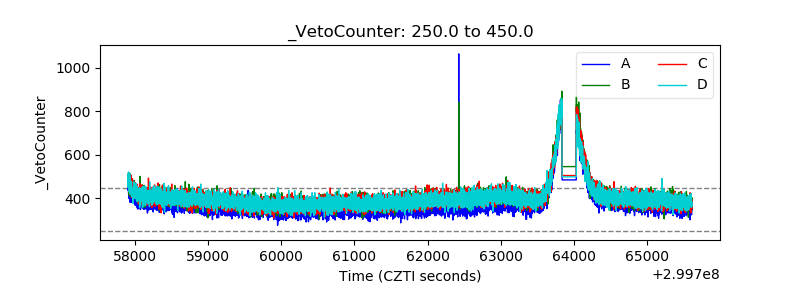 |