| Param | Original file | Final file |
|---|---|---|
| Filename | modeM0/AS1A05_174T01_9000003008_20328cztM0_level2.evt | modeM0/AS1A05_174T01_9000003008_20328cztM0_level2_quad_clean.evt |
| Size (bytes) | 562,907,520 | 83,030,400 |
| Size | 536.8 MB | 79.2 MB |
| Events in quadrant A | 4,600,539 | 501,222 |
| Events in quadrant B | 4,490,538 | 509,505 |
| Events in quadrant C | 3,607,783 | 492,625 |
| Events in quadrant D | 3,840,482 | 489,620 |
| Mode M9 | |||
|---|---|---|---|
| Quadrant | BADHDUFLAG | Total packets | Discarded packets |
| A | 0 | 7 | 0 |
| B | 0 | 7 | 0 |
| C | 0 | 7 | 0 |
| D | 0 | 7 | 0 |
| Mode M0 | |||
|---|---|---|---|
| Quadrant | BADHDUFLAG | Total packets | Discarded packets |
| A | 0 | 18542 | 2 |
| B | 0 | 18110 | 2 |
| C | 0 | 15558 | 2 |
| D | 0 | 16421 | 2 |
| Mode SS | |||
|---|---|---|---|
| Quadrant | BADHDUFLAG | Total packets | Discarded packets |
| A | 0 | 152 | 0 |
| B | 0 | 152 | 0 |
| C | 0 | 152 | 0 |
| D | 0 | 152 | 0 |
| Quadrant | Total seconds | Saturated seconds | Saturation percentage |
|---|---|---|---|
| A | 7491 | 572 | 7.635830% |
| B | 7492 | 423 | 5.646022% |
| C | 7492 | 203 | 2.709557% |
| D | 7492 | 148 | 1.975440% |
Noise dominated data is calculated using 1-second bins in cleaned event files. If a bin has >2000 counts, and if more than 50% of those come from <1% of pixels, then it is considered to be noise-dominated and hence unusable.
| Quadrant | # 1 sec bins | Bins with >0 counts | Bins with >2000 counts | High rate bins dominated by noise | Noise dominated (total time) | Noise dominated (detector-on time) | Marked lightcurve |
|---|---|---|---|---|---|---|---|
| A | 8091 | 7493 | 282 | 282 | 3.49% | 3.76% | 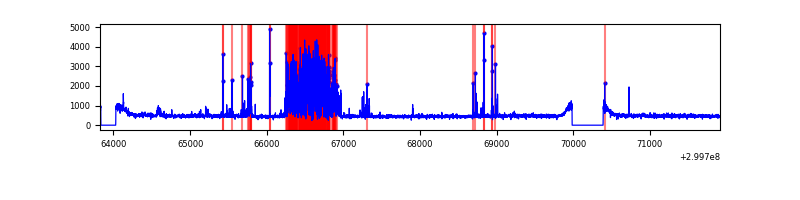 |
| B | 8092 | 7494 | 144 | 144 | 1.78% | 1.92% | 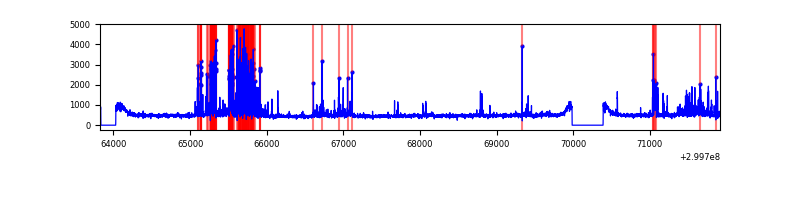 |
| C | 8092 | 7494 | 1 | 1 | 0.01% | 0.01% | 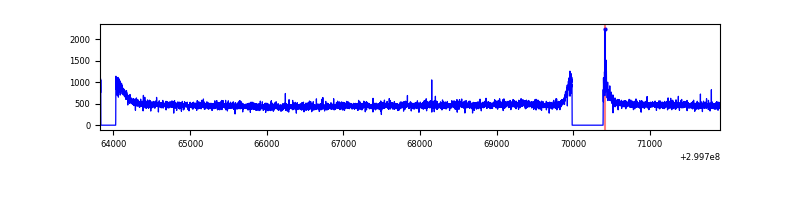 |
| D | 8092 | 7494 | 27 | 27 | 0.33% | 0.36% |  |
Top three noisy pixels from each quadrant. If the there are fewer than three noisy pixels in the level2.evt file, extra rows are filled as -1
| Pixel properties | Quadrant properties | ||||||
|---|---|---|---|---|---|---|---|
| Quadrant | DetID | PixID | Counts | Sigma | Mean | Median | Sigma |
| A | 14 | 238 | 946130 | 5180.3 | 898 | 877 | 182.5 |
| A | 5 | 16 | 169979 | 926.74 | 898 | 877 | 182.5 |
| A | 5 | 168 | 11857 | 60.17 | 898 | 877 | 182.5 |
| B | 4 | 142 | 469290 | 2665.27 | 903 | 879 | 175.7 |
| B | 7 | 220 | 275641 | 1563.4 | 903 | 879 | 175.7 |
| B | 0 | 197 | 63833 | 358.21 | 903 | 879 | 175.7 |
| C | 14 | 238 | 135457 | 642.14 | 882 | 887 | 209.6 |
| C | 0 | 207 | 17163 | 77.67 | 882 | 887 | 209.6 |
| C | 3 | 9 | 10854 | 47.56 | 882 | 887 | 209.6 |
| D | 1 | 52 | 277303 | 1233.1 | 906 | 877 | 224.2 |
| D | 9 | 1 | 89393 | 394.86 | 906 | 877 | 224.2 |
| D | 2 | 234 | 36026 | 156.79 | 906 | 877 | 224.2 |
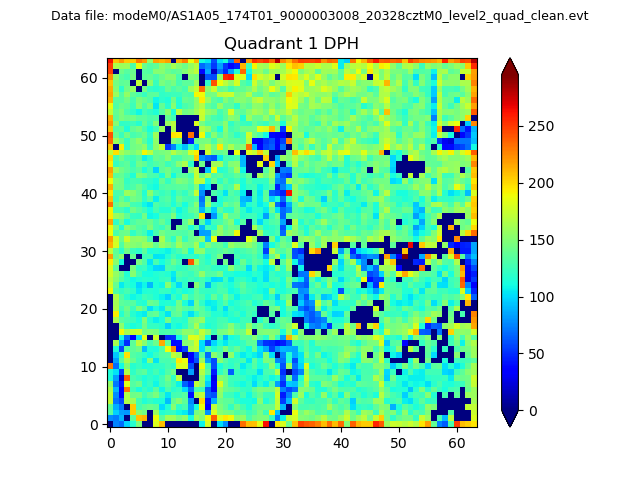
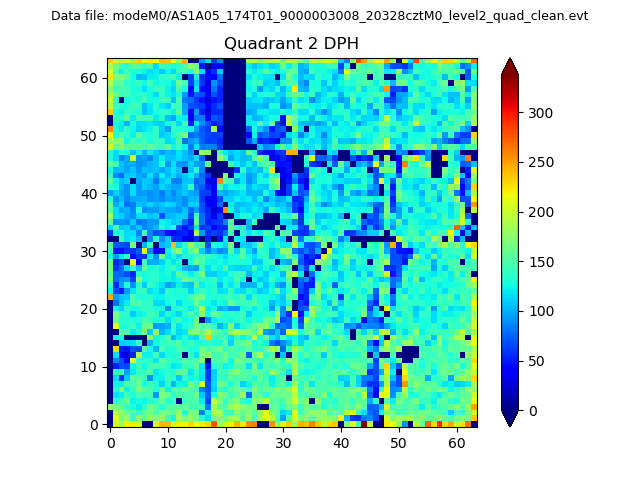
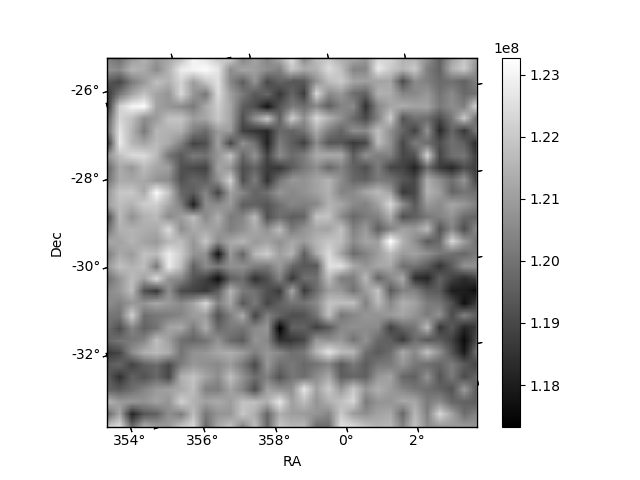
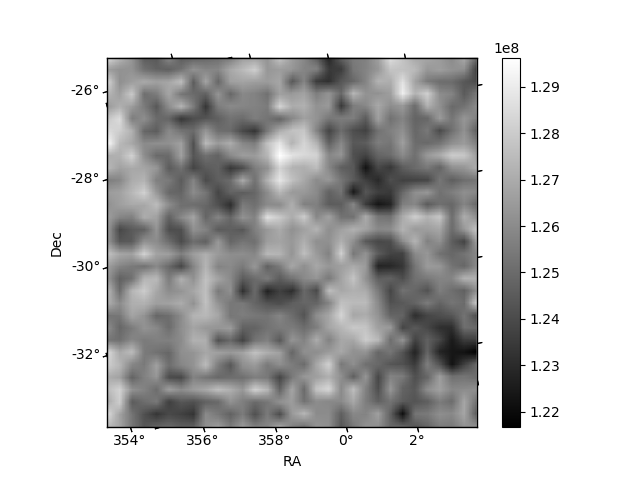
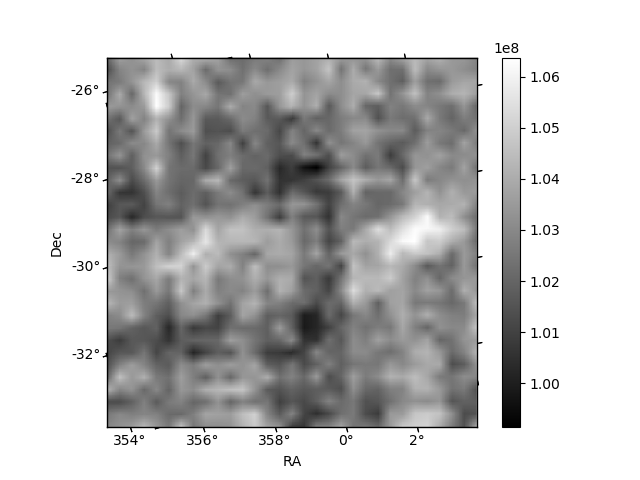
Histogram calculated using DETX and DETY for each event in the final _common_clean file
| Quadrant A | 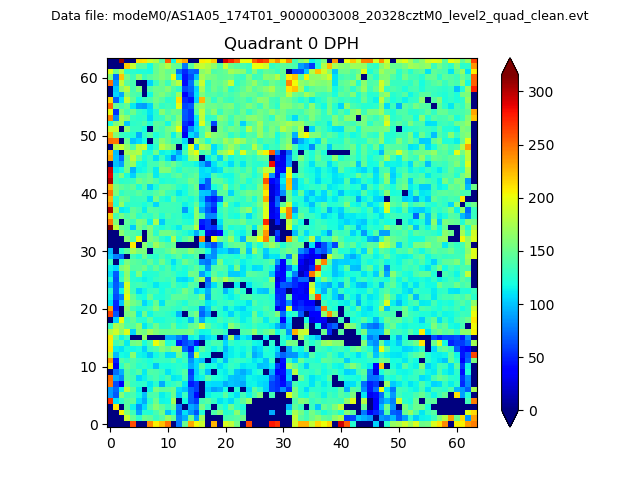 |
 |
Quadrant B |
|---|---|---|---|
| Quadrant D | 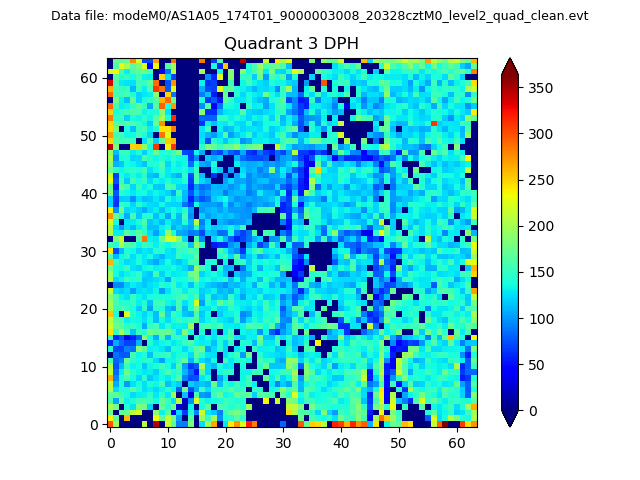 |
 |
Quadrant C |
| Plot type | Count rate plots | Images |
|---|---|---|
| Comparison with Poisson distribution Blue bars denote a histogram of data divided into 1 sec bins. Red curve is a Poisson curve with rate = median count rate of data. |
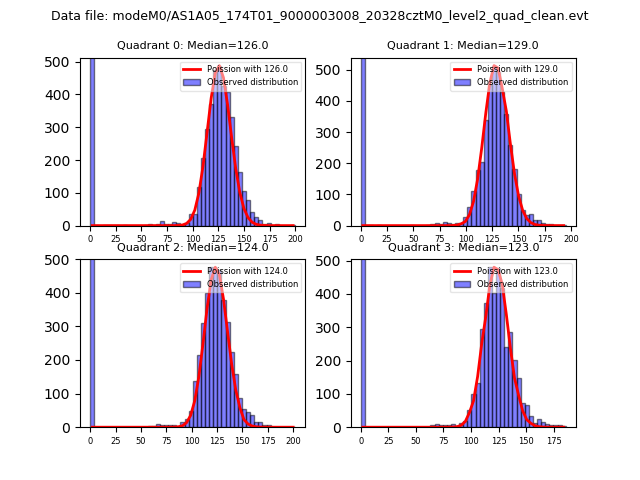 |
 |
| Quadrant-wise count rates Data is divided into 100 sec bins |
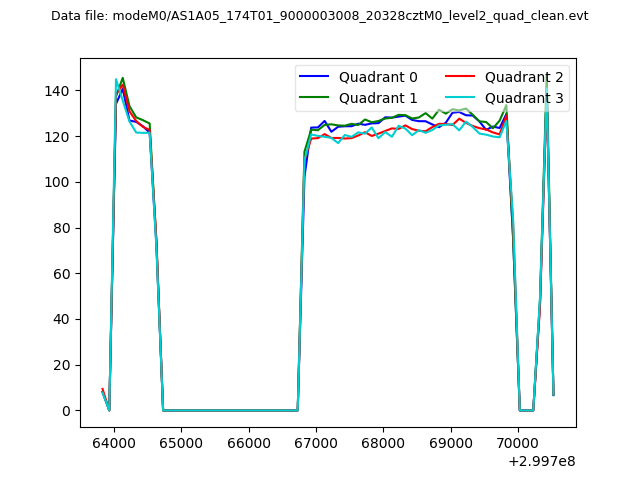 |
|
| Module-wise count rates for Quadrant A Data is divided into 100 sec bins |
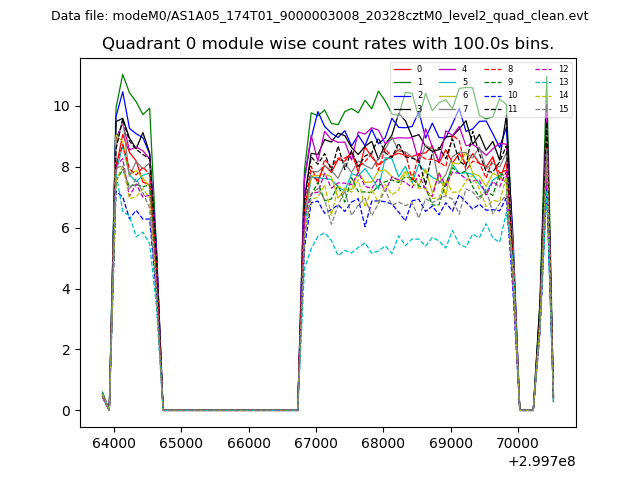 |
 |
| Module-wise count rates for Quadrant B Data is divided into 100 sec bins |
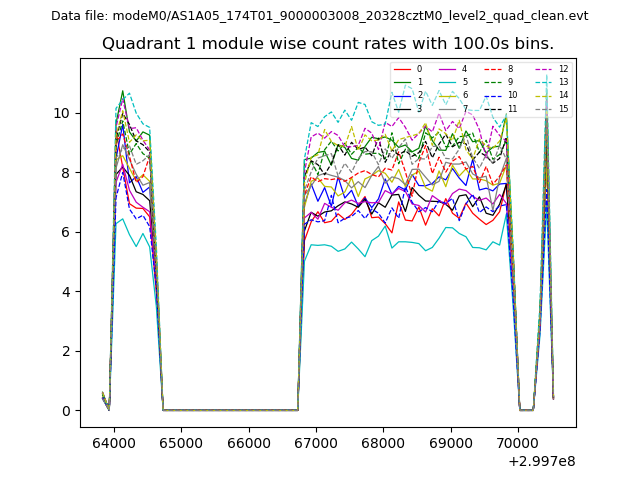 |
 |
| Module-wise count rates for Quadrant C Data is divided into 100 sec bins |
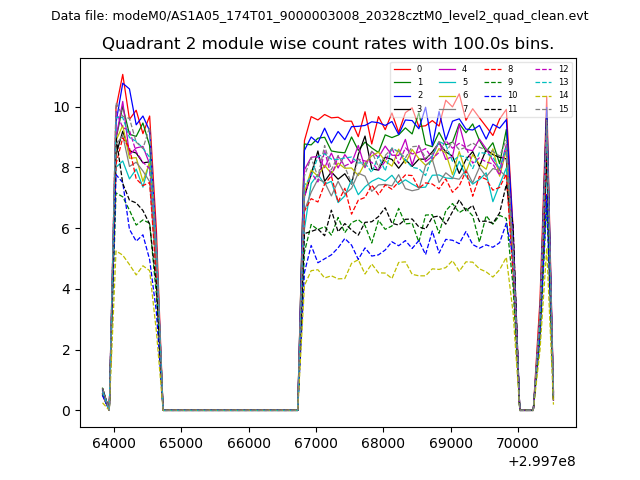 |
 |
| Module-wise count rates for Quadrant D Data is divided into 100 sec bins |
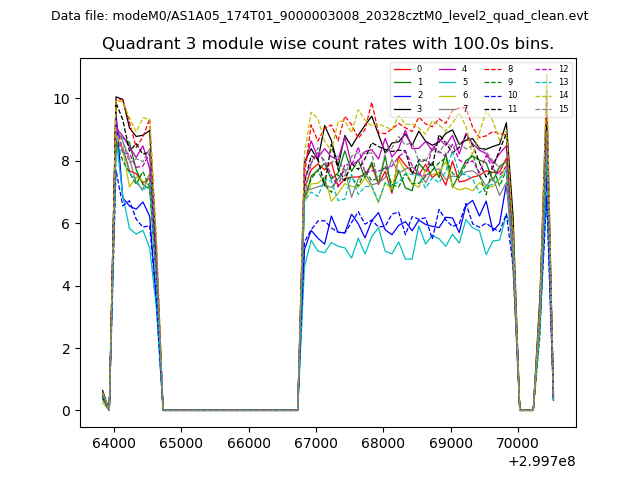 |
 |
| Parameter | Plot |
|---|---|
| CZT HV Monitor | 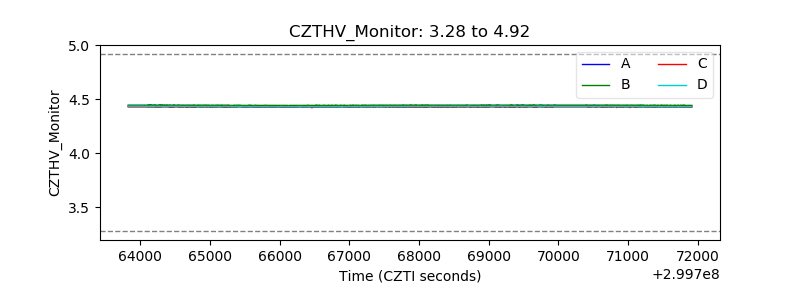 |
| D_VDD |  |
| Temperature 1 | 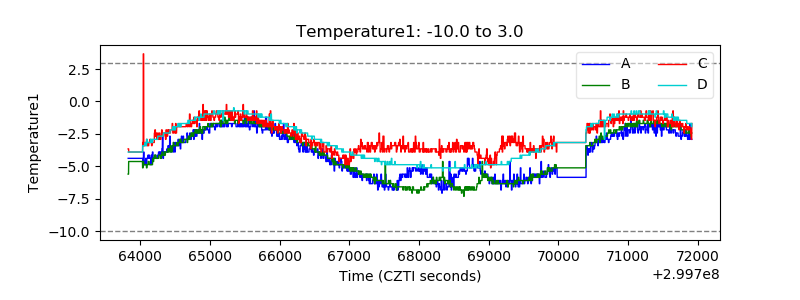 |
| Veto HV Monitor | 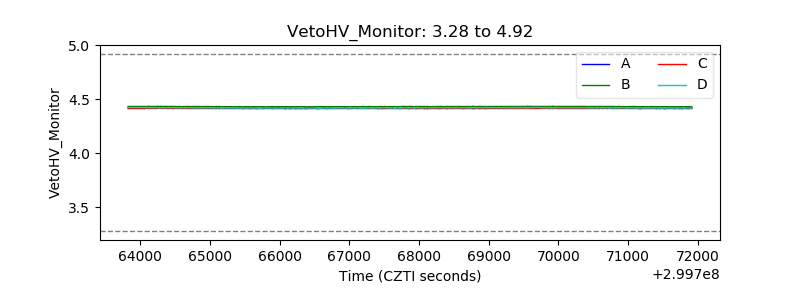 |
| Veto LLD | 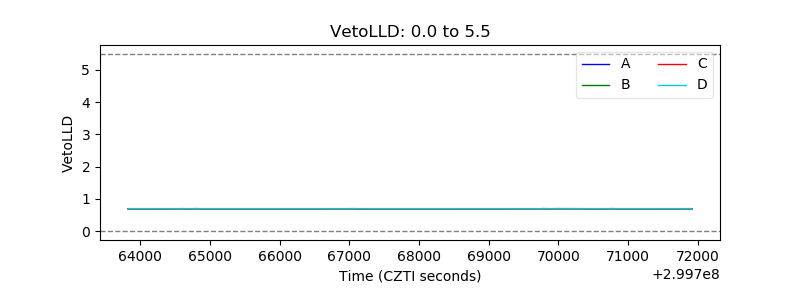 |
| Alpha Counter | 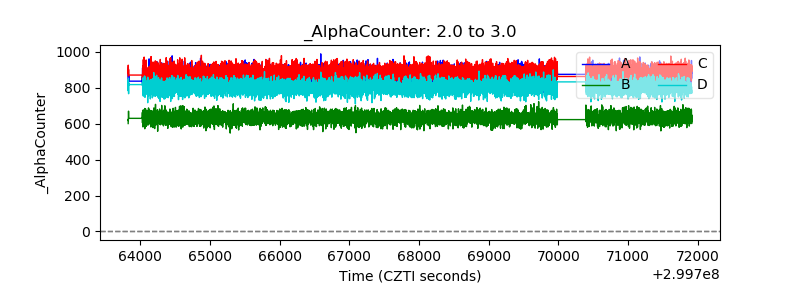 |
| _CPM_Rate | 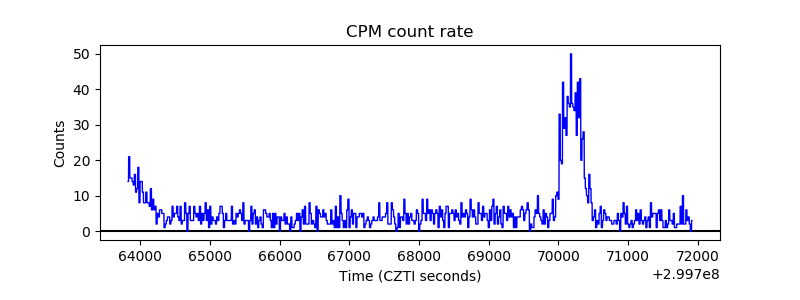 |
| CZT Counter | 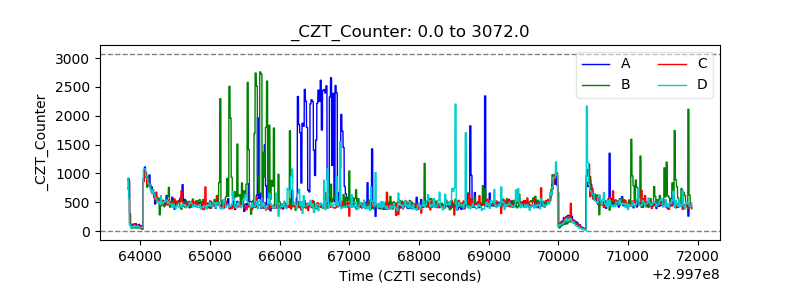 |
| +2.5 Volts monitor |  |
| +5 Volts monitor |  |
| _ROLL_ROT | 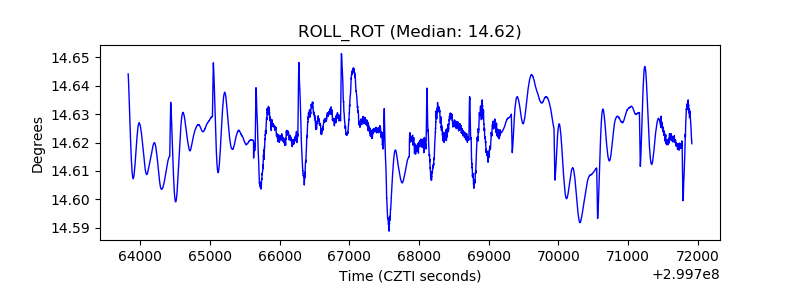 |
| _Roll_DEC | 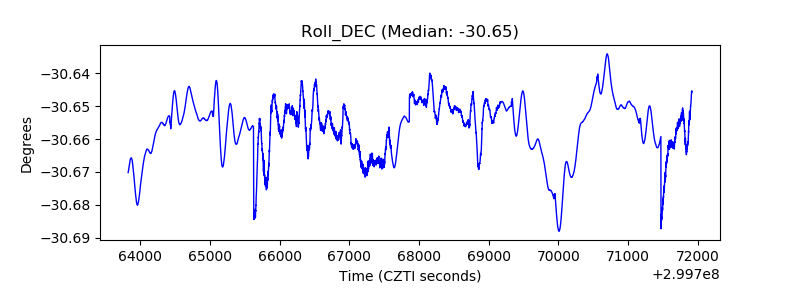 |
| _Roll_RA |  |
| Veto Counter | 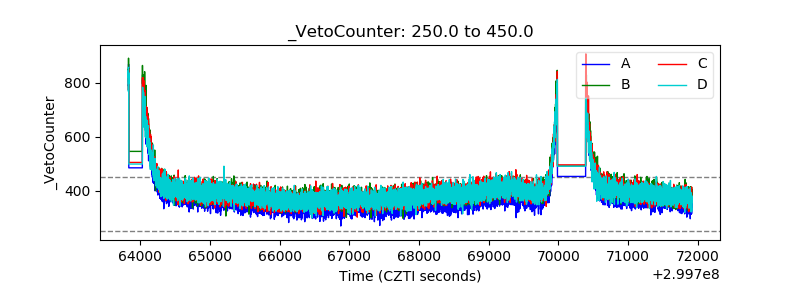 |