| Param | Original file | Final file |
|---|---|---|
| Filename | modeM0/AS1A05_174T01_9000003008_20330cztM0_level2.evt | modeM0/AS1A05_174T01_9000003008_20330cztM0_level2_quad_clean.evt |
| Size (bytes) | 873,086,400 | 153,434,880 |
| Size | 832.6 MB | 146.3 MB |
| Events in quadrant A | 6,095,544 | 952,326 |
| Events in quadrant B | 7,069,144 | 955,739 |
| Events in quadrant C | 6,179,798 | 923,314 |
| Events in quadrant D | 6,222,537 | 923,116 |
| Mode M9 | |||
|---|---|---|---|
| Quadrant | BADHDUFLAG | Total packets | Discarded packets |
| A | 0 | 19 | 0 |
| B | 0 | 19 | 0 |
| C | 0 | 19 | 0 |
| D | 0 | 19 | 0 |
| Mode M0 | |||
|---|---|---|---|
| Quadrant | BADHDUFLAG | Total packets | Discarded packets |
| A | 0 | 26650 | 3 |
| B | 0 | 29362 | 3 |
| C | 0 | 26614 | 3 |
| D | 0 | 27382 | 3 |
| Mode SS | |||
|---|---|---|---|
| Quadrant | BADHDUFLAG | Total packets | Discarded packets |
| A | 0 | 262 | 0 |
| B | 0 | 262 | 0 |
| C | 0 | 262 | 0 |
| D | 0 | 262 | 0 |
| Quadrant | Total seconds | Saturated seconds | Saturation percentage |
|---|---|---|---|
| A | 12915 | 209 | 1.618273% |
| B | 12916 | 508 | 3.933106% |
| C | 12915 | 239 | 1.850561% |
| D | 12915 | 171 | 1.324042% |
Noise dominated data is calculated using 1-second bins in cleaned event files. If a bin has >2000 counts, and if more than 50% of those come from <1% of pixels, then it is considered to be noise-dominated and hence unusable.
| Quadrant | # 1 sec bins | Bins with >0 counts | Bins with >2000 counts | High rate bins dominated by noise | Noise dominated (total time) | Noise dominated (detector-on time) | Marked lightcurve |
|---|---|---|---|---|---|---|---|
| A | 14695 | 12916 | 1 | 1 | 0.01% | 0.01% | 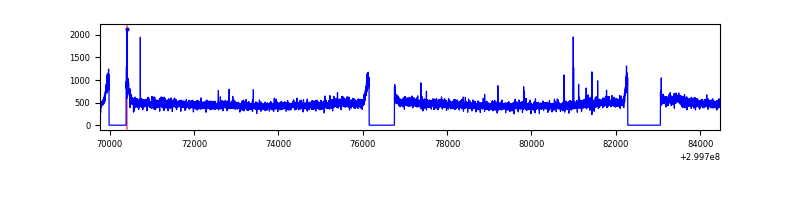 |
| B | 14696 | 12917 | 189 | 189 | 1.29% | 1.46% | 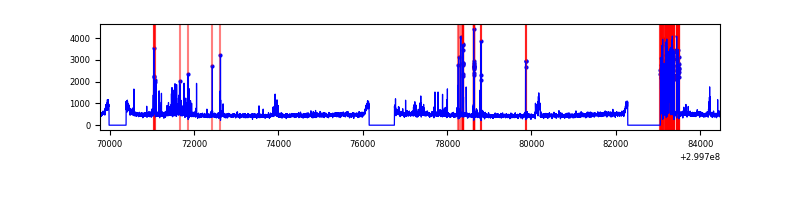 |
| C | 14695 | 12917 | 1 | 1 | 0.01% | 0.01% | 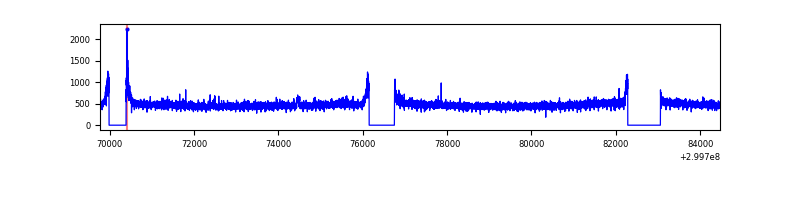 |
| D | 14695 | 12918 | 25 | 25 | 0.17% | 0.19% | 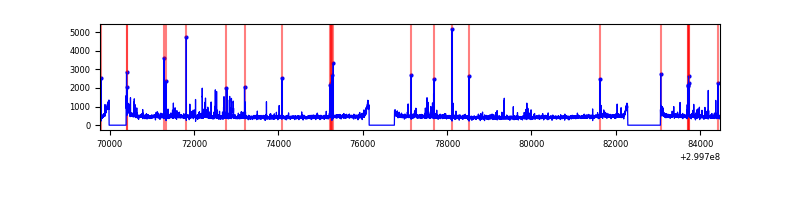 |
Top three noisy pixels from each quadrant. If the there are fewer than three noisy pixels in the level2.evt file, extra rows are filled as -1
| Pixel properties | Quadrant properties | ||||||
|---|---|---|---|---|---|---|---|
| Quadrant | DetID | PixID | Counts | Sigma | Mean | Median | Sigma |
| A | 5 | 16 | 20551 | 59.38 | 1570 | 1534 | 320.2 |
| A | 15 | 191 | 19401 | 55.79 | 1570 | 1534 | 320.2 |
| A | 13 | 254 | 17147 | 48.75 | 1570 | 1534 | 320.2 |
| B | 4 | 142 | 616115 | 2063.77 | 1538 | 1496 | 297.8 |
| B | 7 | 220 | 124798 | 414.02 | 1538 | 1496 | 297.8 |
| B | 3 | 64 | 66359 | 217.8 | 1538 | 1496 | 297.8 |
| C | 14 | 238 | 233903 | 653.74 | 1507 | 1516 | 355.5 |
| C | 0 | 207 | 33993 | 91.36 | 1507 | 1516 | 355.5 |
| C | 10 | 91 | 12774 | 31.67 | 1507 | 1516 | 355.5 |
| D | 1 | 52 | 204698 | 540.92 | 1538 | 1495 | 375.7 |
| D | 9 | 1 | 68622 | 178.69 | 1538 | 1495 | 375.7 |
| D | 2 | 234 | 57004 | 147.76 | 1538 | 1495 | 375.7 |
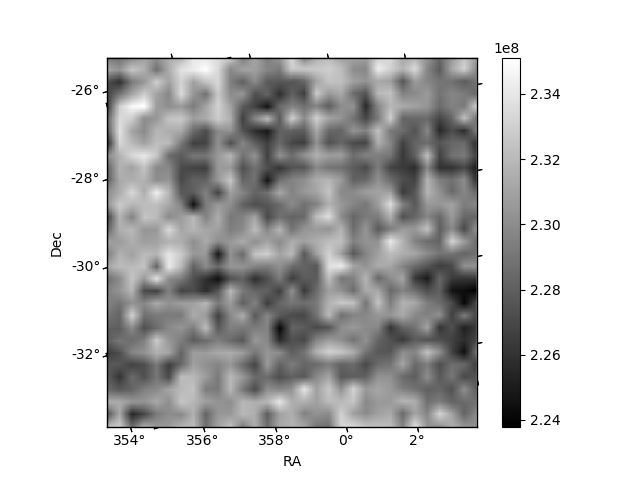
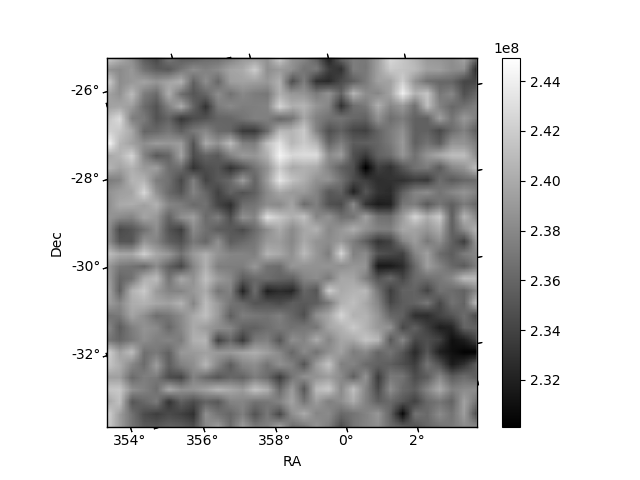
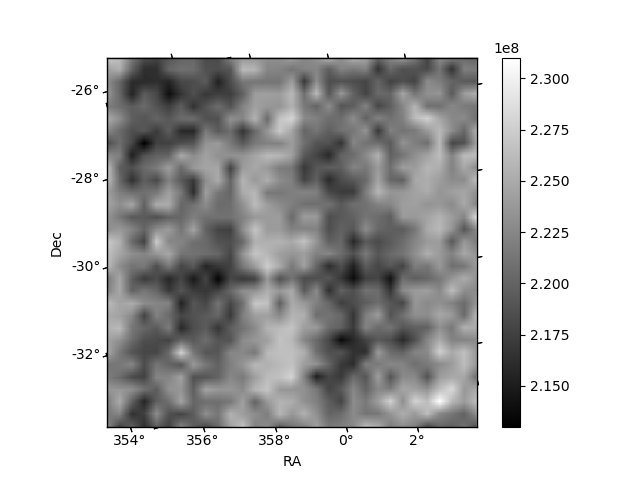
Histogram calculated using DETX and DETY for each event in the final _common_clean file
| Quadrant A | 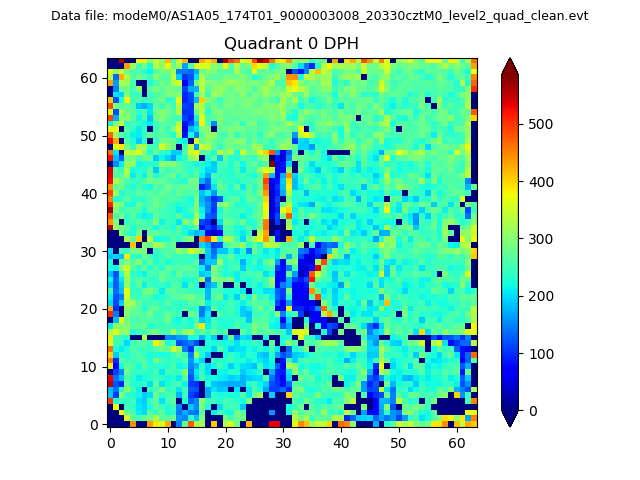 |
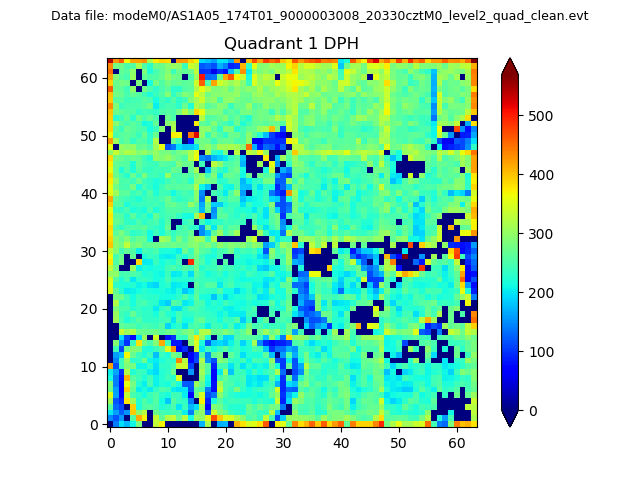 |
Quadrant B |
|---|---|---|---|
| Quadrant D | 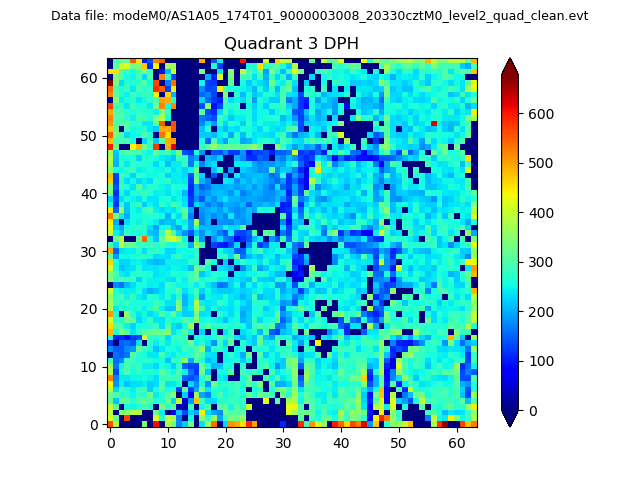 |
 |
Quadrant C |
| Plot type | Count rate plots | Images |
|---|---|---|
| Comparison with Poisson distribution Blue bars denote a histogram of data divided into 1 sec bins. Red curve is a Poisson curve with rate = median count rate of data. |
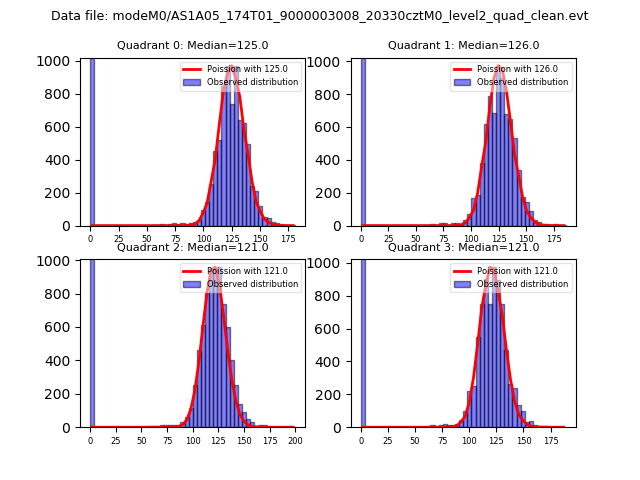 |
 |
| Quadrant-wise count rates Data is divided into 100 sec bins |
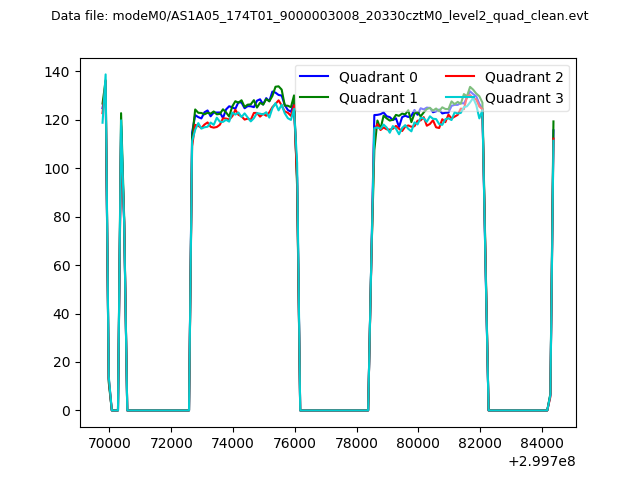 |
|
| Module-wise count rates for Quadrant A Data is divided into 100 sec bins |
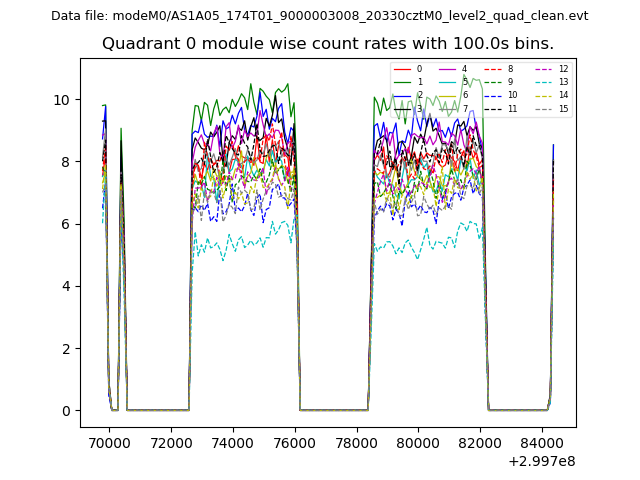 |
 |
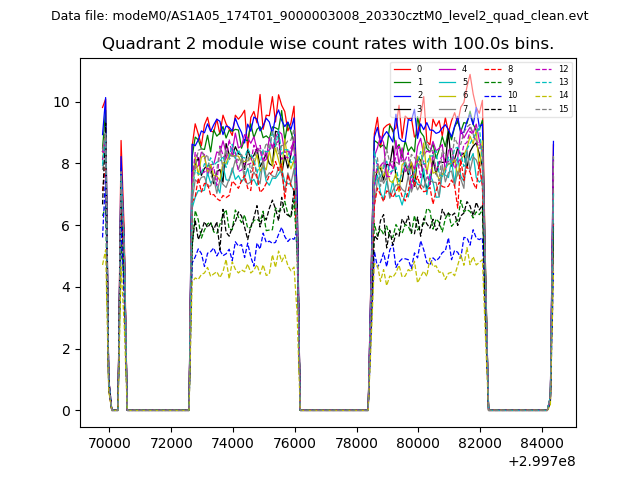
| Module-wise count rates for Quadrant B Data is divided into 100 sec bins |
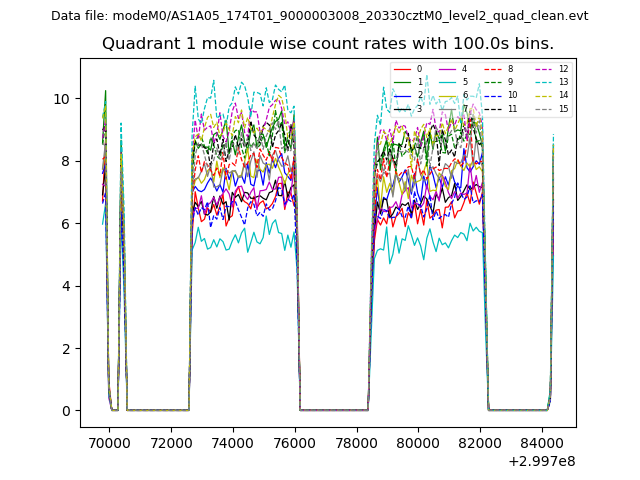 |
 |
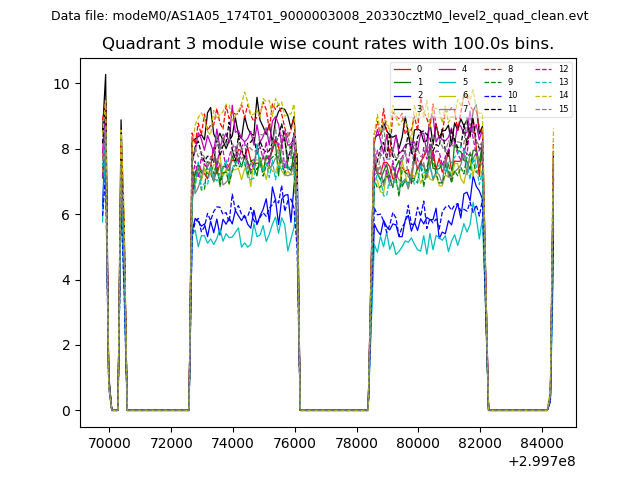
| Module-wise count rates for Quadrant C Data is divided into 100 sec bins |
 |
 |
| Module-wise count rates for Quadrant D Data is divided into 100 sec bins |
 |
 |
| Parameter | Plot |
|---|---|
| CZT HV Monitor | 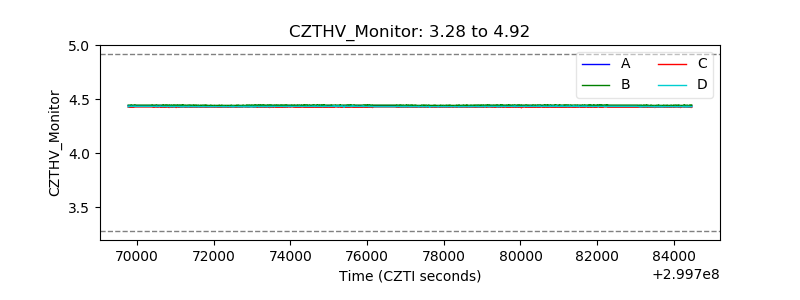 |
| D_VDD |  |
| Temperature 1 | 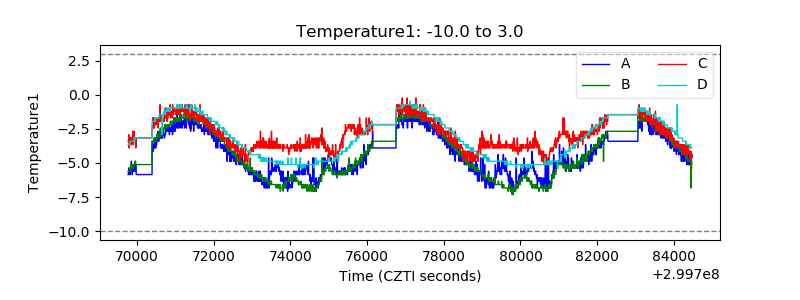 |
| Veto HV Monitor | 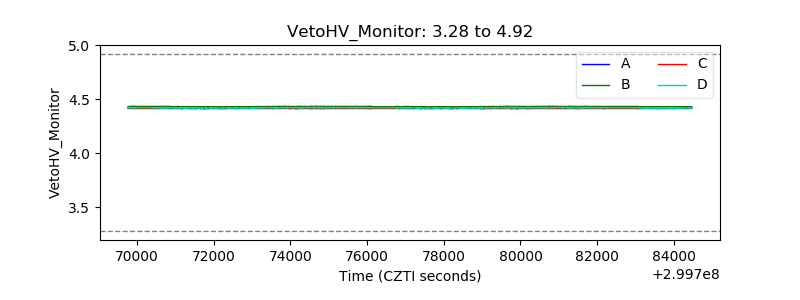 |
| Veto LLD | 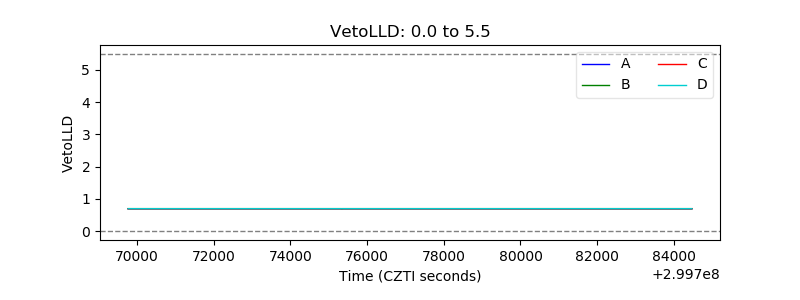 |
| Alpha Counter | 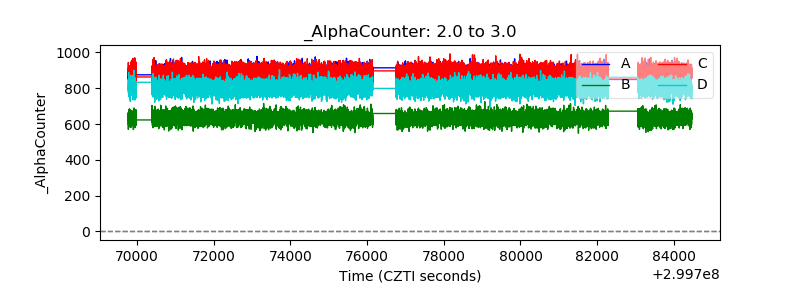 |
| _CPM_Rate | 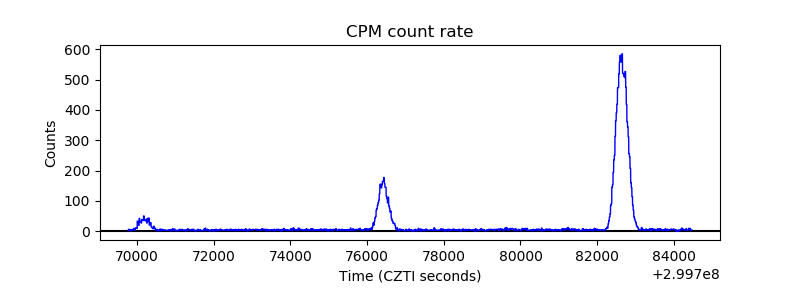 |
| CZT Counter | 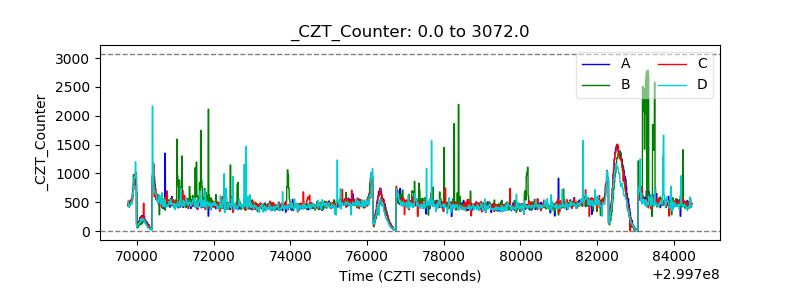 |
| +2.5 Volts monitor |  |
| +5 Volts monitor |  |
| _ROLL_ROT | 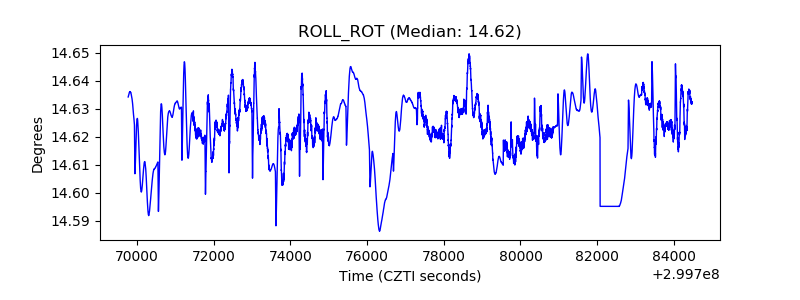 |
| _Roll_DEC | 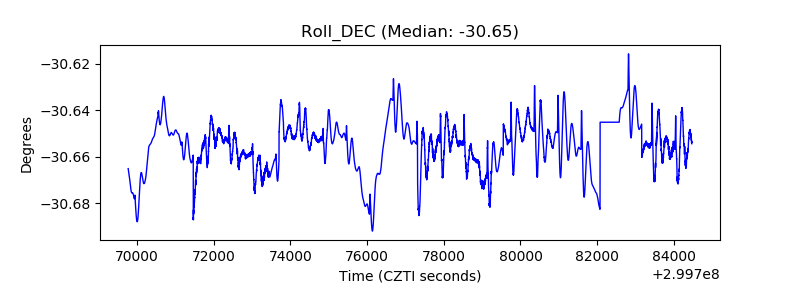 |
| _Roll_RA | 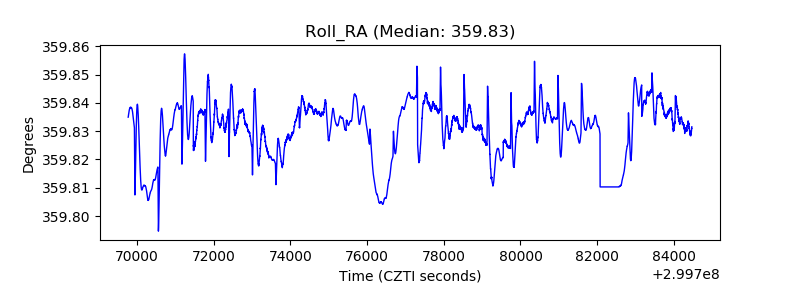 |
| Veto Counter | 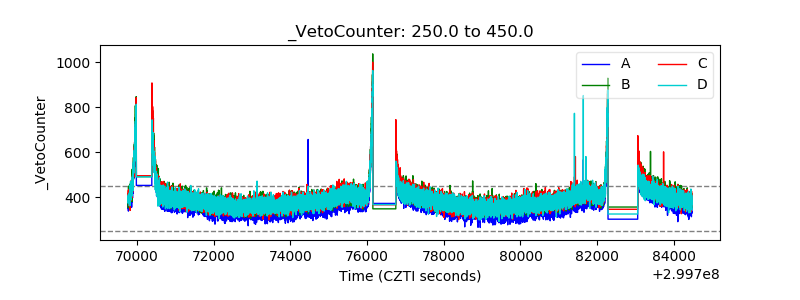 |