| Param | Original file | Final file |
|---|---|---|
| Filename | modeM0/AS1A05_174T01_9000003008_20334cztM0_level2.evt | modeM0/AS1A05_174T01_9000003008_20334cztM0_level2_quad_clean.evt |
| Size (bytes) | 789,624,000 | 179,671,680 |
| Size | 753.0 MB | 171.3 MB |
| Events in quadrant A | 5,873,468 | 1,165,558 |
| Events in quadrant B | 5,969,791 | 1,192,910 |
| Events in quadrant C | 5,766,699 | 1,150,507 |
| Events in quadrant D | 5,514,559 | 1,127,171 |
| Mode M9 | |||
|---|---|---|---|
| Quadrant | BADHDUFLAG | Total packets | Discarded packets |
| A | 0 | 32 | 0 |
| B | 0 | 32 | 0 |
| C | 0 | 32 | 0 |
| D | 0 | 32 | 0 |
| Mode M0 | |||
|---|---|---|---|
| Quadrant | BADHDUFLAG | Total packets | Discarded packets |
| A | 0 | 25098 | 3 |
| B | 0 | 25264 | 3 |
| C | 0 | 24426 | 3 |
| D | 0 | 24100 | 3 |
| Mode SS | |||
|---|---|---|---|
| Quadrant | BADHDUFLAG | Total packets | Discarded packets |
| A | 0 | 240 | 0 |
| B | 0 | 240 | 0 |
| C | 0 | 240 | 0 |
| D | 0 | 240 | 0 |
| Quadrant | Total seconds | Saturated seconds | Saturation percentage |
|---|---|---|---|
| A | 11648 | 131 | 1.124657% |
| B | 11648 | 152 | 1.304945% |
| C | 11648 | 126 | 1.081731% |
| D | 11649 | 52 | 0.446390% |
Noise dominated data is calculated using 1-second bins in cleaned event files. If a bin has >2000 counts, and if more than 50% of those come from <1% of pixels, then it is considered to be noise-dominated and hence unusable.
| Quadrant | # 1 sec bins | Bins with >0 counts | Bins with >2000 counts | High rate bins dominated by noise | Noise dominated (total time) | Noise dominated (detector-on time) | Marked lightcurve |
|---|---|---|---|---|---|---|---|
| A | 14848 | 11651 | 29 | 29 | 0.20% | 0.25% | 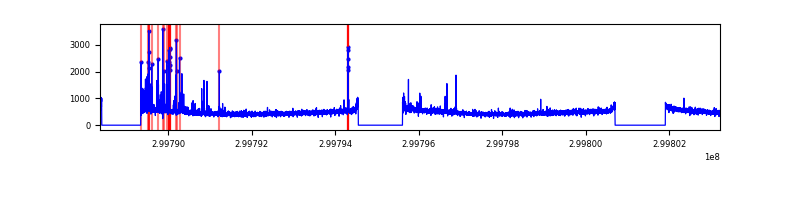 |
| B | 14848 | 11651 | 23 | 23 | 0.15% | 0.20% | 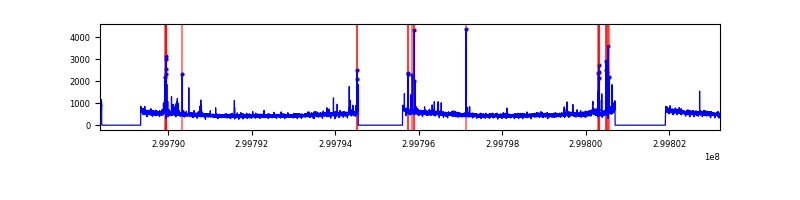 |
| C | 14848 | 11651 | 0 | 0 | 0.00% | 0.00% | 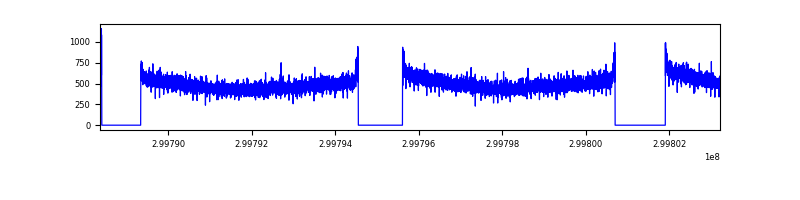 |
| D | 14849 | 11652 | 5 | 5 | 0.03% | 0.04% | 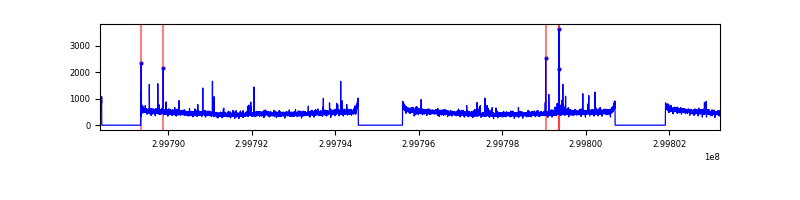 |
Top three noisy pixels from each quadrant. If the there are fewer than three noisy pixels in the level2.evt file, extra rows are filled as -1
| Pixel properties | Quadrant properties | ||||||
|---|---|---|---|---|---|---|---|
| Quadrant | DetID | PixID | Counts | Sigma | Mean | Median | Sigma |
| A | 5 | 16 | 281729 | 964.69 | 1450 | 1421 | 290.6 |
| A | 13 | 254 | 14223 | 44.06 | 1450 | 1421 | 290.6 |
| A | 0 | 226 | 12551 | 38.3 | 1450 | 1421 | 290.6 |
| B | 7 | 220 | 156250 | 564.25 | 1451 | 1412 | 274.4 |
| B | 12 | 111 | 32837 | 114.52 | 1451 | 1412 | 274.4 |
| B | 11 | 111 | 29177 | 101.18 | 1451 | 1412 | 274.4 |
| C | 14 | 238 | 219323 | 662.55 | 1414 | 1425 | 328.9 |
| C | 3 | 233 | 29203 | 84.46 | 1414 | 1425 | 328.9 |
| C | 13 | 61 | 9815 | 25.51 | 1414 | 1425 | 328.9 |
| D | 2 | 234 | 47020 | 131.98 | 1431 | 1391 | 345.7 |
| D | 9 | 1 | 44281 | 124.05 | 1431 | 1391 | 345.7 |
| D | 1 | 52 | 27720 | 76.15 | 1431 | 1391 | 345.7 |
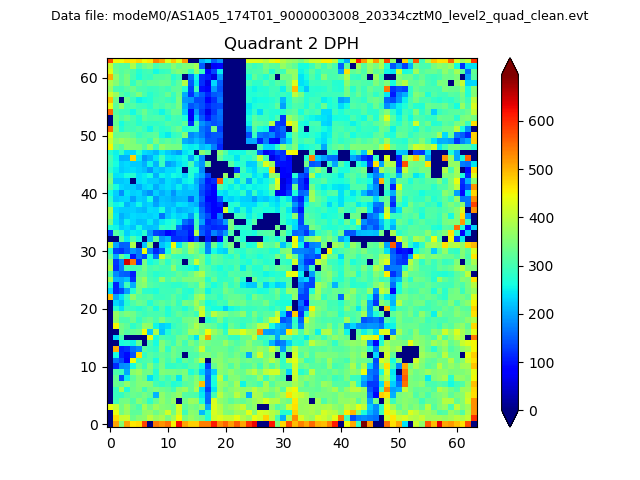
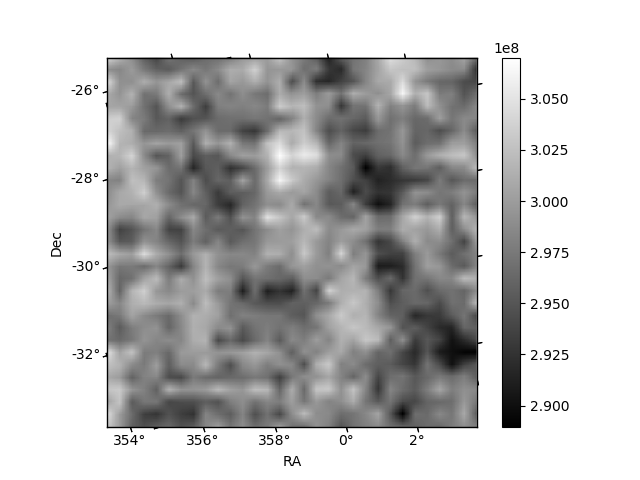
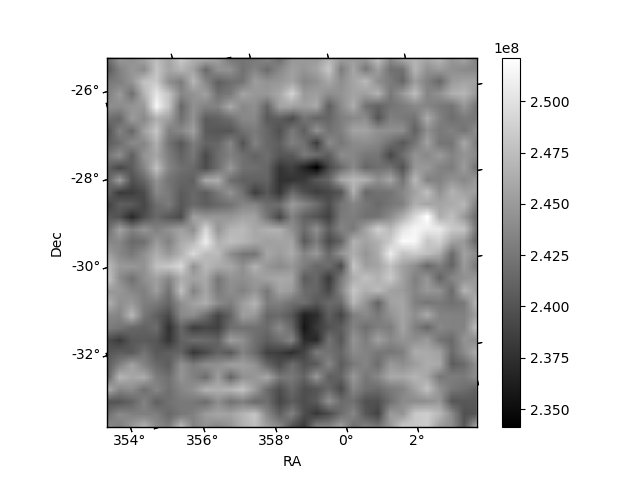
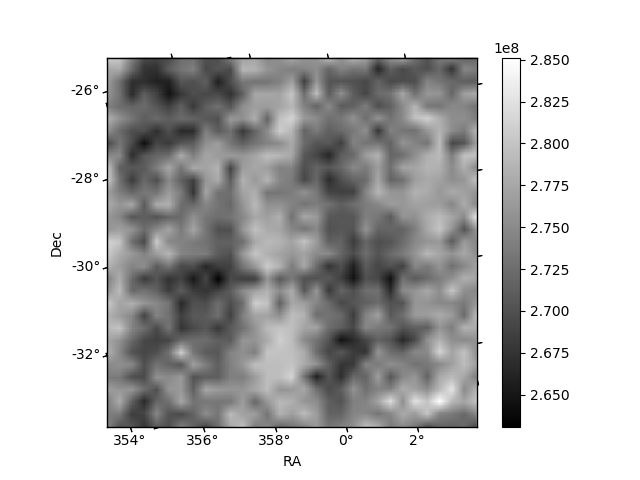
Histogram calculated using DETX and DETY for each event in the final _common_clean file
| Quadrant A | 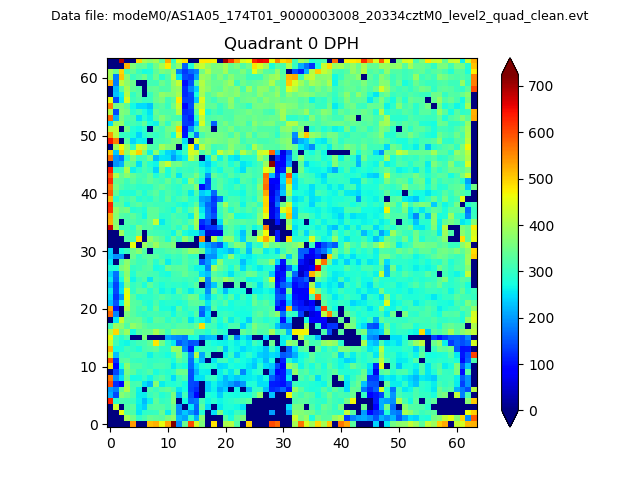 |
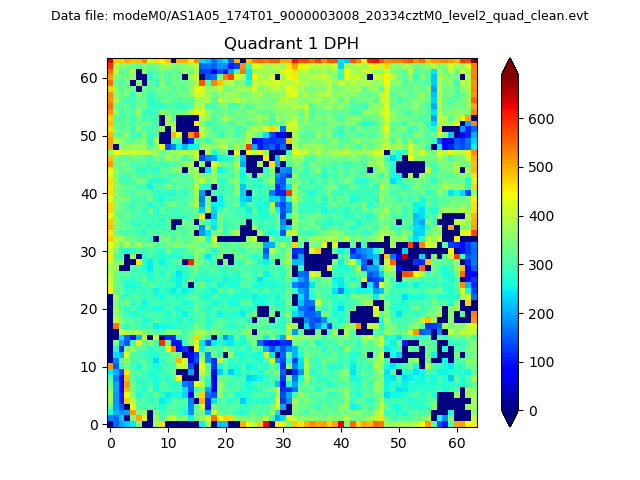 |
Quadrant B |
|---|---|---|---|
| Quadrant D | 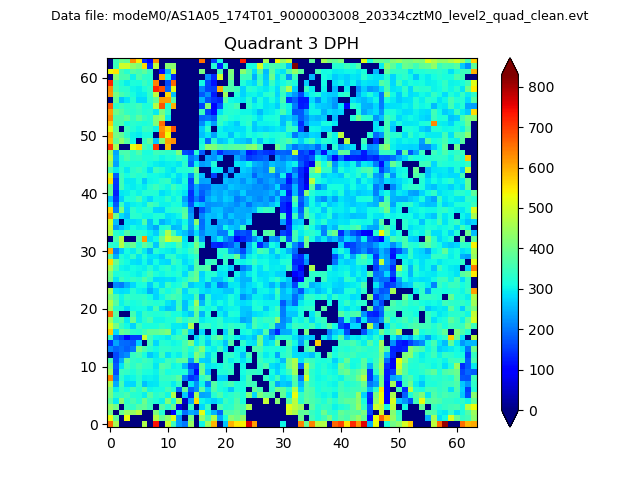 |
 |
Quadrant C |
| Plot type | Count rate plots | Images |
|---|---|---|
| Comparison with Poisson distribution Blue bars denote a histogram of data divided into 1 sec bins. Red curve is a Poisson curve with rate = median count rate of data. |
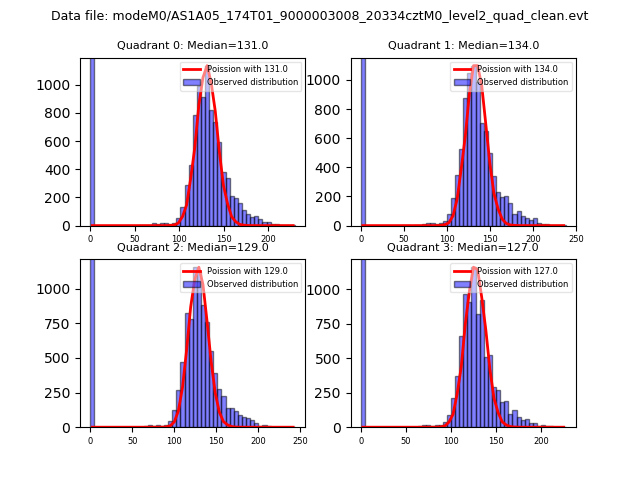 |
 |
| Quadrant-wise count rates Data is divided into 100 sec bins |
 |
|
| Module-wise count rates for Quadrant A Data is divided into 100 sec bins |
 |
 |
| Module-wise count rates for Quadrant B Data is divided into 100 sec bins |
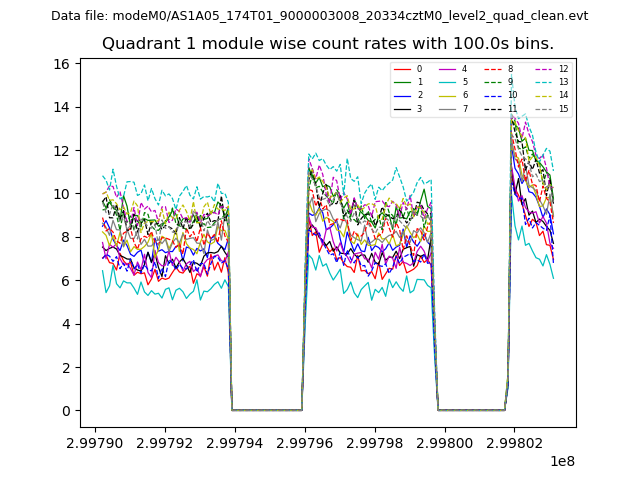 |
 |
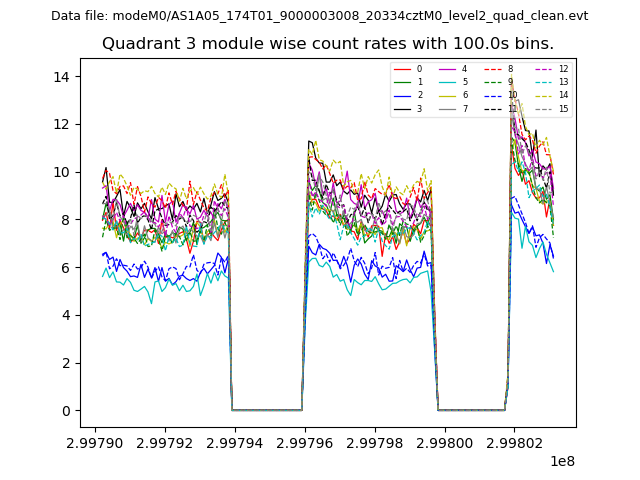
| Module-wise count rates for Quadrant C Data is divided into 100 sec bins |
 |
 |
| Module-wise count rates for Quadrant D Data is divided into 100 sec bins |
 |
 |
| Parameter | Plot |
|---|---|
| CZT HV Monitor | 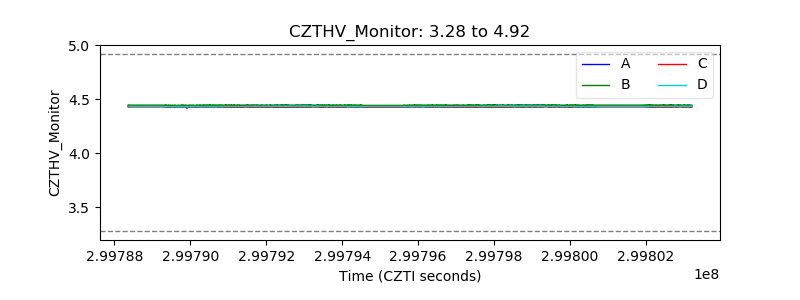 |
| D_VDD | 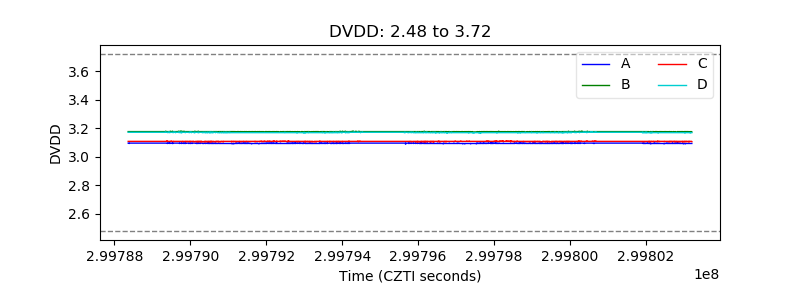 |
| Temperature 1 | 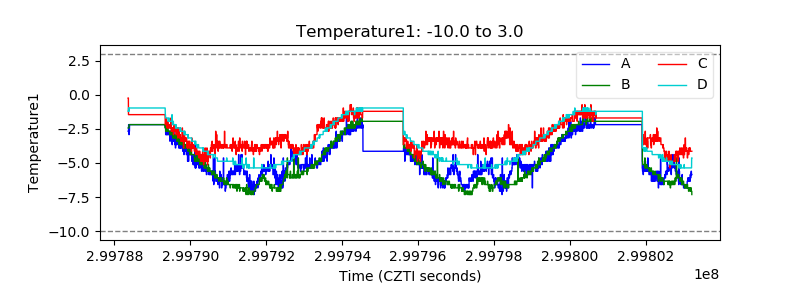 |
| Veto HV Monitor | 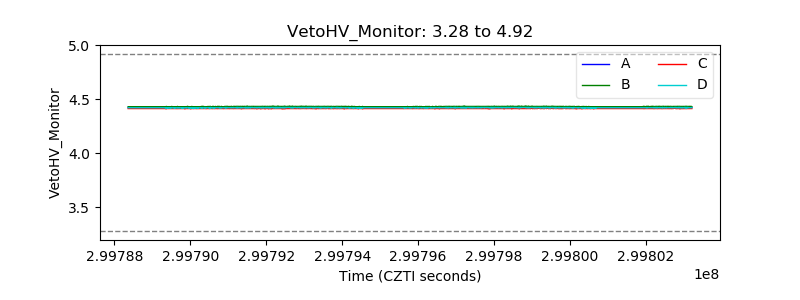 |
| Veto LLD | 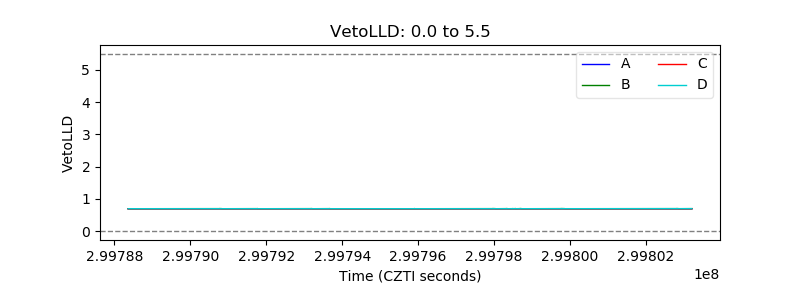 |
| Alpha Counter |  |
| _CPM_Rate | 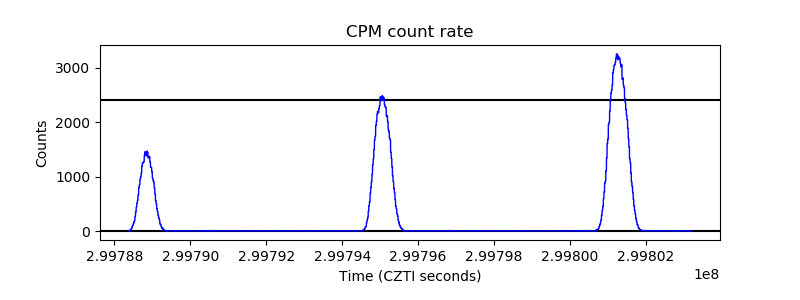 |
| CZT Counter | 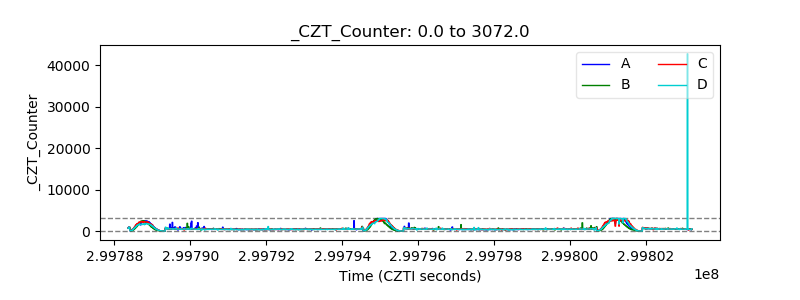 |
| +2.5 Volts monitor |  |
| +5 Volts monitor |  |
| _ROLL_ROT |  |
| _Roll_DEC |  |
| _Roll_RA | 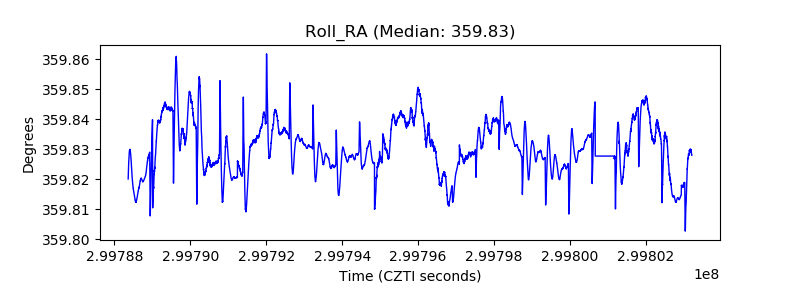 |
| Veto Counter | 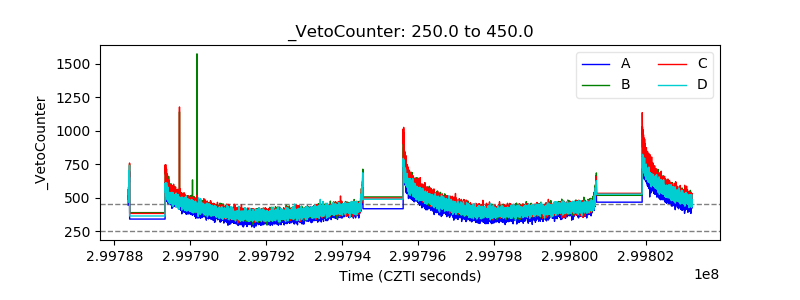 |