| Param | Original file | Final file |
|---|---|---|
| Filename | modeM0/AS1A06_009T02_9000003006cztM0_level2.fits | modeM0/AS1A06_009T02_9000003006cztM0_level2_quad_clean.evt |
| Size (bytes) | 164,934,720 | 75,738,240 |
| Size | 157.3 MB | 72.2 MB |
| Events in quadrant A | 1,033,064 | 320,940 |
| Events in quadrant B | 993,438 | 317,019 |
| Events in quadrant C | 1,037,010 | 315,460 |
| Events in quadrant D | 877,994 | 284,519 |
| Mode M0 | |||
|---|---|---|---|
| Quadrant | BADHDUFLAG | Total packets | Discarded packets |
| A | 0 | 32431 | 0 |
| B | 0 | 35119 | 0 |
| C | 0 | 32004 | 0 |
| D | 0 | 41249 | 0 |
| Mode M9 | |||
|---|---|---|---|
| Quadrant | BADHDUFLAG | Total packets | Discarded packets |
| A | 0 | 40 | 0 |
| B | 0 | 40 | 0 |
| C | 0 | 40 | 0 |
| D | 0 | 40 | 0 |
| Mode SS | |||
|---|---|---|---|
| Quadrant | BADHDUFLAG | Total packets | Discarded packets |
| A | 0 | 312 | 0 |
| B | 0 | 312 | 0 |
| C | 0 | 312 | 0 |
| D | 0 | 312 | 0 |
| Quadrant | Total seconds | Saturated seconds | Saturation percentage |
|---|---|---|---|
| A | 15268 | 111 | 0.727011% |
| B | 15268 | 465 | 3.045586% |
| C | 15268 | 135 | 0.884202% |
| D | 15268 | 718 | 4.702646% |
Noise dominated data is calculated using 1-second bins in cleaned event files. If a bin has >2000 counts, and if more than 50% of those come from <1% of pixels, then it is considered to be noise-dominated and hence unusable.
| Quadrant | # 1 sec bins | Bins with >0 counts | Bins with >2000 counts | High rate bins dominated by noise | Noise dominated (total time) | Noise dominated (detector-on time) | Marked lightcurve |
|---|---|---|---|---|---|---|---|
| A | 19238 | 15267 | 0 | 0 | 0.00% | 0.00% | 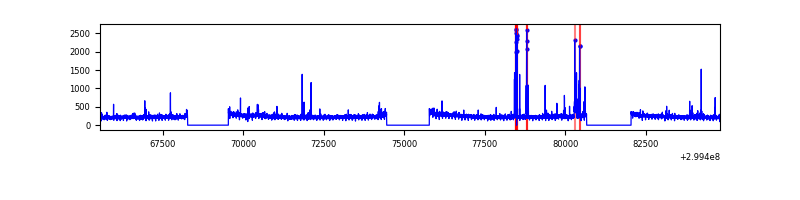 |
| B | 19238 | 15267 | 0 | 0 | 0.00% | 0.00% | 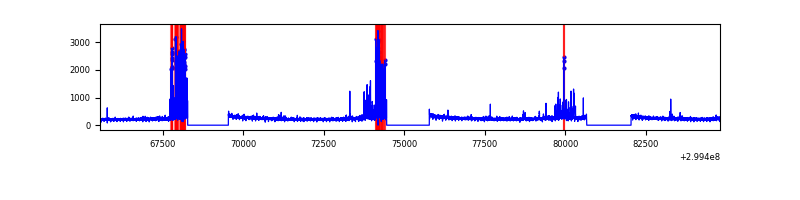 |
| C | 19238 | 15268 | 0 | 0 | 0.00% | 0.00% |  |
| D | 19238 | 15262 | 0 | 0 | 0.00% | 0.00% |  |
Top three noisy pixels from each quadrant. If the there are fewer than three noisy pixels in the level2.evt file, extra rows are filled as -1
| Pixel properties | Quadrant properties | ||||||
|---|---|---|---|---|---|---|---|
| Quadrant | DetID | PixID | Counts | Sigma | Mean | Median | Sigma |
| A | 0 | 29 | 940 | 10.17 | 269 | 256 | 67.3 |
| A | 0 | 30 | 775 | 7.72 | 269 | 256 | 67.3 |
| A | 7 | 110 | 770 | 7.64 | 269 | 256 | 67.3 |
| B | 2 | 9 | 799 | 9.83 | 263 | 253 | 55.5 |
| B | 5 | 128 | 659 | 7.31 | 263 | 253 | 55.5 |
| B | 14 | 254 | 653 | 7.2 | 263 | 253 | 55.5 |
| C | 1 | 80 | 796 | 7.62 | 273 | 259 | 70.5 |
| C | 1 | 81 | 794 | 7.59 | 273 | 259 | 70.5 |
| C | 9 | 209 | 708 | 6.37 | 273 | 259 | 70.5 |
| D | 7 | 5 | 625 | 5.9 | 250 | 230 | 66.9 |
| D | 10 | 189 | 623 | 5.87 | 250 | 230 | 66.9 |
| D | 7 | 3 | 600 | 5.53 | 250 | 230 | 66.9 |
Histogram calculated using DETX and DETY for each event in the final _common_clean file
| Quadrant A |  |
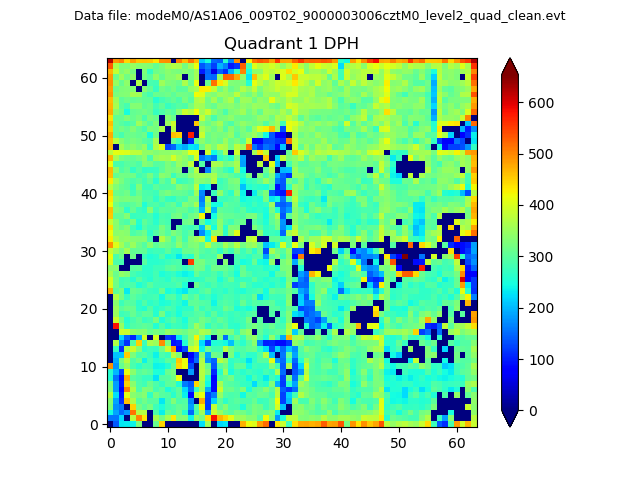 |
Quadrant B |
|---|---|---|---|
| Quadrant D |  |
 |
Quadrant C |
| Plot type | Count rate plots | Images |
|---|---|---|
| Comparison with Poisson distribution Blue bars denote a histogram of data divided into 1 sec bins. Red curve is a Poisson curve with rate = median count rate of data. |
 |
 |
| Quadrant-wise count rates Data is divided into 100 sec bins |
 |
|
| Module-wise count rates for Quadrant A Data is divided into 100 sec bins |
 |
 |
| Module-wise count rates for Quadrant B Data is divided into 100 sec bins |
 |
 |
| Module-wise count rates for Quadrant C Data is divided into 100 sec bins |
 |
 |
| Module-wise count rates for Quadrant D Data is divided into 100 sec bins |
 |
 |
| Parameter | Plot |
|---|---|
| CZT HV Monitor |  |
| D_VDD |  |
| Temperature 1 | 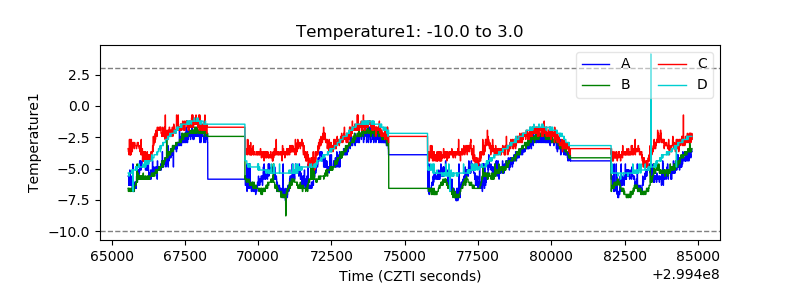 |
| Veto HV Monitor |  |
| Veto LLD |  |
| Alpha Counter |  |
| _CPM_Rate |  |
| CZT Counter |  |
| +2.5 Volts monitor |  |
| +5 Volts monitor |  |
| _ROLL_ROT | 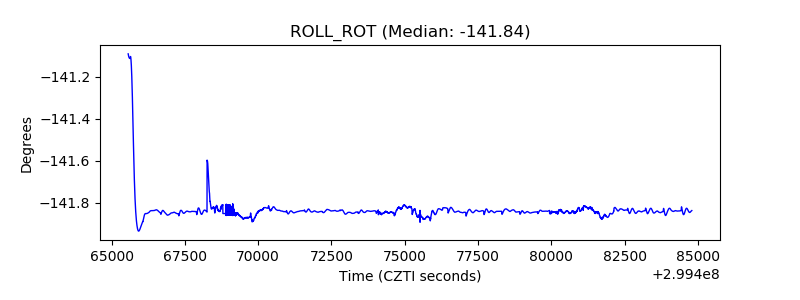 |
| _Roll_DEC | 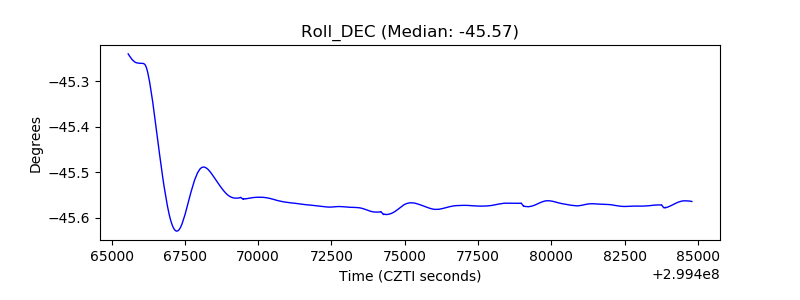 |
| _Roll_RA | 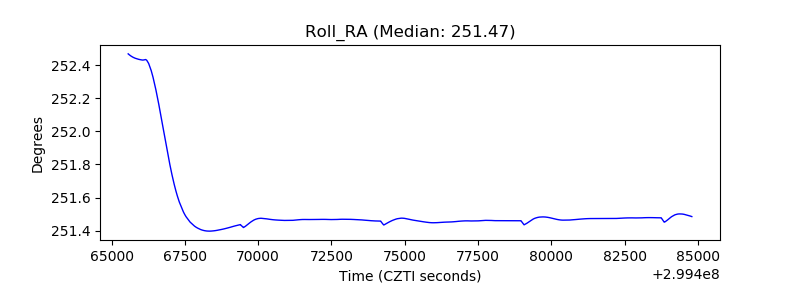 |
| Veto Counter |  |