| Param | Original file | Final file |
|---|---|---|
| Filename | modeM0/AS1A06_009T02_9000003006_20277cztM0_level2.evt | modeM0/AS1A06_009T02_9000003006_20277cztM0_level2_quad_clean.evt |
| Size (bytes) | 360,630,720 | 58,389,120 |
| Size | 343.9 MB | 55.7 MB |
| Events in quadrant A | 2,158,086 | 383,467 |
| Events in quadrant B | 2,590,760 | 380,392 |
| Events in quadrant C | 2,181,958 | 377,266 |
| Events in quadrant D | 3,704,476 | 330,465 |
| Mode M0 | |||
|---|---|---|---|
| Quadrant | BADHDUFLAG | Total packets | Discarded packets |
| A | 0 | 8783 | 2 |
| B | 0 | 10175 | 1 |
| C | 0 | 8873 | 1 |
| D | 0 | 13798 | 1 |
| Mode M9 | |||
|---|---|---|---|
| Quadrant | BADHDUFLAG | Total packets | Discarded packets |
| A | 0 | 13 | 0 |
| B | 0 | 13 | 0 |
| C | 0 | 13 | 0 |
| D | 0 | 13 | 0 |
| Mode SS | |||
|---|---|---|---|
| Quadrant | BADHDUFLAG | Total packets | Discarded packets |
| A | 0 | 86 | 0 |
| B | 0 | 86 | 0 |
| C | 0 | 86 | 0 |
| D | 0 | 86 | 0 |
| Quadrant | Total seconds | Saturated seconds | Saturation percentage |
|---|---|---|---|
| A | 4203 | 14 | 0.333095% |
| B | 4203 | 224 | 5.329527% |
| C | 4203 | 43 | 1.023079% |
| D | 4203 | 513 | 12.205567% |
Noise dominated data is calculated using 1-second bins in cleaned event files. If a bin has >2000 counts, and if more than 50% of those come from <1% of pixels, then it is considered to be noise-dominated and hence unusable.
| Quadrant | # 1 sec bins | Bins with >0 counts | Bins with >2000 counts | High rate bins dominated by noise | Noise dominated (total time) | Noise dominated (detector-on time) | Marked lightcurve |
|---|---|---|---|---|---|---|---|
| A | 5468 | 4204 | 0 | 0 | 0.00% | 0.00% | 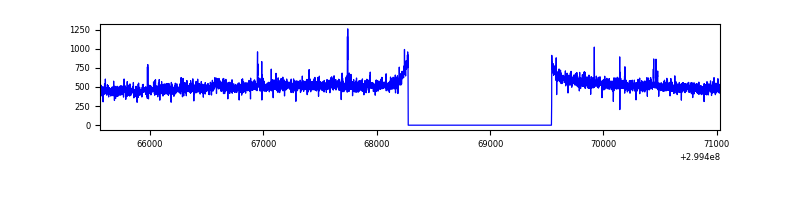 |
| B | 5468 | 4204 | 127 | 127 | 2.32% | 3.02% | 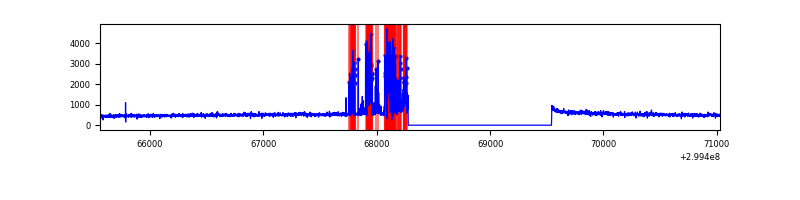 |
| C | 5468 | 4204 | 0 | 0 | 0.00% | 0.00% | 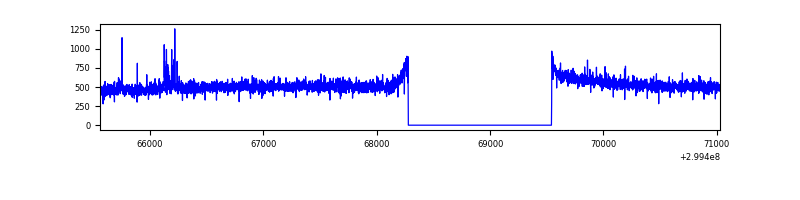 |
| D | 5468 | 4204 | 396 | 396 | 7.24% | 9.42% | 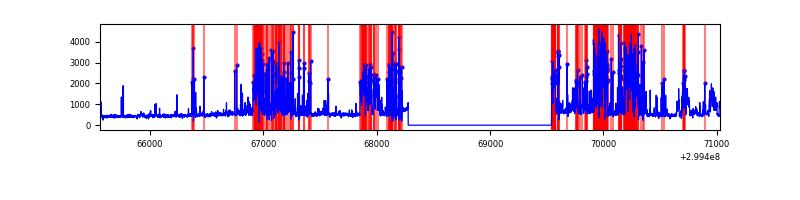 |
Top three noisy pixels from each quadrant. If the there are fewer than three noisy pixels in the level2.evt file, extra rows are filled as -1
| Pixel properties | Quadrant properties | ||||||
|---|---|---|---|---|---|---|---|
| Quadrant | DetID | PixID | Counts | Sigma | Mean | Median | Sigma |
| A | 8 | 205 | 26115 | 231.8 | 547 | 537 | 110.3 |
| A | 14 | 238 | 9467 | 80.93 | 547 | 537 | 110.3 |
| A | 4 | 2 | 8272 | 70.1 | 547 | 537 | 110.3 |
| B | 4 | 142 | 393888 | 3880.57 | 537 | 524 | 101.4 |
| B | 7 | 220 | 69634 | 681.77 | 537 | 524 | 101.4 |
| B | 12 | 111 | 11976 | 112.97 | 537 | 524 | 101.4 |
| C | 14 | 238 | 84539 | 678.82 | 530 | 534 | 123.8 |
| C | 3 | 233 | 26312 | 208.3 | 530 | 534 | 123.8 |
| C | 13 | 61 | 3786 | 26.28 | 530 | 534 | 123.8 |
| D | 1 | 52 | 1785657 | 14700.82 | 503 | 491 | 121.4 |
| D | 2 | 234 | 19251 | 154.49 | 503 | 491 | 121.4 |
| D | 12 | 6 | 7434 | 57.18 | 503 | 491 | 121.4 |
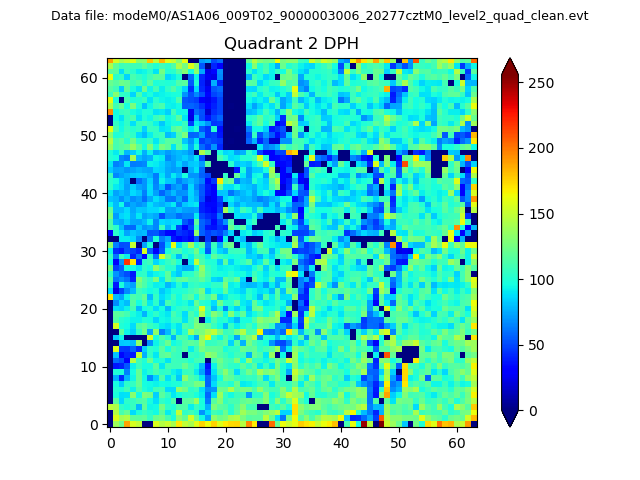
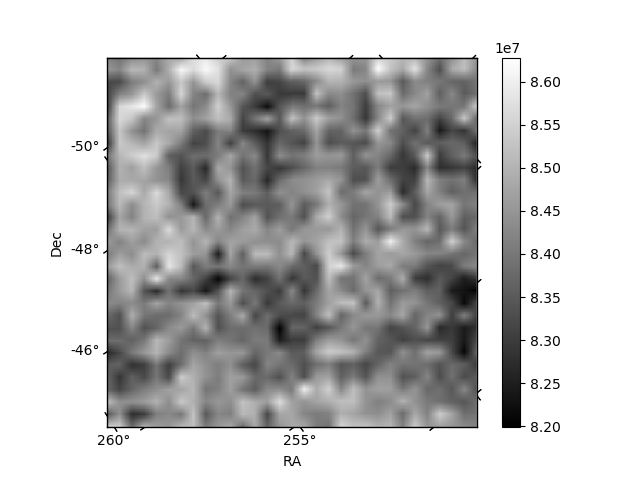
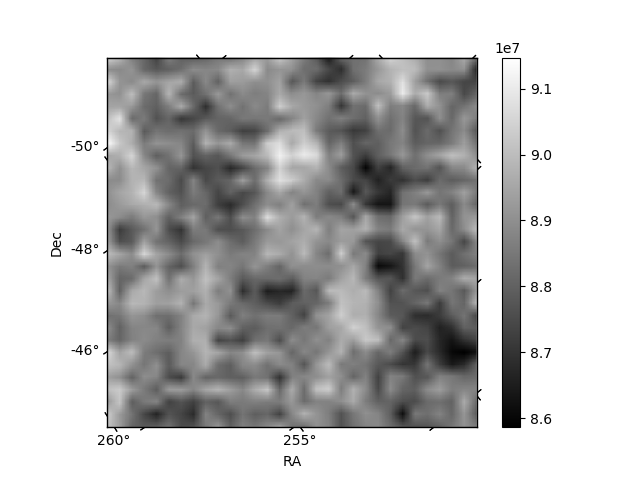
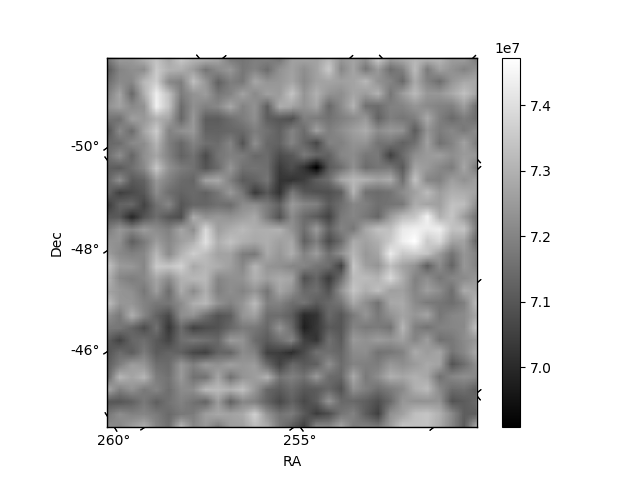
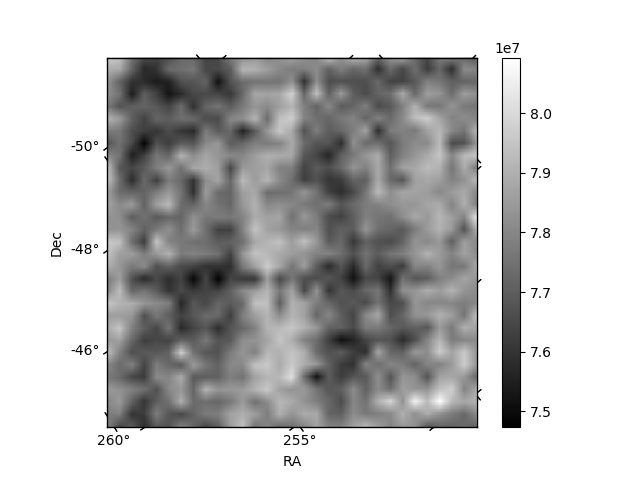
Histogram calculated using DETX and DETY for each event in the final _common_clean file
| Quadrant A | 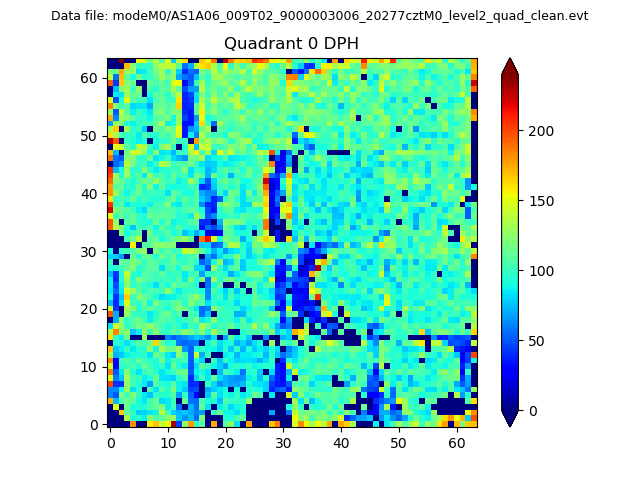 |
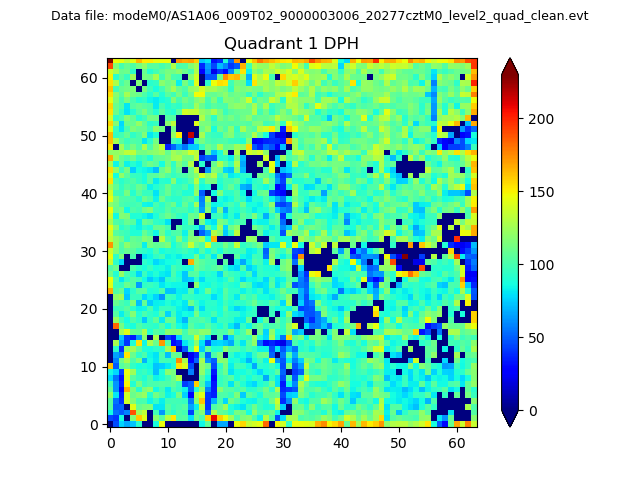 |
Quadrant B |
|---|---|---|---|
| Quadrant D | 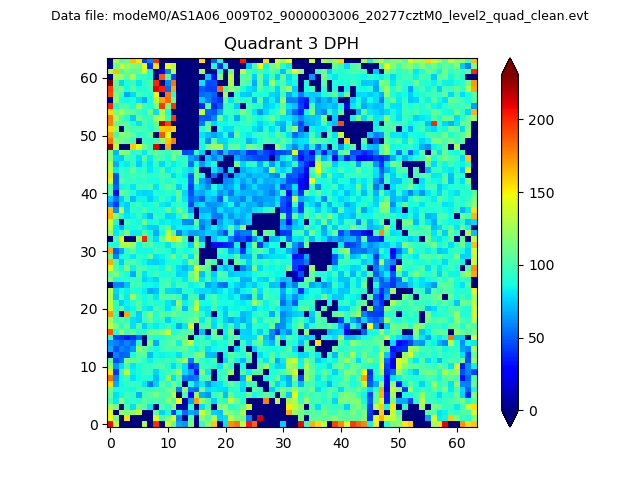 |
 |
Quadrant C |
| Plot type | Count rate plots | Images |
|---|---|---|
| Comparison with Poisson distribution Blue bars denote a histogram of data divided into 1 sec bins. Red curve is a Poisson curve with rate = median count rate of data. |
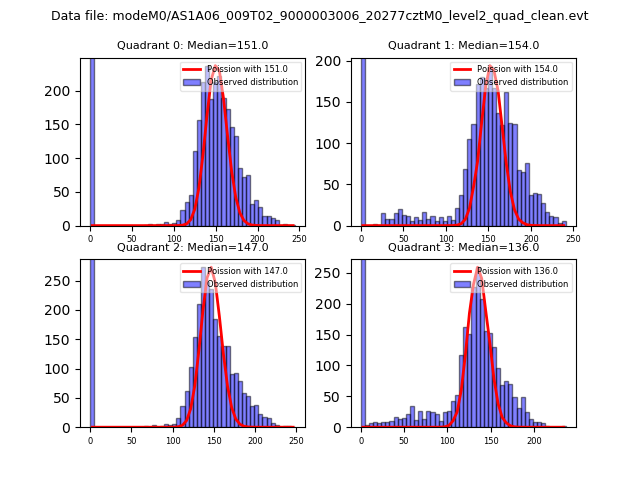 |
 |
| Quadrant-wise count rates Data is divided into 100 sec bins |
 |
|
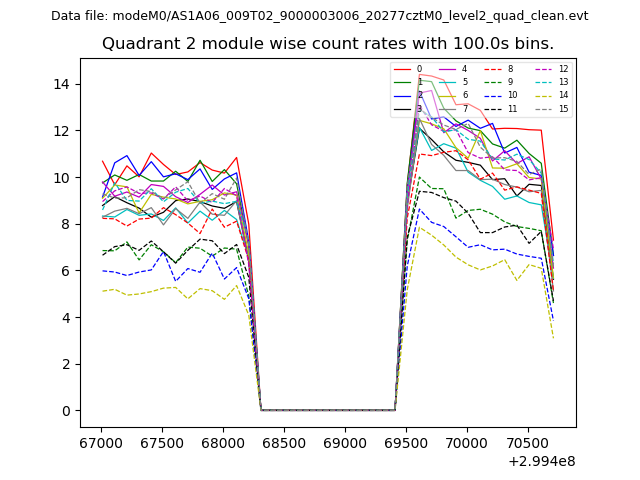
| Module-wise count rates for Quadrant A Data is divided into 100 sec bins |
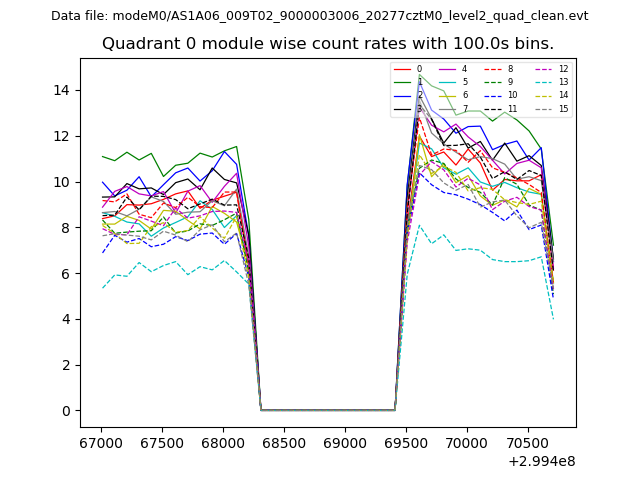 |
 |
| Module-wise count rates for Quadrant B Data is divided into 100 sec bins |
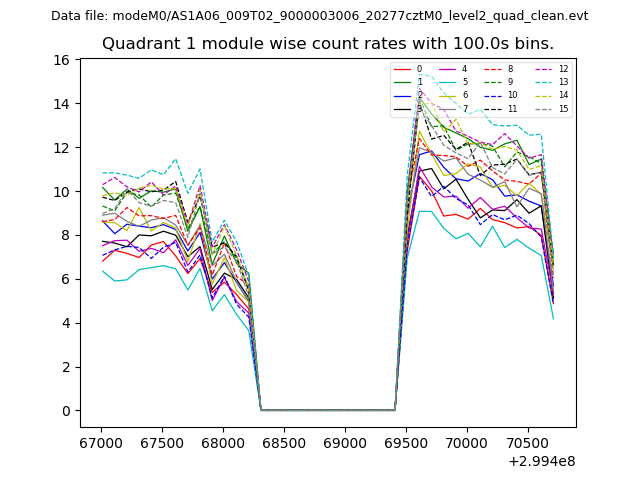 |
 |
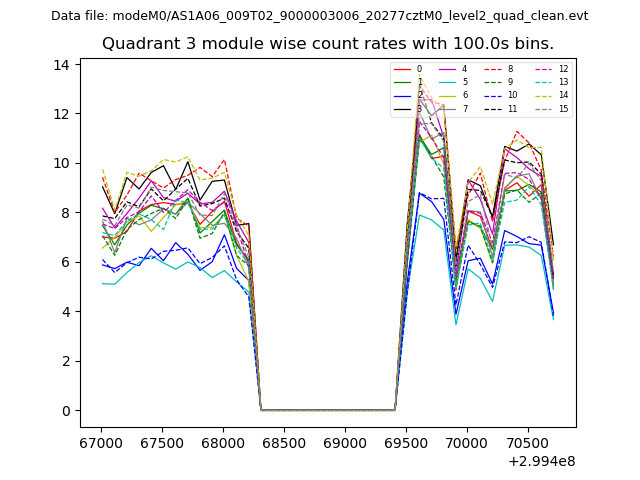
| Module-wise count rates for Quadrant C Data is divided into 100 sec bins |
 |
 |
| Module-wise count rates for Quadrant D Data is divided into 100 sec bins |
 |
 |
| Parameter | Plot |
|---|---|
| CZT HV Monitor | 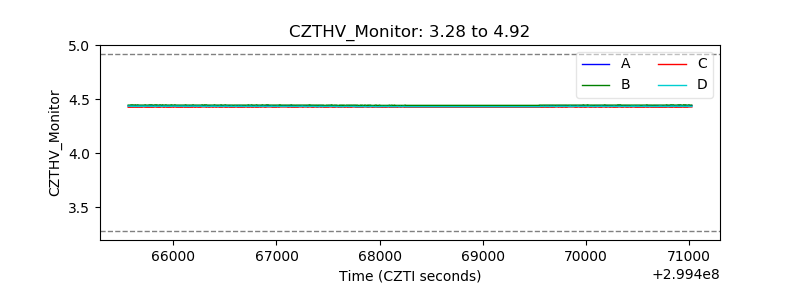 |
| D_VDD | 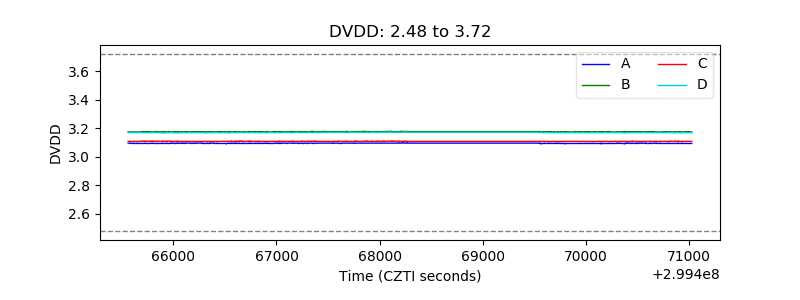 |
| Temperature 1 | 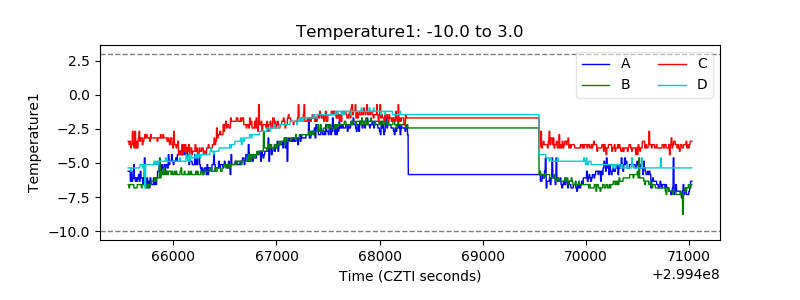 |
| Veto HV Monitor | 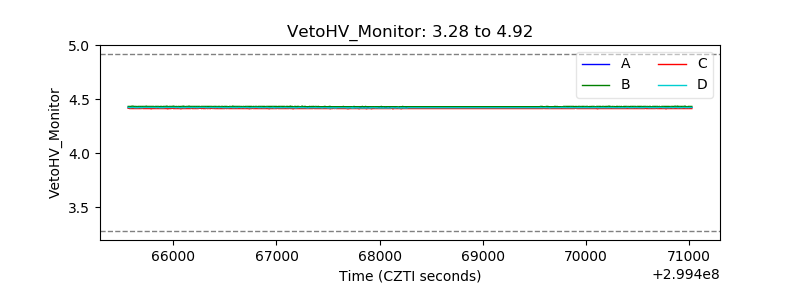 |
| Veto LLD | 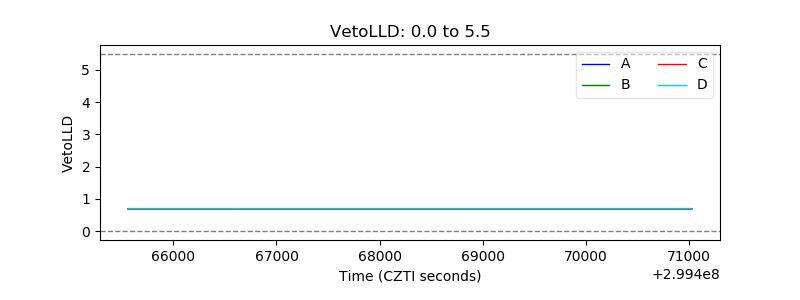 |
| Alpha Counter | 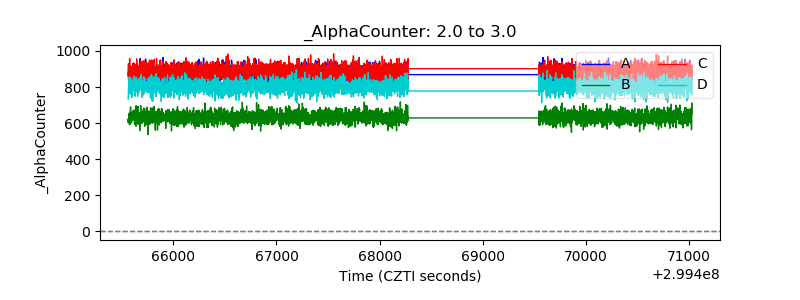 |
| _CPM_Rate | 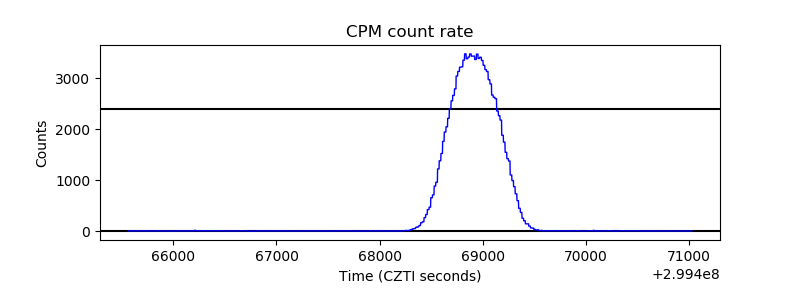 |
| CZT Counter | 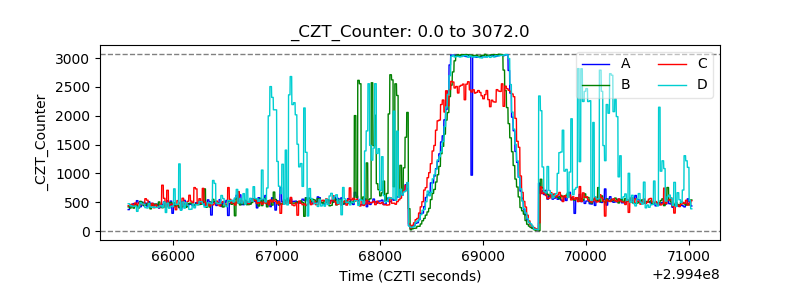 |
| +2.5 Volts monitor |  |
| +5 Volts monitor |  |
| _ROLL_ROT | 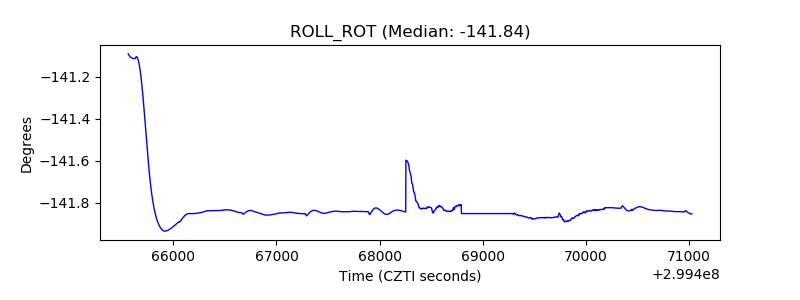 |
| _Roll_DEC | 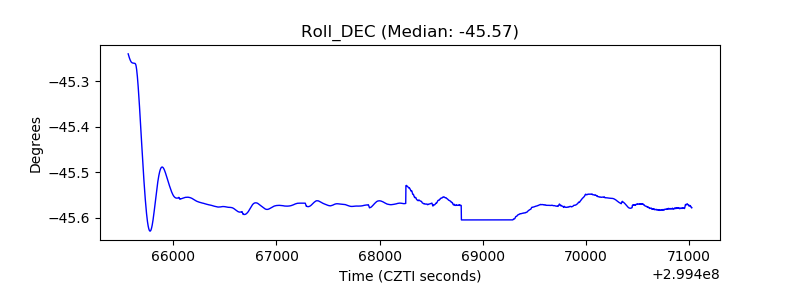 |
| _Roll_RA |  |
| Veto Counter | 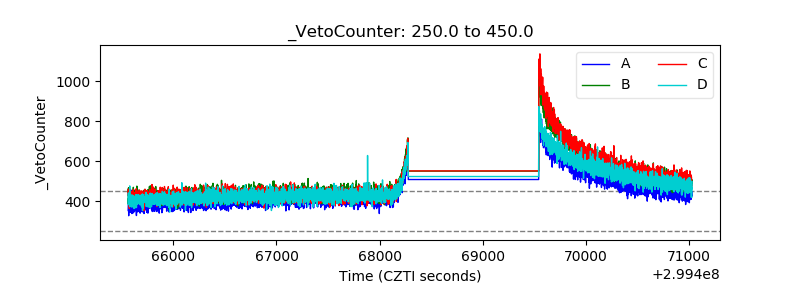 |