| Param | Original file | Final file |
|---|---|---|
| Filename | modeM0/AS1A06_009T02_9000003006_20279cztM0_level2.evt | modeM0/AS1A06_009T02_9000003006_20279cztM0_level2_quad_clean.evt |
| Size (bytes) | 466,107,840 | 80,579,520 |
| Size | 444.5 MB | 76.8 MB |
| Events in quadrant A | 3,379,073 | 503,766 |
| Events in quadrant B | 3,380,650 | 520,973 |
| Events in quadrant C | 3,274,159 | 501,260 |
| Events in quadrant D | 3,662,841 | 482,759 |
| Mode M0 | |||
|---|---|---|---|
| Quadrant | BADHDUFLAG | Total packets | Discarded packets |
| A | 0 | 13567 | 2 |
| B | 0 | 13617 | 2 |
| C | 0 | 13191 | 2 |
| D | 0 | 14696 | 2 |
| Mode M9 | |||
|---|---|---|---|
| Quadrant | BADHDUFLAG | Total packets | Discarded packets |
| A | 0 | 19 | 0 |
| B | 0 | 20 | 0 |
| C | 0 | 20 | 0 |
| D | 0 | 20 | 0 |
| Mode SS | |||
|---|---|---|---|
| Quadrant | BADHDUFLAG | Total packets | Discarded packets |
| A | 0 | 126 | 0 |
| B | 0 | 126 | 0 |
| C | 0 | 126 | 0 |
| D | 0 | 126 | 0 |
| Quadrant | Total seconds | Saturated seconds | Saturation percentage |
|---|---|---|---|
| A | 6178 | 73 | 1.181612% |
| B | 6177 | 44 | 0.712320% |
| C | 6177 | 59 | 0.955156% |
| D | 6177 | 63 | 1.019913% |
Noise dominated data is calculated using 1-second bins in cleaned event files. If a bin has >2000 counts, and if more than 50% of those come from <1% of pixels, then it is considered to be noise-dominated and hence unusable.
| Quadrant | # 1 sec bins | Bins with >0 counts | Bins with >2000 counts | High rate bins dominated by noise | Noise dominated (total time) | Noise dominated (detector-on time) | Marked lightcurve |
|---|---|---|---|---|---|---|---|
| A | 7558 | 6179 | 40 | 40 | 0.53% | 0.65% | 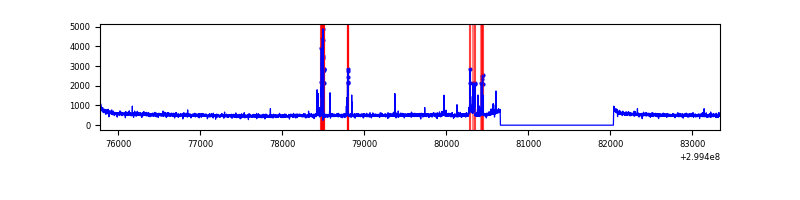 |
| B | 7557 | 6178 | 10 | 10 | 0.13% | 0.16% | 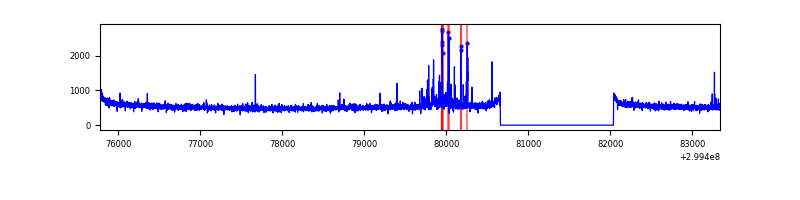 |
| C | 7557 | 6178 | 0 | 0 | 0.00% | 0.00% | 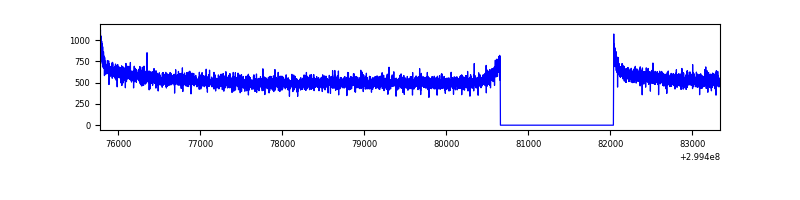 |
| D | 7557 | 6178 | 48 | 48 | 0.64% | 0.78% | 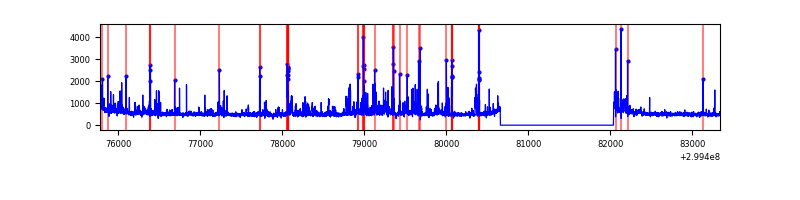 |
Top three noisy pixels from each quadrant. If the there are fewer than three noisy pixels in the level2.evt file, extra rows are filled as -1
| Pixel properties | Quadrant properties | ||||||
|---|---|---|---|---|---|---|---|
| Quadrant | DetID | PixID | Counts | Sigma | Mean | Median | Sigma |
| A | 4 | 2 | 153918 | 948.01 | 814 | 798 | 161.5 |
| A | 14 | 238 | 42830 | 260.23 | 814 | 798 | 161.5 |
| A | 8 | 205 | 26341 | 158.14 | 814 | 798 | 161.5 |
| B | 7 | 220 | 63074 | 408.82 | 826 | 808 | 152.3 |
| B | 4 | 142 | 39891 | 256.61 | 826 | 808 | 152.3 |
| B | 12 | 17 | 18187 | 114.11 | 826 | 808 | 152.3 |
| C | 14 | 238 | 128303 | 687.56 | 804 | 812 | 185.4 |
| C | 3 | 233 | 9122 | 44.82 | 804 | 812 | 185.4 |
| C | 13 | 61 | 5552 | 25.56 | 804 | 812 | 185.4 |
| D | 1 | 52 | 591707 | 3084.12 | 802 | 781 | 191.6 |
| D | 2 | 234 | 32507 | 165.58 | 802 | 781 | 191.6 |
| D | 9 | 1 | 15732 | 78.03 | 802 | 781 | 191.6 |
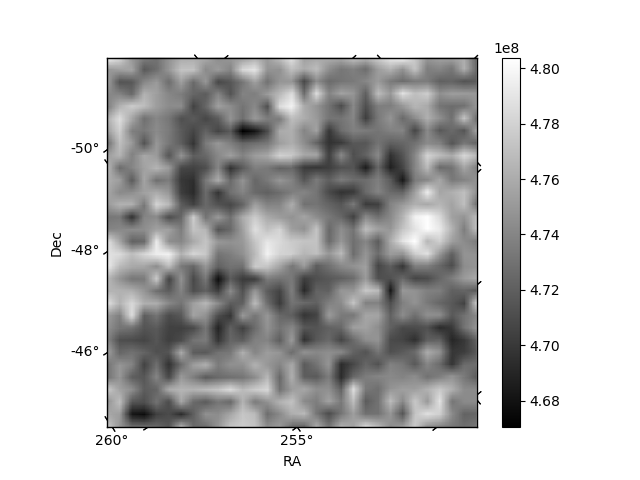
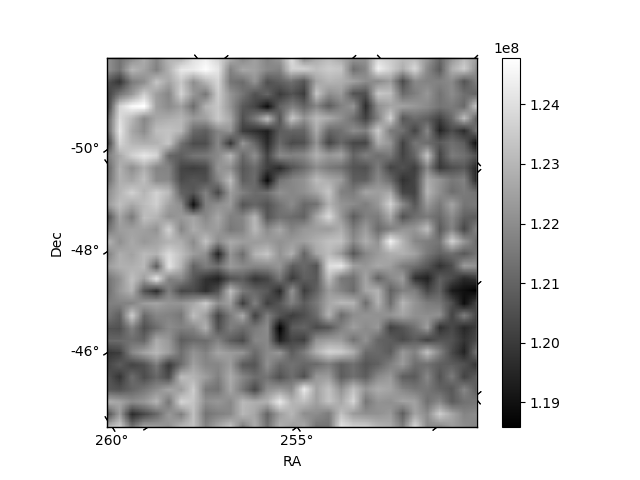
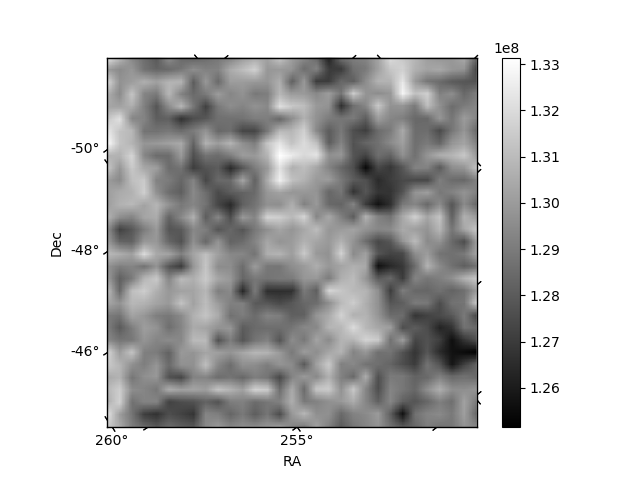
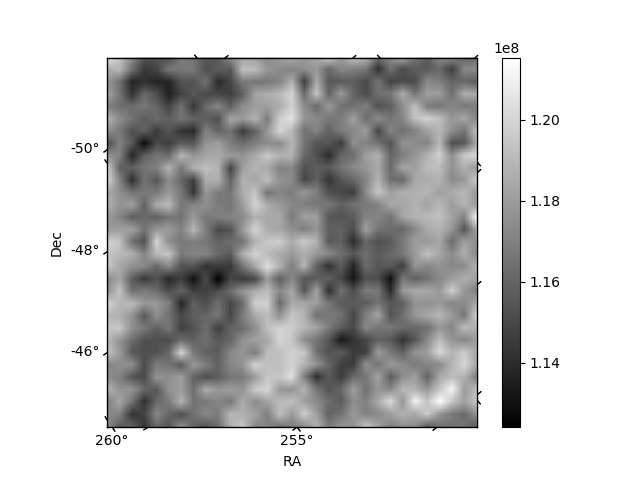
Histogram calculated using DETX and DETY for each event in the final _common_clean file
| Quadrant A |  |
 |
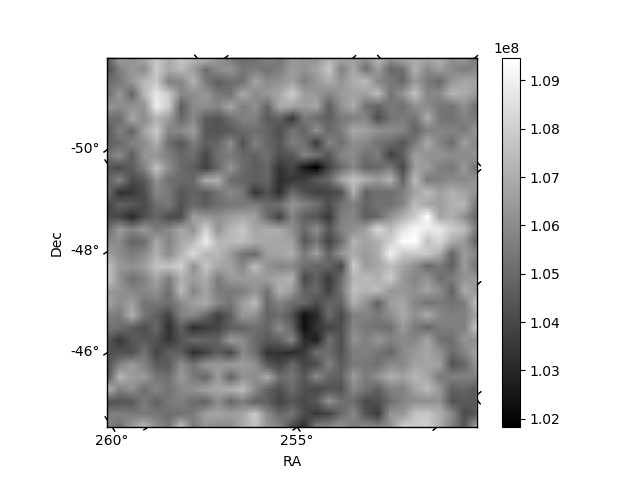
Quadrant B |
|---|---|---|---|
| Quadrant D |  |
 |
Quadrant C |
| Plot type | Count rate plots | Images |
|---|---|---|
| Comparison with Poisson distribution Blue bars denote a histogram of data divided into 1 sec bins. Red curve is a Poisson curve with rate = median count rate of data. |
 |
 |
| Quadrant-wise count rates Data is divided into 100 sec bins |
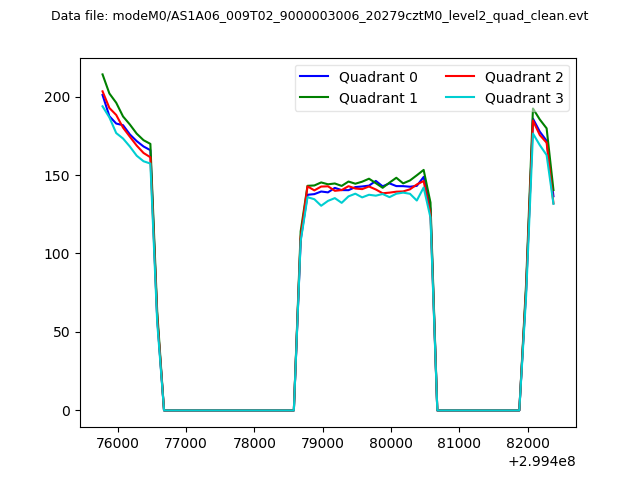 |
|
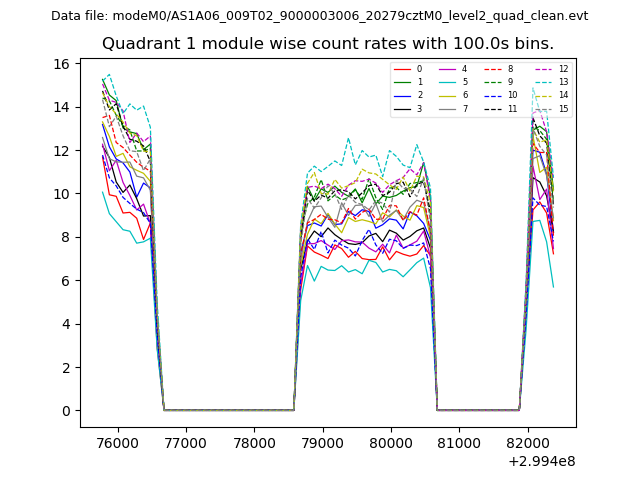
| Module-wise count rates for Quadrant A Data is divided into 100 sec bins |
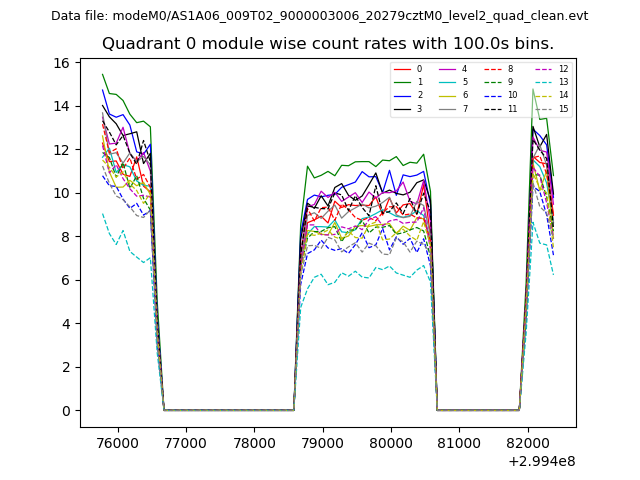 |
 |
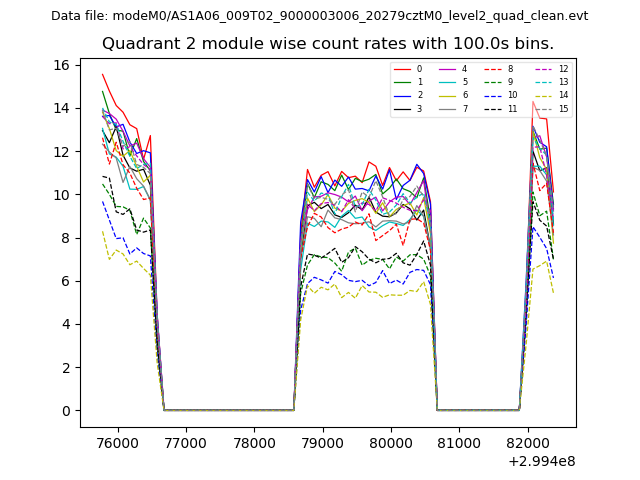
| Module-wise count rates for Quadrant B Data is divided into 100 sec bins |
 |
 |
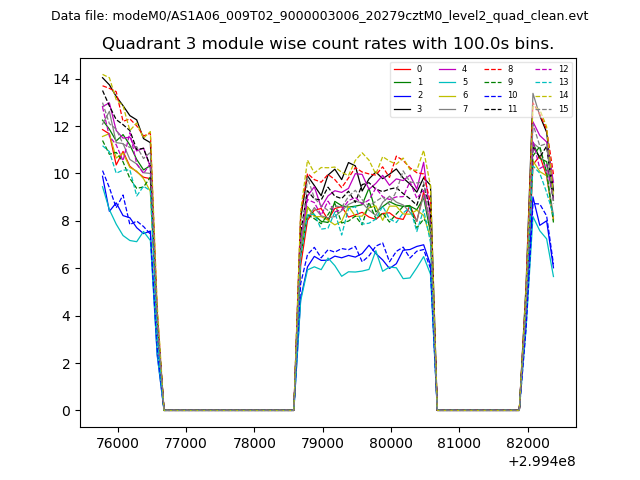
| Module-wise count rates for Quadrant C Data is divided into 100 sec bins |
 |
 |
| Module-wise count rates for Quadrant D Data is divided into 100 sec bins |
 |
 |
| Parameter | Plot |
|---|---|
| CZT HV Monitor | 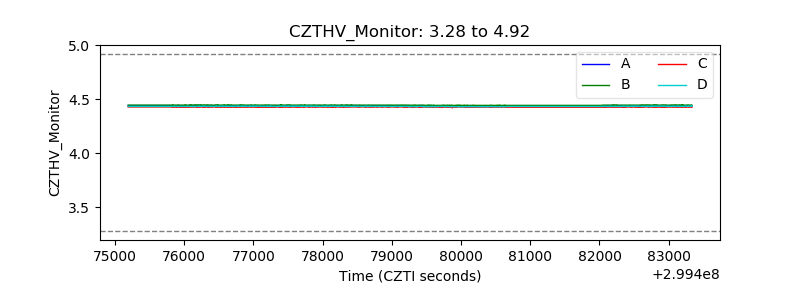 |
| D_VDD | 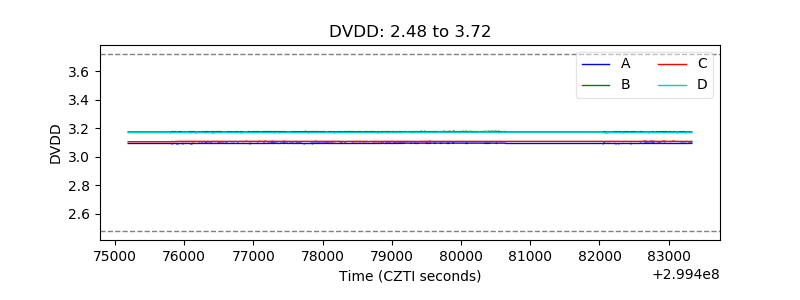 |
| Temperature 1 | 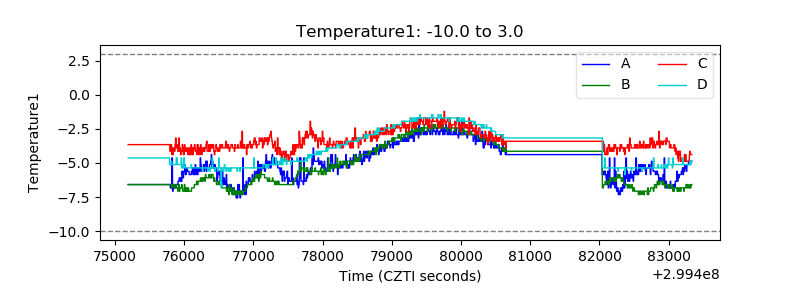 |
| Veto HV Monitor |  |
| Veto LLD | 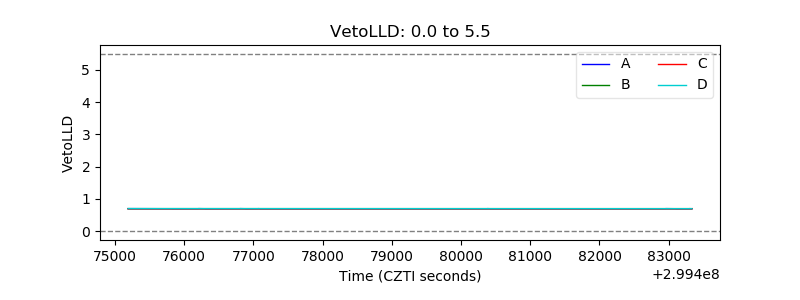 |
| Alpha Counter | 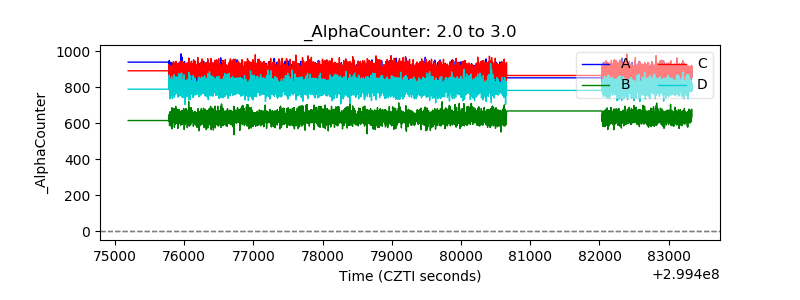 |
| _CPM_Rate | 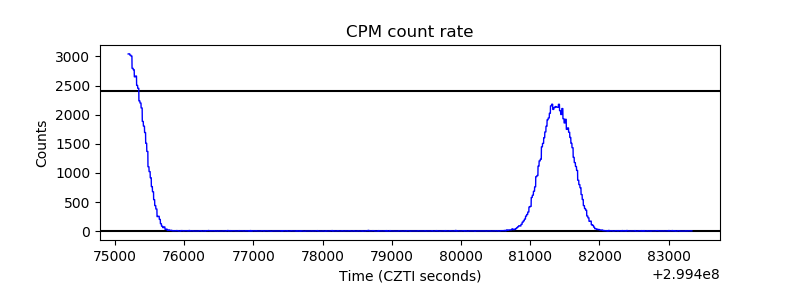 |
| CZT Counter | 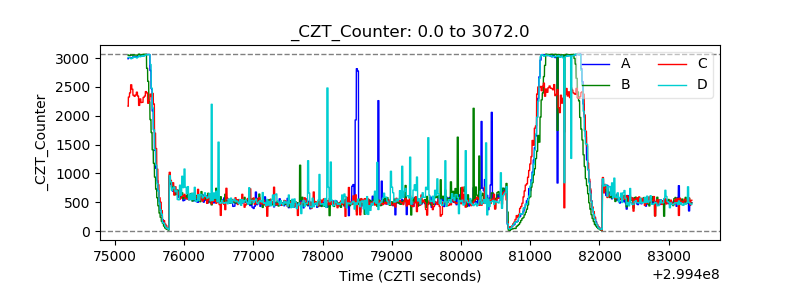 |
| +2.5 Volts monitor |  |
| +5 Volts monitor | 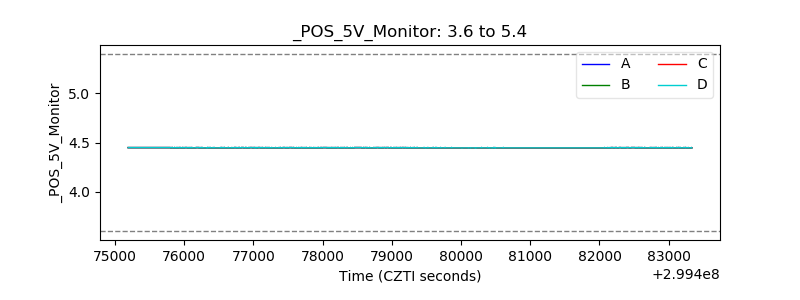 |
| _ROLL_ROT | 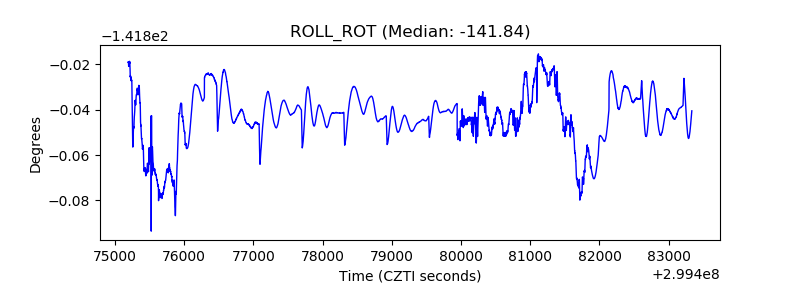 |
| _Roll_DEC | 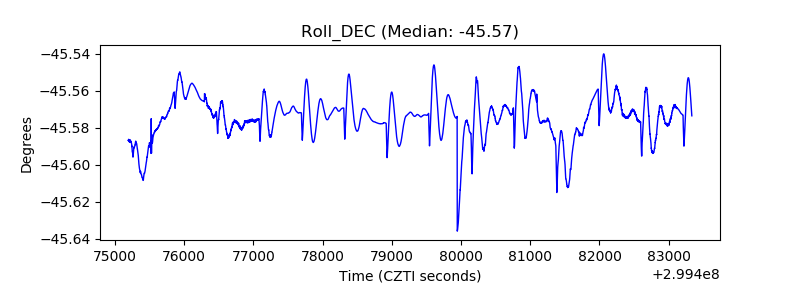 |
| _Roll_RA | 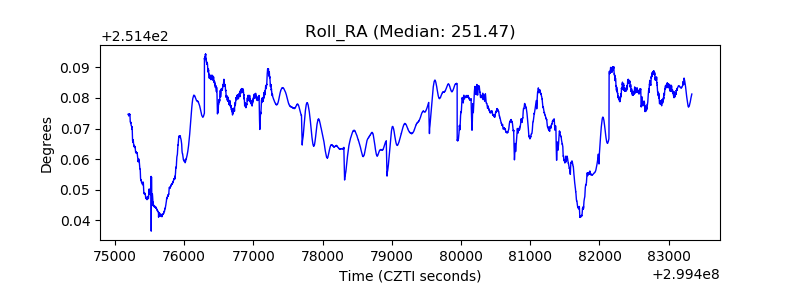 |
| Veto Counter | 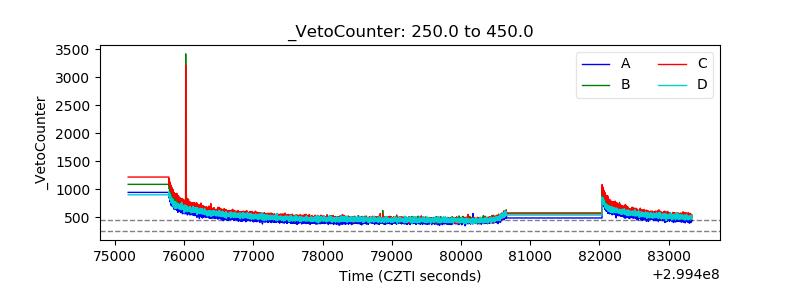 |