| Param | Original file | Final file |
|---|---|---|
| Filename | modeM0/AS1A06_009T02_9000003006_20280cztM0_level2.evt | modeM0/AS1A06_009T02_9000003006_20280cztM0_level2_quad_clean.evt |
| Size (bytes) | 199,036,800 | 21,021,120 |
| Size | 189.8 MB | 20.0 MB |
| Events in quadrant A | 1,387,495 | 109,195 |
| Events in quadrant B | 1,422,020 | 114,184 |
| Events in quadrant C | 1,448,545 | 109,599 |
| Events in quadrant D | 1,580,065 | 105,218 |
| Mode M0 | |||
|---|---|---|---|
| Quadrant | BADHDUFLAG | Total packets | Discarded packets |
| A | 0 | 5710 | 1 |
| B | 0 | 5791 | 1 |
| C | 0 | 5832 | 1 |
| D | 0 | 6382 | 1 |
| Mode M9 | |||
|---|---|---|---|
| Quadrant | BADHDUFLAG | Total packets | Discarded packets |
| A | 0 | 5 | 0 |
| B | 0 | 6 | 0 |
| C | 0 | 6 | 0 |
| D | 0 | 6 | 0 |
| Mode SS | |||
|---|---|---|---|
| Quadrant | BADHDUFLAG | Total packets | Discarded packets |
| A | 0 | 56 | 0 |
| B | 0 | 56 | 0 |
| C | 0 | 56 | 0 |
| D | 0 | 56 | 0 |
| Quadrant | Total seconds | Saturated seconds | Saturation percentage |
|---|---|---|---|
| A | 2760 | 2 | 0.072464% |
| B | 2760 | 4 | 0.144928% |
| C | 2760 | 19 | 0.688406% |
| D | 2760 | 26 | 0.942029% |
Noise dominated data is calculated using 1-second bins in cleaned event files. If a bin has >2000 counts, and if more than 50% of those come from <1% of pixels, then it is considered to be noise-dominated and hence unusable.
| Quadrant | # 1 sec bins | Bins with >0 counts | Bins with >2000 counts | High rate bins dominated by noise | Noise dominated (total time) | Noise dominated (detector-on time) | Marked lightcurve |
|---|---|---|---|---|---|---|---|
| A | 2760 | 2760 | 0 | 0 | 0.00% | 0.00% |  |
| B | 2760 | 2760 | 0 | 0 | 0.00% | 0.00% |  |
| C | 2760 | 2760 | 0 | 0 | 0.00% | 0.00% |  |
| D | 2760 | 2760 | 16 | 16 | 0.58% | 0.58% |  |
Top three noisy pixels from each quadrant. If the there are fewer than three noisy pixels in the level2.evt file, extra rows are filled as -1
| Pixel properties | Quadrant properties | ||||||
|---|---|---|---|---|---|---|---|
| Quadrant | DetID | PixID | Counts | Sigma | Mean | Median | Sigma |
| A | 4 | 2 | 11770 | 158.44 | 356 | 350 | 72.1 |
| A | 0 | 226 | 2957 | 36.17 | 356 | 350 | 72.1 |
| A | 14 | 238 | 2881 | 35.12 | 356 | 350 | 72.1 |
| B | 12 | 111 | 7786 | 109.71 | 361 | 353 | 67.7 |
| B | 11 | 111 | 6835 | 95.67 | 361 | 353 | 67.7 |
| B | 14 | 111 | 6255 | 87.11 | 361 | 353 | 67.7 |
| C | 14 | 238 | 56773 | 682.14 | 355 | 358 | 82.7 |
| C | 3 | 233 | 5390 | 60.84 | 355 | 358 | 82.7 |
| C | 13 | 61 | 2496 | 25.85 | 355 | 358 | 82.7 |
| D | 1 | 52 | 239891 | 2800.14 | 352 | 342 | 85.5 |
| D | 2 | 234 | 14991 | 171.24 | 352 | 342 | 85.5 |
| D | 13 | 138 | 4431 | 47.8 | 352 | 342 | 85.5 |
Histogram calculated using DETX and DETY for each event in the final _common_clean file
| Quadrant A |  |
 |
Quadrant B |
|---|---|---|---|
| Quadrant D |  |
 |
Quadrant C |
| Plot type | Count rate plots | Images |
|---|---|---|
| Comparison with Poisson distribution Blue bars denote a histogram of data divided into 1 sec bins. Red curve is a Poisson curve with rate = median count rate of data. |
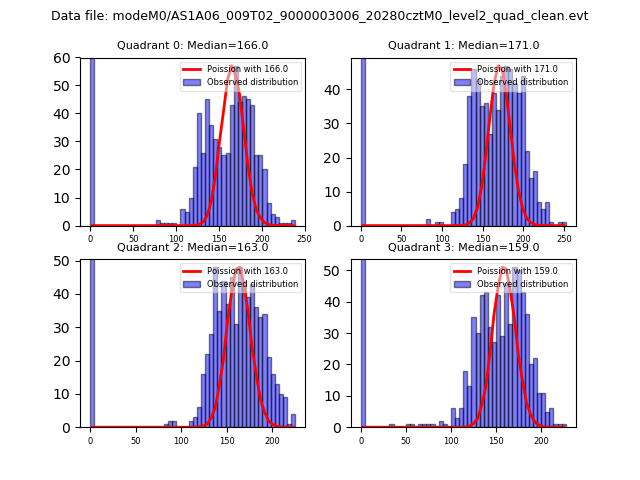 |
 |
| Quadrant-wise count rates Data is divided into 100 sec bins |
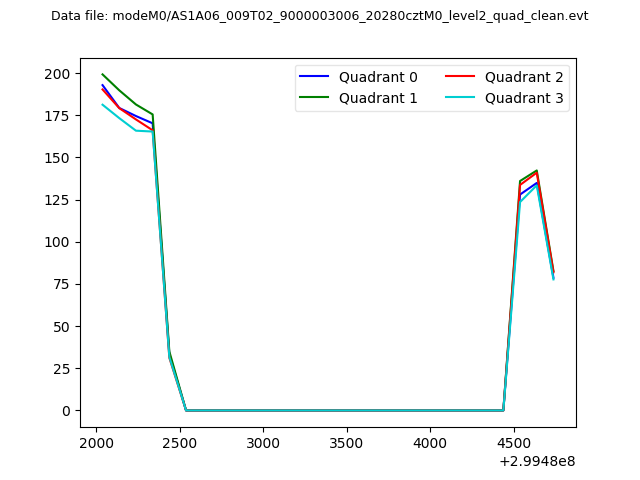 |
|
| Module-wise count rates for Quadrant A Data is divided into 100 sec bins |
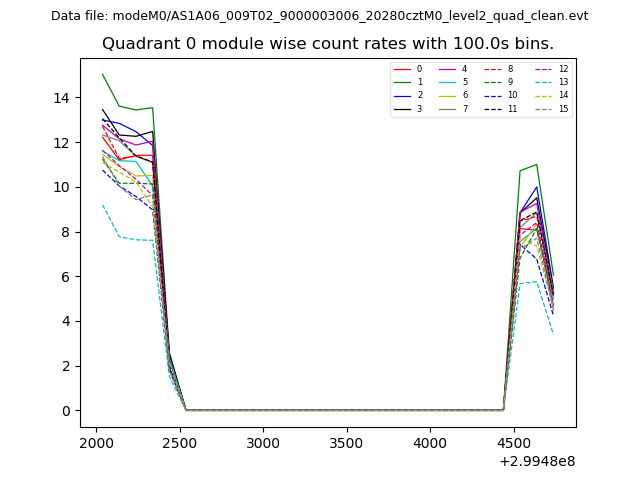 |
 |
| Module-wise count rates for Quadrant B Data is divided into 100 sec bins |
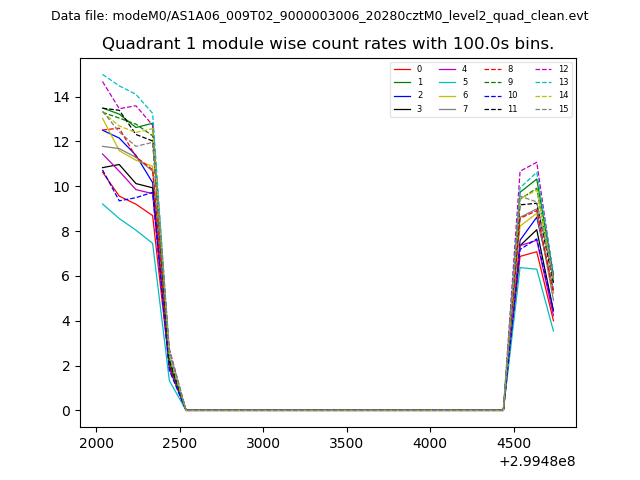 |
 |
| Module-wise count rates for Quadrant C Data is divided into 100 sec bins |
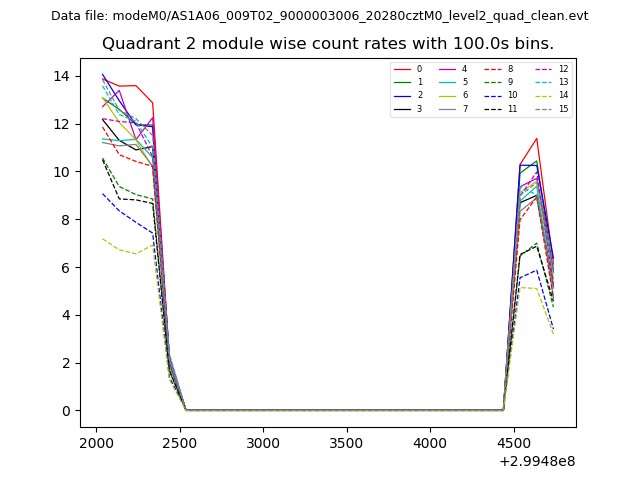 |
 |
| Module-wise count rates for Quadrant D Data is divided into 100 sec bins |
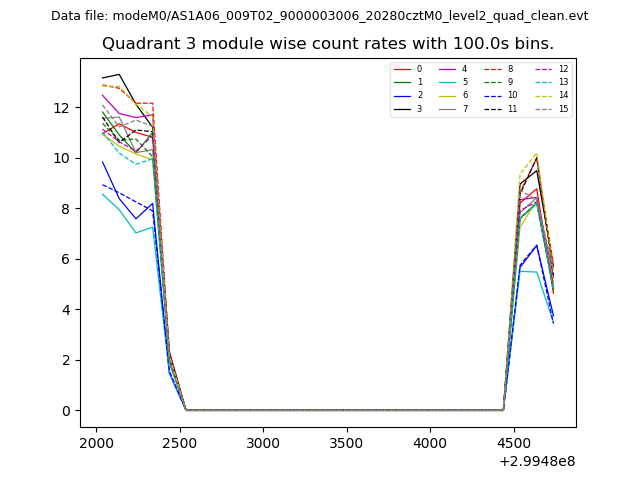 |
 |
| Parameter | Plot |
|---|---|
| CZT HV Monitor | 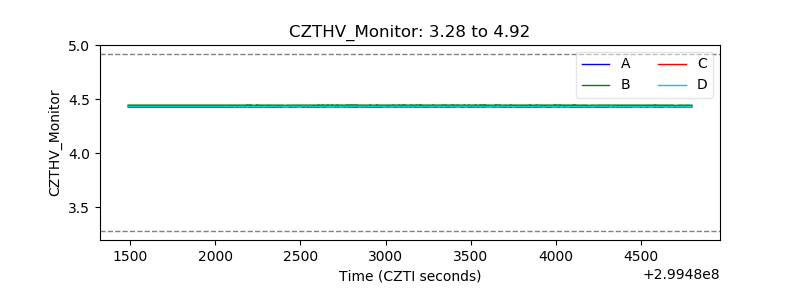 |
| D_VDD |  |
| Temperature 1 |  |
| Veto HV Monitor |  |
| Veto LLD |  |
| Alpha Counter | 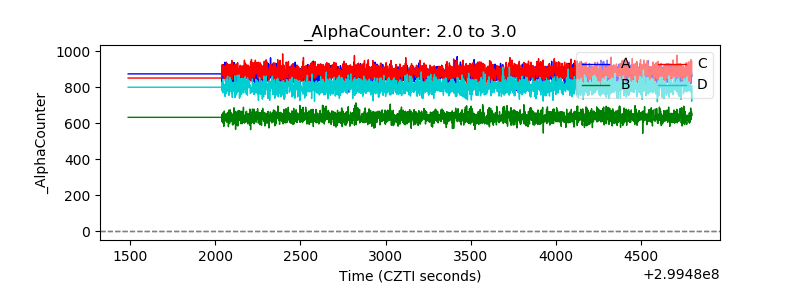 |
| _CPM_Rate | 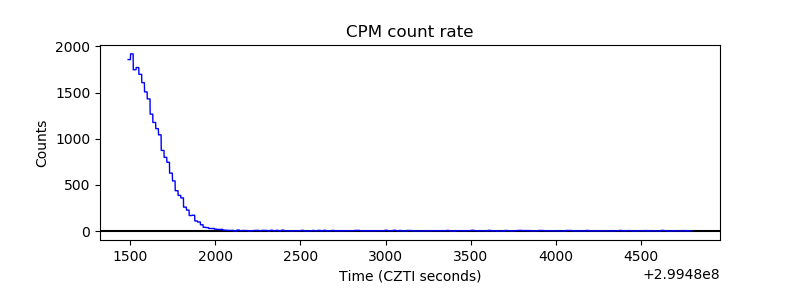 |
| CZT Counter |  |
| +2.5 Volts monitor |  |
| +5 Volts monitor |  |
| _ROLL_ROT | 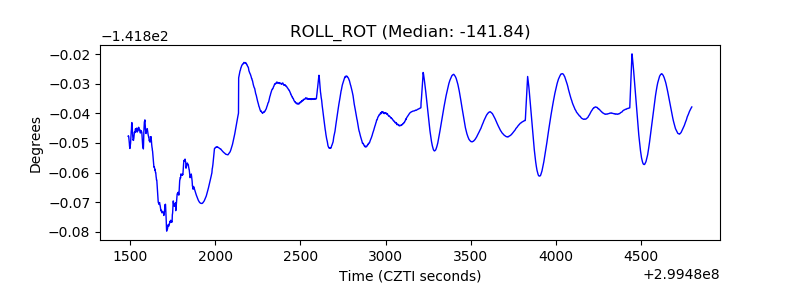 |
| _Roll_DEC | 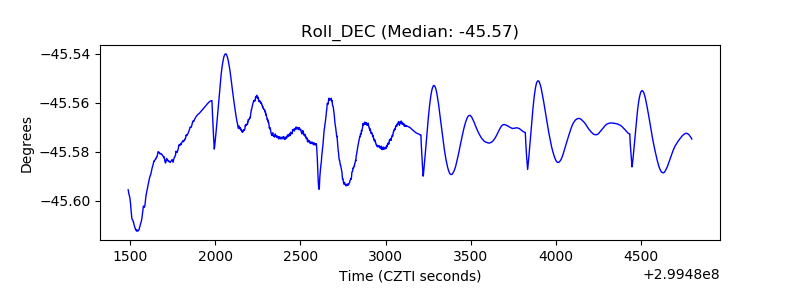 |
| _Roll_RA |  |
| Veto Counter | 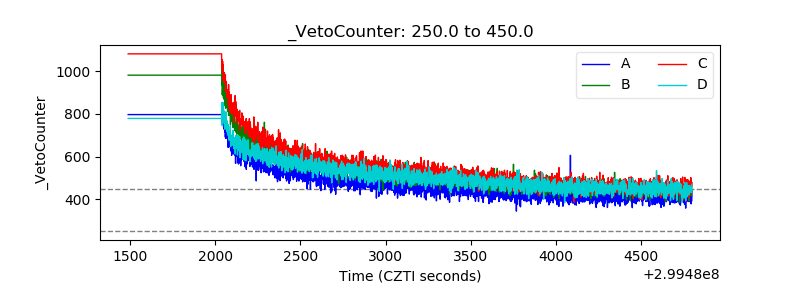 |