| Param | Original file | Final file |
|---|---|---|
| Filename | modeM0/AS1A05_163T01_9000003010_20339cztM0_level2.evt | modeM0/AS1A05_163T01_9000003010_20339cztM0_level2_quad_clean.evt |
| Size (bytes) | 456,966,720 | 77,330,880 |
| Size | 435.8 MB | 73.7 MB |
| Events in quadrant A | 3,226,991 | 473,199 |
| Events in quadrant B | 3,281,024 | 481,323 |
| Events in quadrant C | 3,266,101 | 463,776 |
| Events in quadrant D | 3,613,312 | 459,632 |
| Mode SS | |||
|---|---|---|---|
| Quadrant | BADHDUFLAG | Total packets | Discarded packets |
| A | 0 | 134 | 0 |
| B | 0 | 134 | 0 |
| C | 0 | 134 | 0 |
| D | 0 | 134 | 0 |
| Mode M0 | |||
|---|---|---|---|
| Quadrant | BADHDUFLAG | Total packets | Discarded packets |
| A | 0 | 13690 | 2 |
| B | 0 | 13737 | 2 |
| C | 0 | 13735 | 2 |
| D | 0 | 15162 | 2 |
| Mode M9 | |||
|---|---|---|---|
| Quadrant | BADHDUFLAG | Total packets | Discarded packets |
| A | 0 | 19 | 0 |
| B | 0 | 20 | 0 |
| C | 0 | 20 | 0 |
| D | 0 | 20 | 0 |
| Quadrant | Total seconds | Saturated seconds | Saturation percentage |
|---|---|---|---|
| A | 6653 | 67 | 1.007064% |
| B | 6653 | 92 | 1.382835% |
| C | 6652 | 107 | 1.608539% |
| D | 6652 | 58 | 0.871918% |
Noise dominated data is calculated using 1-second bins in cleaned event files. If a bin has >2000 counts, and if more than 50% of those come from <1% of pixels, then it is considered to be noise-dominated and hence unusable.
| Quadrant | # 1 sec bins | Bins with >0 counts | Bins with >2000 counts | High rate bins dominated by noise | Noise dominated (total time) | Noise dominated (detector-on time) | Marked lightcurve |
|---|---|---|---|---|---|---|---|
| A | 7573 | 6654 | 0 | 0 | 0.00% | 0.00% | 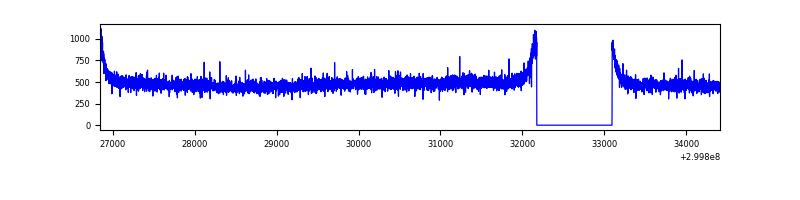 |
| B | 7573 | 6654 | 0 | 0 | 0.00% | 0.00% | 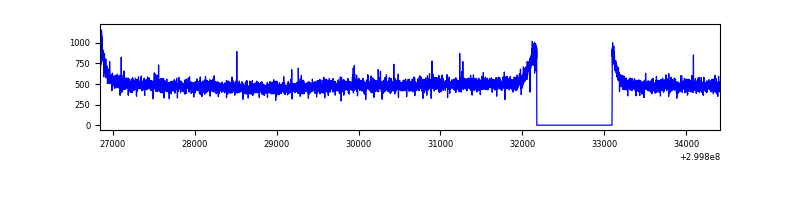 |
| C | 7572 | 6653 | 0 | 0 | 0.00% | 0.00% | 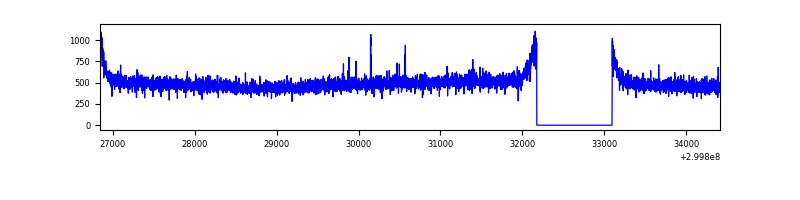 |
| D | 7572 | 6653 | 24 | 24 | 0.32% | 0.36% | 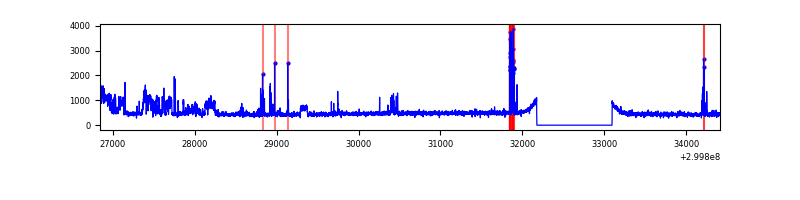 |
Top three noisy pixels from each quadrant. If the there are fewer than three noisy pixels in the level2.evt file, extra rows are filled as -1
| Pixel properties | Quadrant properties | ||||||
|---|---|---|---|---|---|---|---|
| Quadrant | DetID | PixID | Counts | Sigma | Mean | Median | Sigma |
| A | 13 | 254 | 7586 | 40.39 | 838 | 822 | 167.5 |
| A | 0 | 226 | 7484 | 39.78 | 838 | 822 | 167.5 |
| A | 3 | 137 | 6931 | 36.47 | 838 | 822 | 167.5 |
| B | 12 | 111 | 19985 | 118.7 | 835 | 813 | 161.5 |
| B | 11 | 111 | 17543 | 103.58 | 835 | 813 | 161.5 |
| B | 14 | 111 | 16400 | 96.5 | 835 | 813 | 161.5 |
| C | 14 | 238 | 124456 | 658.78 | 803 | 812 | 187.7 |
| C | 7 | 220 | 8263 | 39.7 | 803 | 812 | 187.7 |
| C | 13 | 61 | 5519 | 25.08 | 803 | 812 | 187.7 |
| D | 1 | 52 | 399056 | 2008.17 | 813 | 790 | 198.3 |
| D | 1 | 20 | 61397 | 305.6 | 813 | 790 | 198.3 |
| D | 2 | 16 | 56861 | 282.72 | 813 | 790 | 198.3 |
Histogram calculated using DETX and DETY for each event in the final _common_clean file
| Quadrant A | 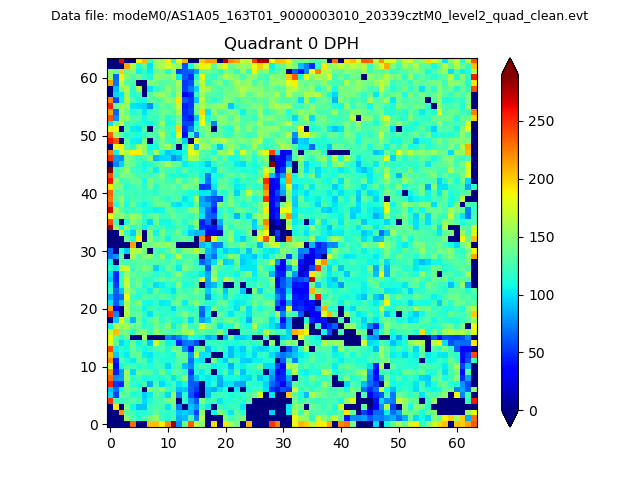 |
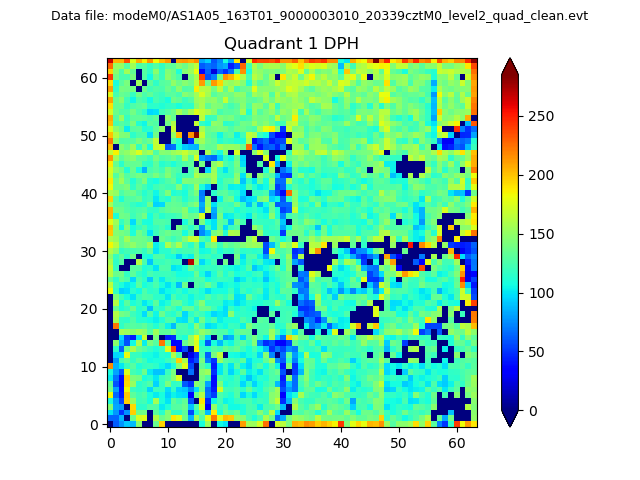 |
Quadrant B |
|---|---|---|---|
| Quadrant D | 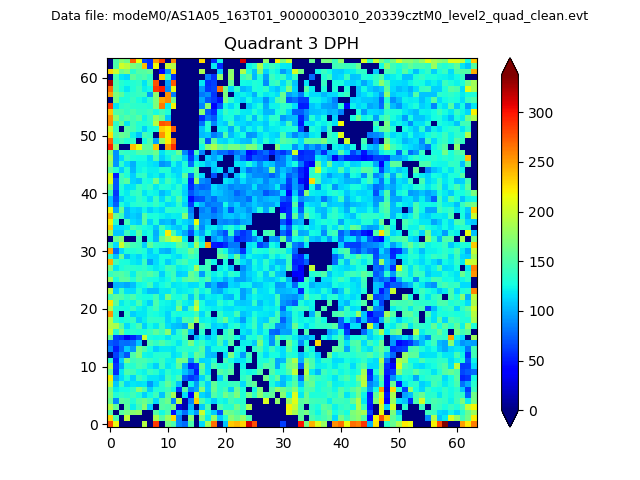 |
 |
Quadrant C |
| Plot type | Count rate plots | Images |
|---|---|---|
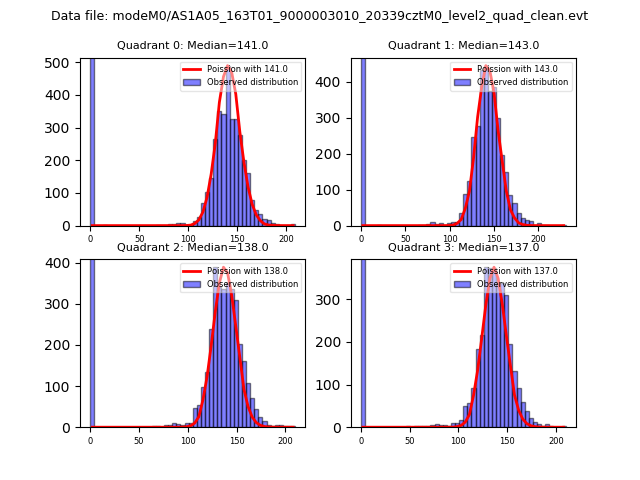
| Comparison with Poisson distribution Blue bars denote a histogram of data divided into 1 sec bins. Red curve is a Poisson curve with rate = median count rate of data. |
 |
 |
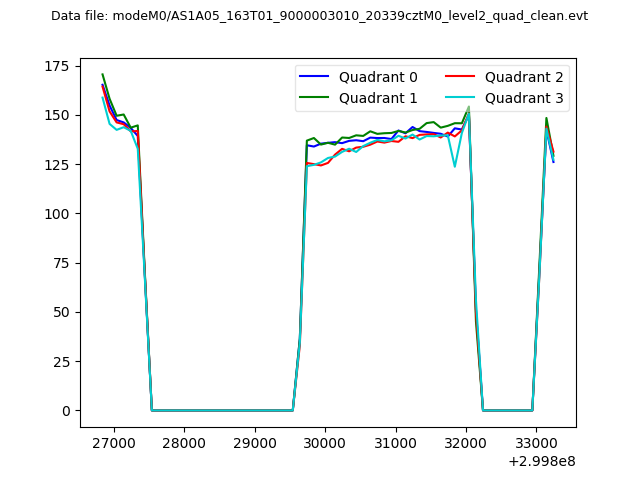
| Quadrant-wise count rates Data is divided into 100 sec bins |
 |
|
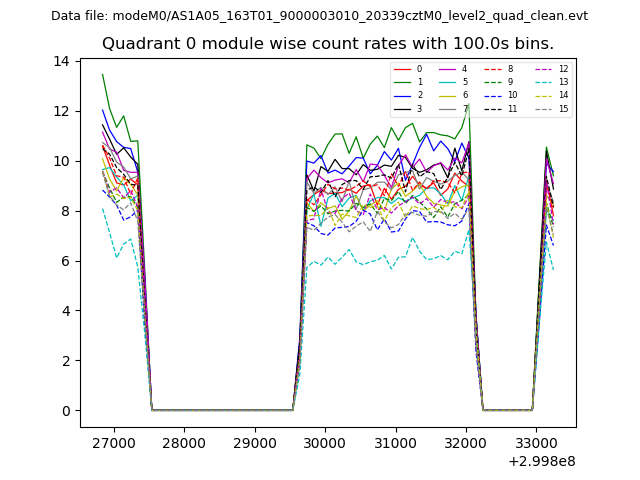
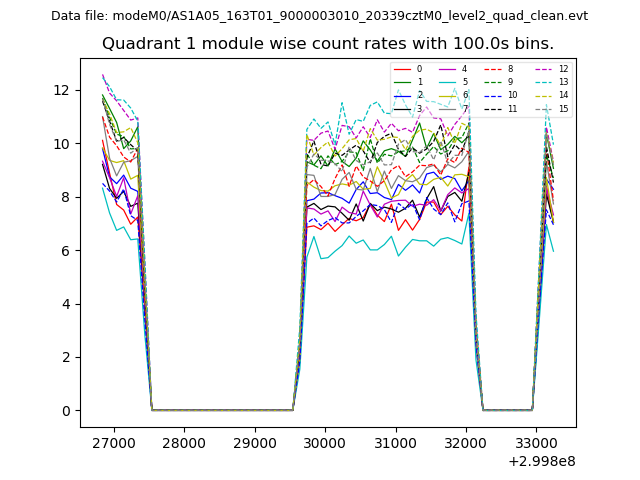
| Module-wise count rates for Quadrant A Data is divided into 100 sec bins |
 |
 |
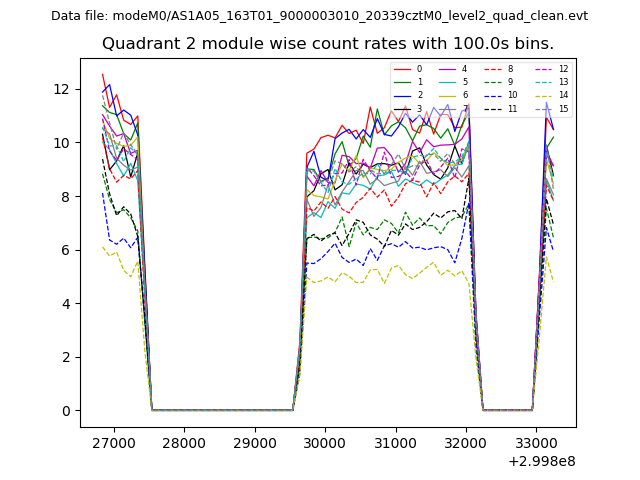
| Module-wise count rates for Quadrant B Data is divided into 100 sec bins |
 |
 |
| Module-wise count rates for Quadrant C Data is divided into 100 sec bins |
 |
 |
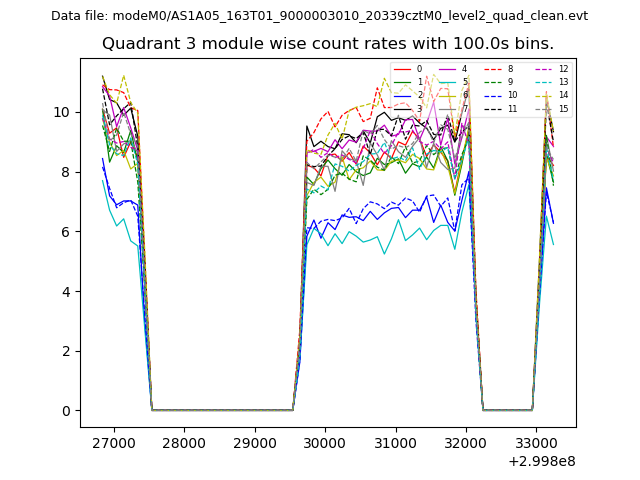
| Module-wise count rates for Quadrant D Data is divided into 100 sec bins |
 |
 |
| Parameter | Plot |
|---|---|
| CZT HV Monitor | 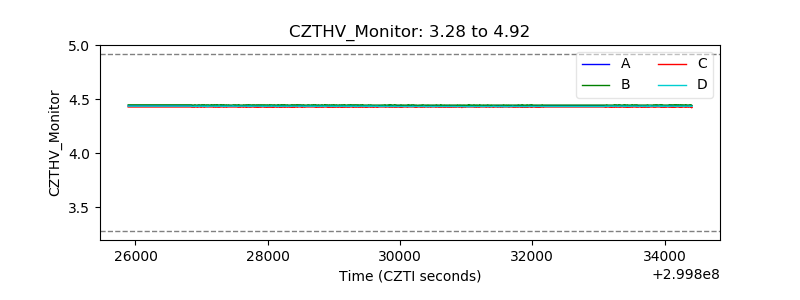 |
| D_VDD | 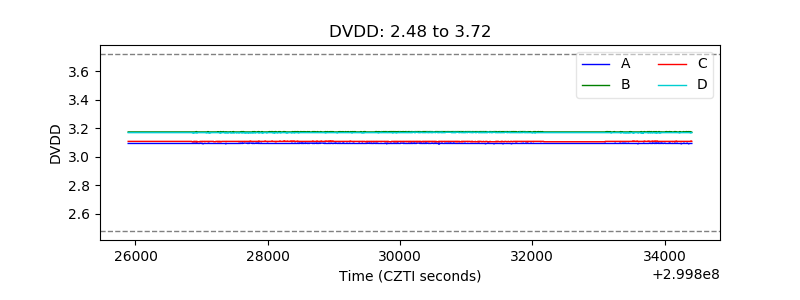 |
| Temperature 1 | 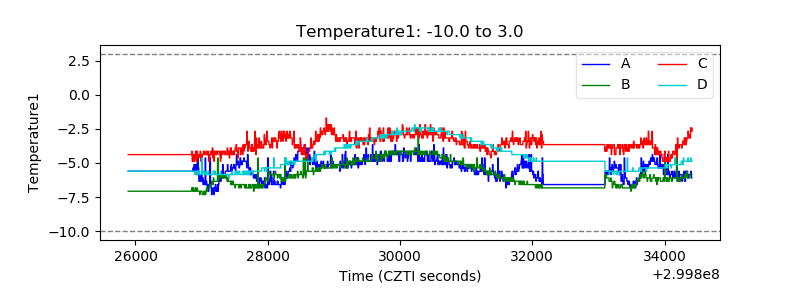 |
| Veto HV Monitor | 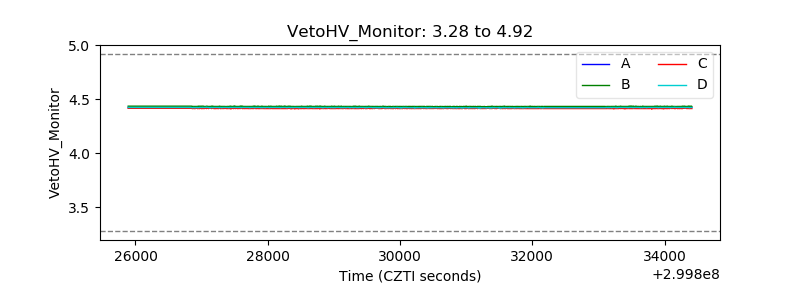 |
| Veto LLD | 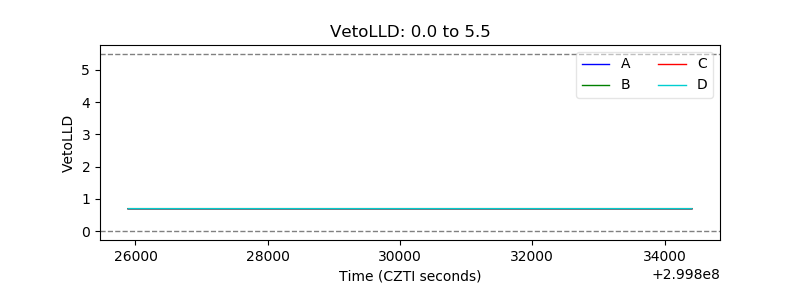 |
| Alpha Counter | 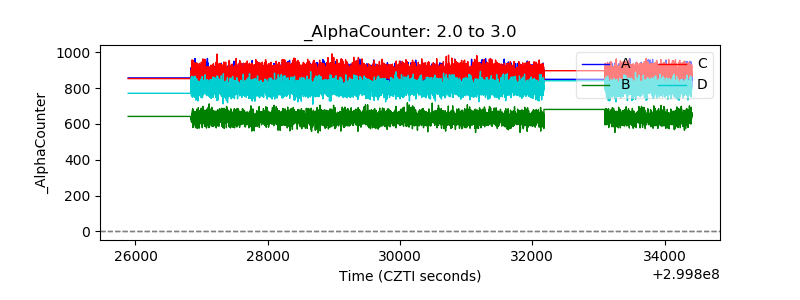 |
| _CPM_Rate | 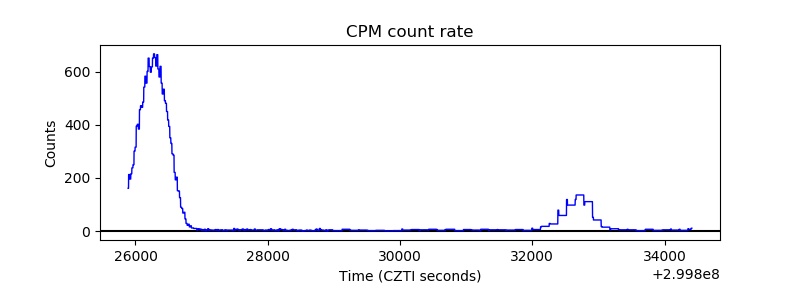 |
| CZT Counter | 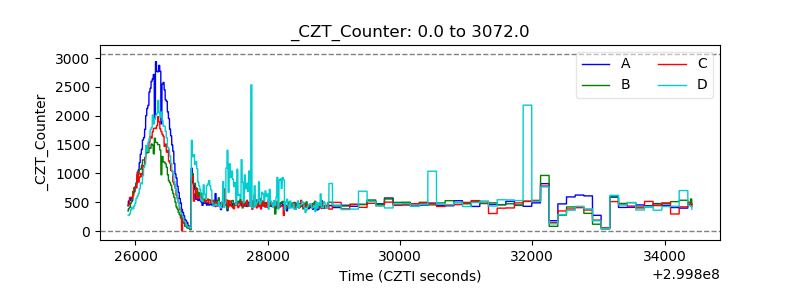 |
| +2.5 Volts monitor |  |
| +5 Volts monitor | 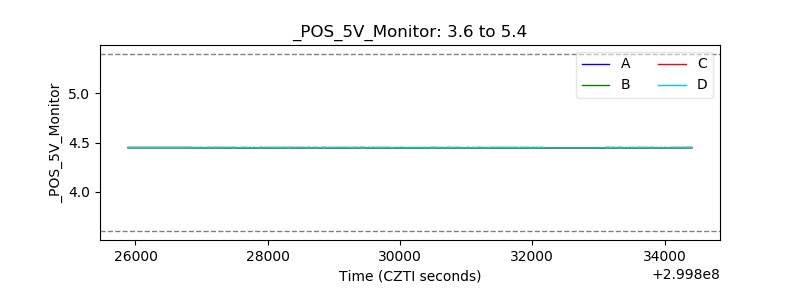 |
| _ROLL_ROT | 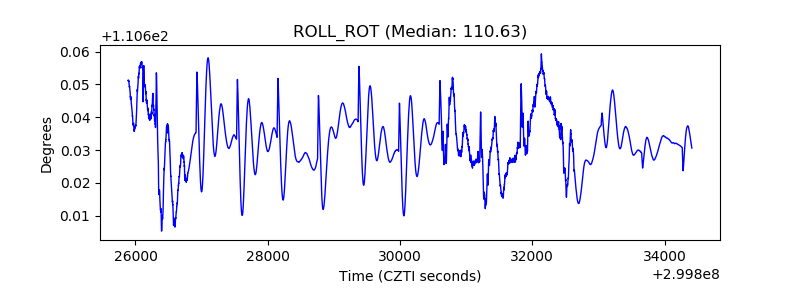 |
| _Roll_DEC | 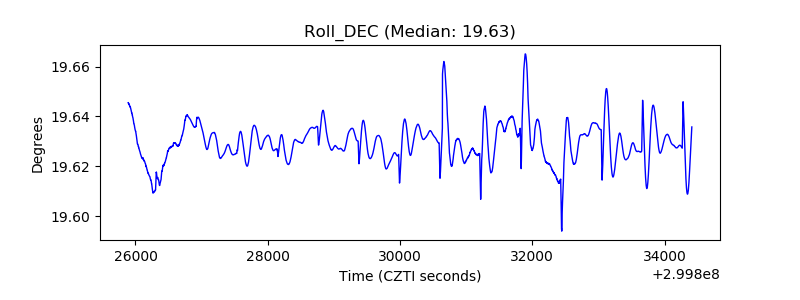 |
| _Roll_RA | 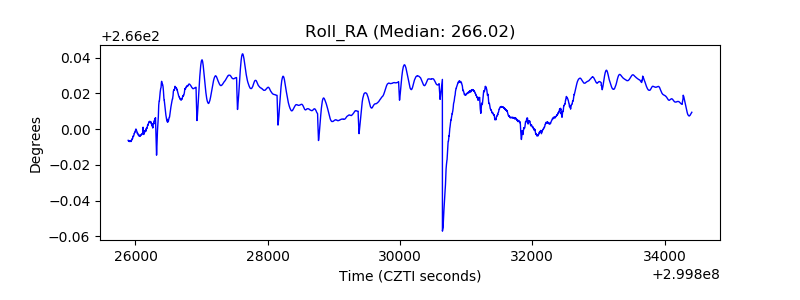 |
| Veto Counter | 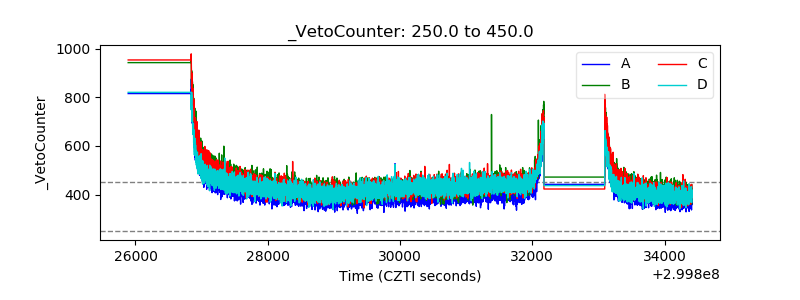 |