| Param | Original file | Final file |
|---|---|---|
| Filename | modeM0/AS1A05_163T01_9000003010_20341cztM0_level2.evt | modeM0/AS1A05_163T01_9000003010_20341cztM0_level2_quad_clean.evt |
| Size (bytes) | 590,578,560 | 101,580,480 |
| Size | 563.2 MB | 96.9 MB |
| Events in quadrant A | 4,243,915 | 622,472 |
| Events in quadrant B | 4,375,720 | 626,407 |
| Events in quadrant C | 4,309,033 | 613,194 |
| Events in quadrant D | 4,365,226 | 609,307 |
| Mode SS | |||
|---|---|---|---|
| Quadrant | BADHDUFLAG | Total packets | Discarded packets |
| A | 0 | 178 | 0 |
| B | 0 | 178 | 0 |
| C | 0 | 178 | 0 |
| D | 0 | 178 | 0 |
| Mode M0 | |||
|---|---|---|---|
| Quadrant | BADHDUFLAG | Total packets | Discarded packets |
| A | 0 | 18266 | 2 |
| B | 0 | 18381 | 2 |
| C | 0 | 18303 | 2 |
| D | 0 | 18848 | 2 |
| Mode M9 | |||
|---|---|---|---|
| Quadrant | BADHDUFLAG | Total packets | Discarded packets |
| A | 0 | 6 | 0 |
| B | 0 | 6 | 0 |
| C | 0 | 6 | 0 |
| D | 0 | 6 | 0 |
| Quadrant | Total seconds | Saturated seconds | Saturation percentage |
|---|---|---|---|
| A | 8712 | 360 | 4.132231% |
| B | 8713 | 388 | 4.453116% |
| C | 8713 | 374 | 4.292437% |
| D | 8713 | 289 | 3.316883% |
Noise dominated data is calculated using 1-second bins in cleaned event files. If a bin has >2000 counts, and if more than 50% of those come from <1% of pixels, then it is considered to be noise-dominated and hence unusable.
| Quadrant | # 1 sec bins | Bins with >0 counts | Bins with >2000 counts | High rate bins dominated by noise | Noise dominated (total time) | Noise dominated (detector-on time) | Marked lightcurve |
|---|---|---|---|---|---|---|---|
| A | 9297 | 8713 | 0 | 0 | 0.00% | 0.00% | 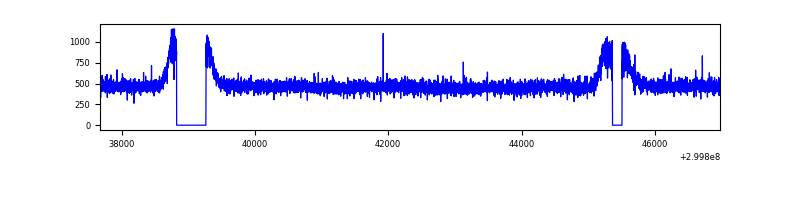 |
| B | 9298 | 8714 | 0 | 0 | 0.00% | 0.00% | 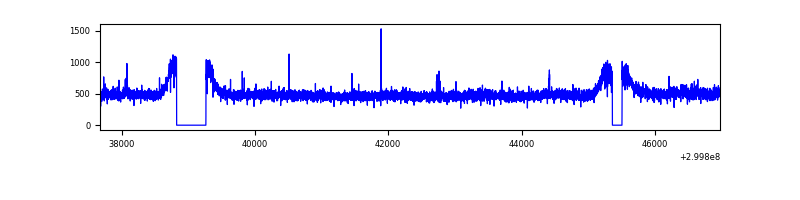 |
| C | 9298 | 8713 | 0 | 0 | 0.00% | 0.00% | 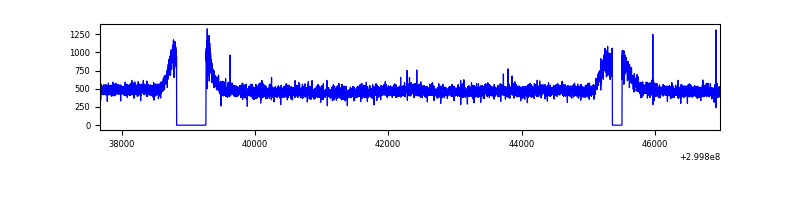 |
| D | 9298 | 8715 | 21 | 21 | 0.23% | 0.24% | 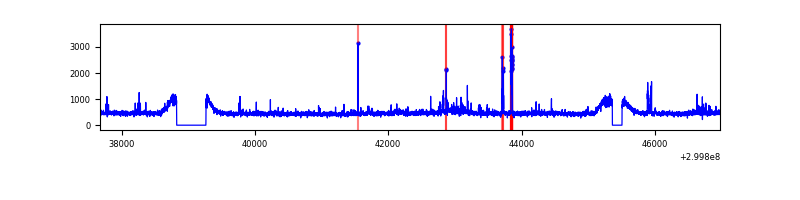 |
Top three noisy pixels from each quadrant. If the there are fewer than three noisy pixels in the level2.evt file, extra rows are filled as -1
| Pixel properties | Quadrant properties | ||||||
|---|---|---|---|---|---|---|---|
| Quadrant | DetID | PixID | Counts | Sigma | Mean | Median | Sigma |
| A | 13 | 254 | 10648 | 43.06 | 1101 | 1075 | 222.3 |
| A | 3 | 137 | 9723 | 38.9 | 1101 | 1075 | 222.3 |
| A | 0 | 226 | 9407 | 37.48 | 1101 | 1075 | 222.3 |
| B | 0 | 198 | 44513 | 201.55 | 1094 | 1064 | 215.6 |
| B | 12 | 111 | 27778 | 123.92 | 1094 | 1064 | 215.6 |
| B | 0 | 214 | 25658 | 114.09 | 1094 | 1064 | 215.6 |
| C | 14 | 238 | 161652 | 643.34 | 1058 | 1063 | 249.6 |
| C | 7 | 220 | 12983 | 47.75 | 1058 | 1063 | 249.6 |
| C | 13 | 61 | 7329 | 25.1 | 1058 | 1063 | 249.6 |
| D | 1 | 52 | 194964 | 726.81 | 1083 | 1046 | 266.8 |
| D | 2 | 16 | 50842 | 186.64 | 1083 | 1046 | 266.8 |
| D | 2 | 234 | 37316 | 135.94 | 1083 | 1046 | 266.8 |
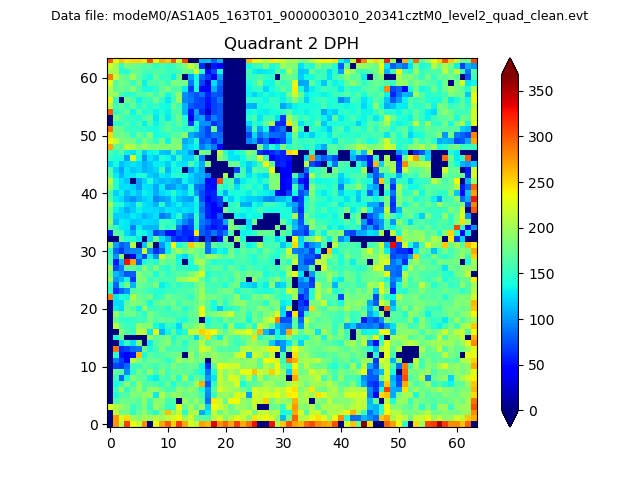
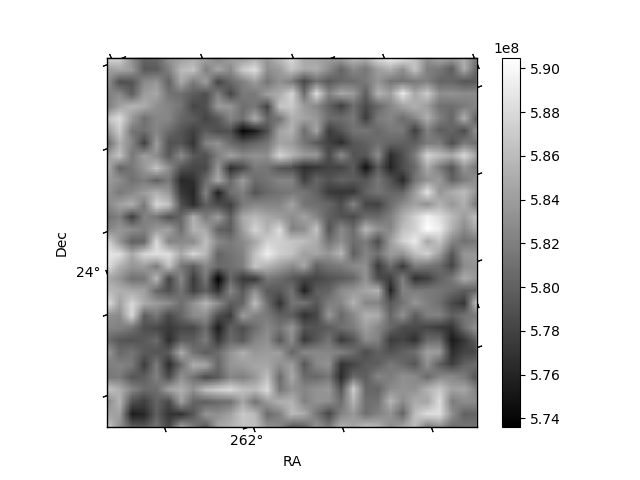
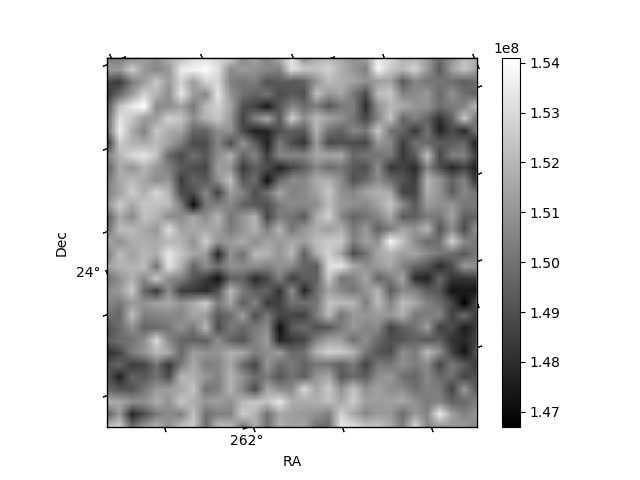
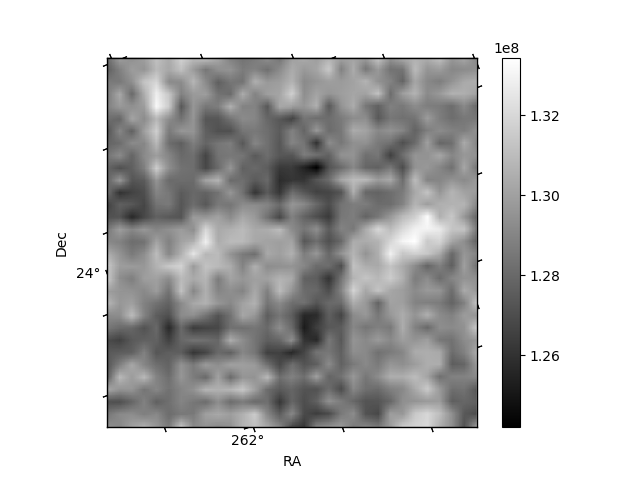
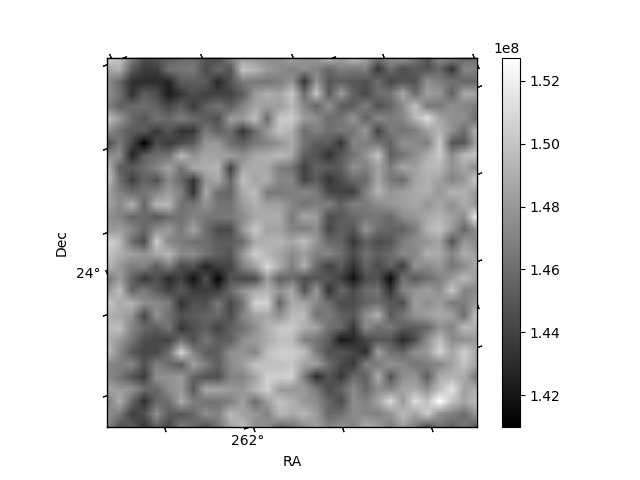
Histogram calculated using DETX and DETY for each event in the final _common_clean file
| Quadrant A | 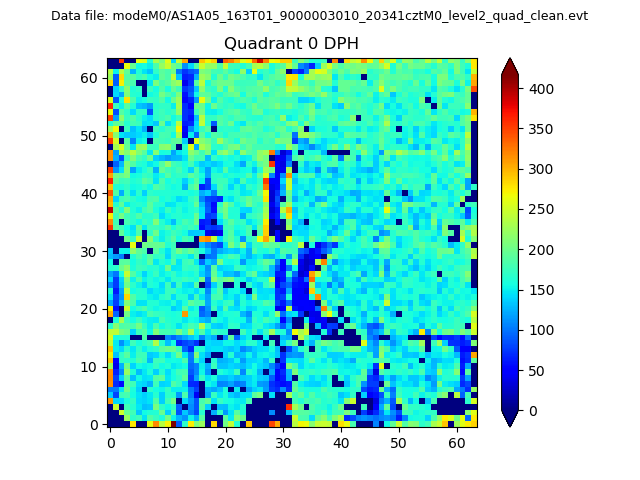 |
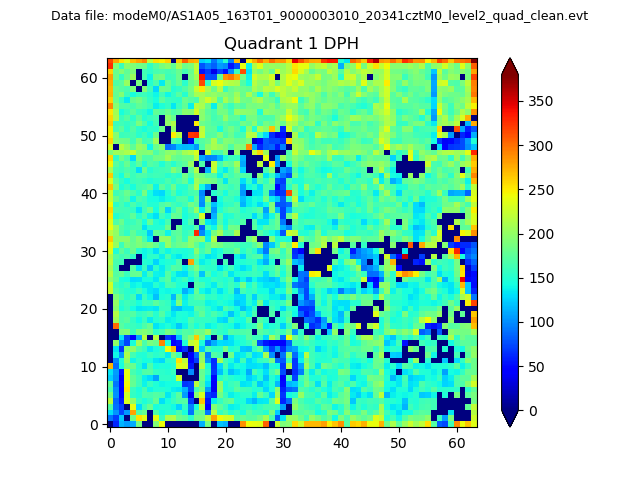 |
Quadrant B |
|---|---|---|---|
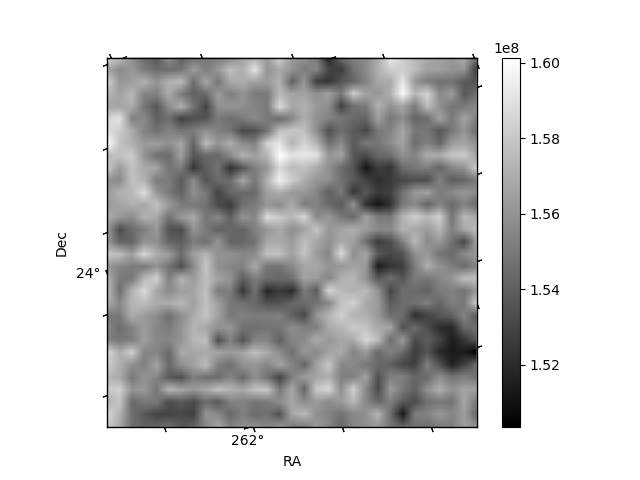
| Quadrant D | 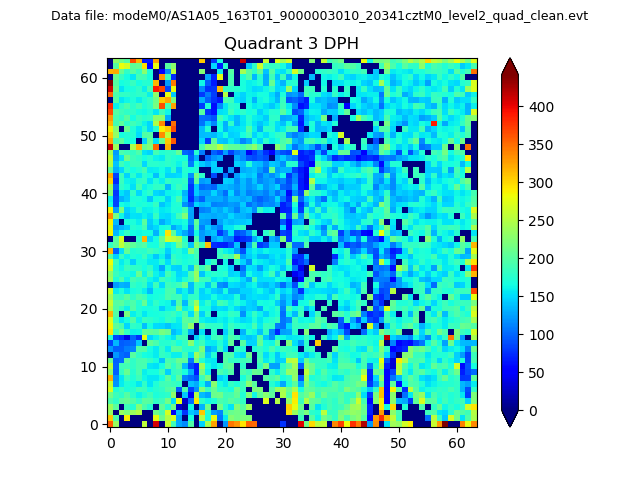 |
 |
Quadrant C |
| Plot type | Count rate plots | Images |
|---|---|---|
| Comparison with Poisson distribution Blue bars denote a histogram of data divided into 1 sec bins. Red curve is a Poisson curve with rate = median count rate of data. |
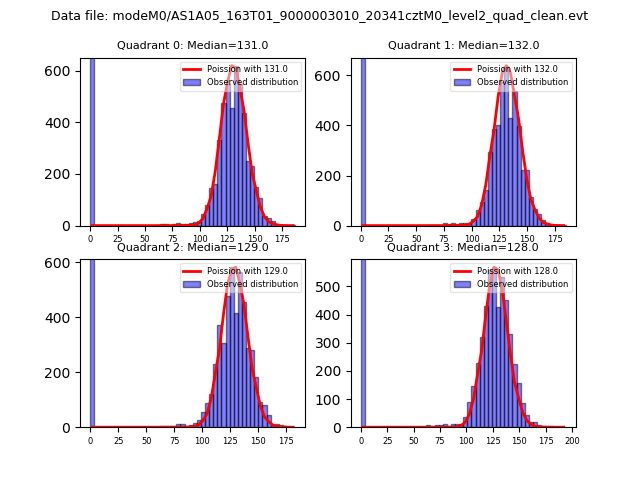 |
 |
| Quadrant-wise count rates Data is divided into 100 sec bins |
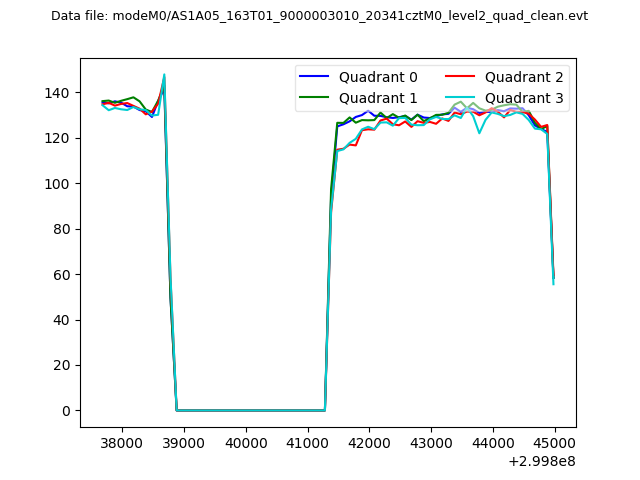 |
|
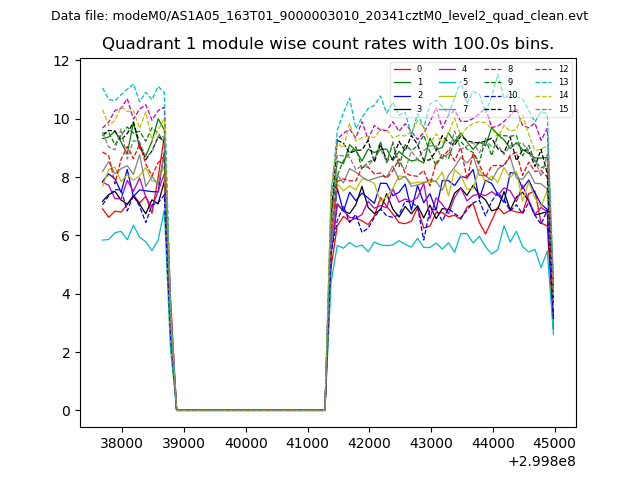
| Module-wise count rates for Quadrant A Data is divided into 100 sec bins |
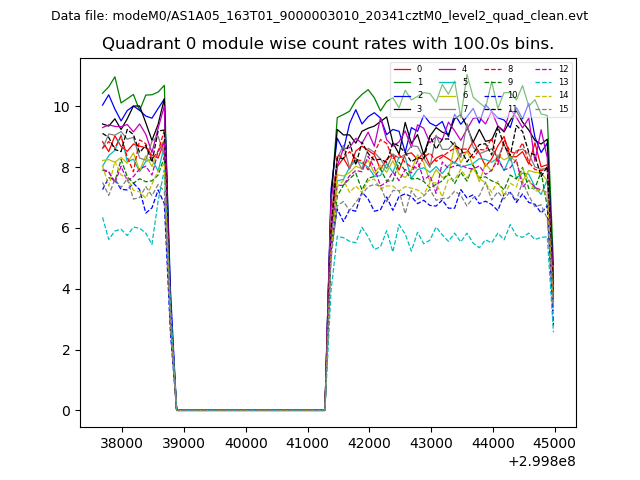 |
 |
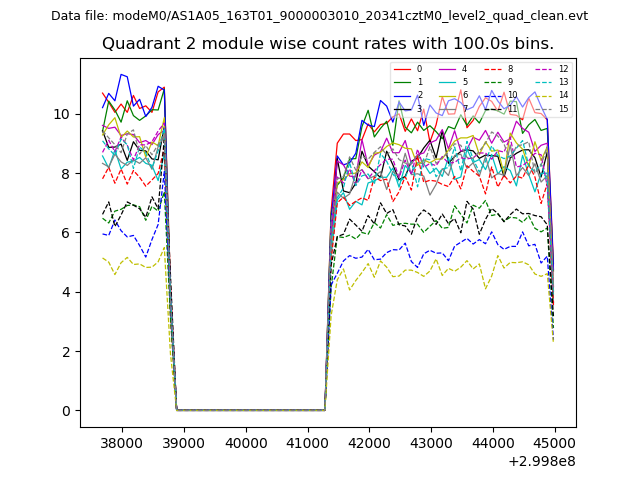
| Module-wise count rates for Quadrant B Data is divided into 100 sec bins |
 |
 |
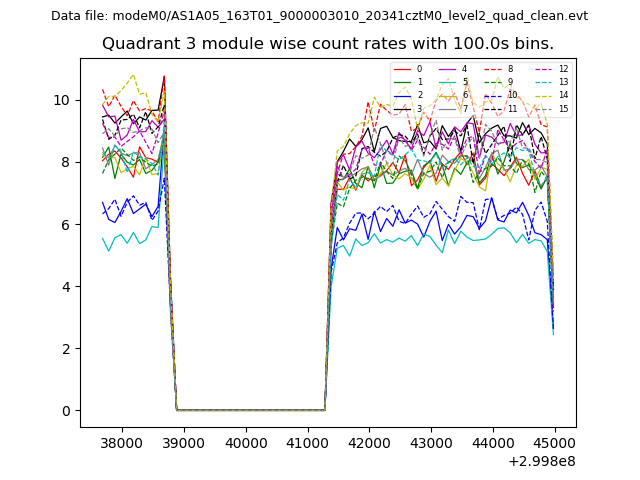
| Module-wise count rates for Quadrant C Data is divided into 100 sec bins |
 |
 |
| Module-wise count rates for Quadrant D Data is divided into 100 sec bins |
 |
 |
| Parameter | Plot |
|---|---|
| CZT HV Monitor | 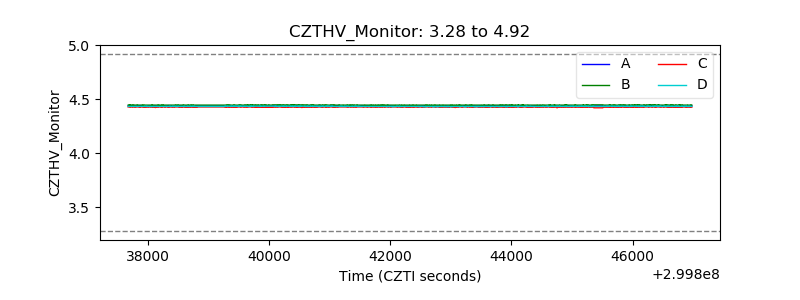 |
| D_VDD | 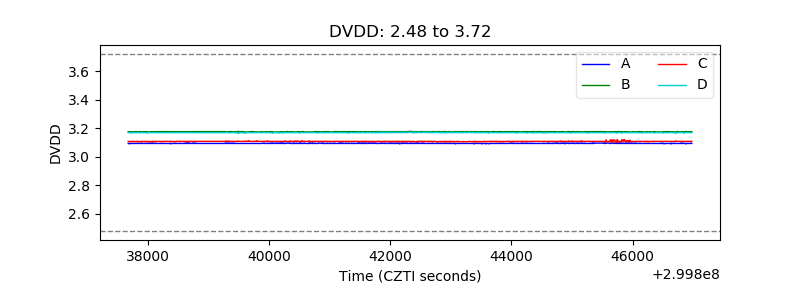 |
| Temperature 1 | 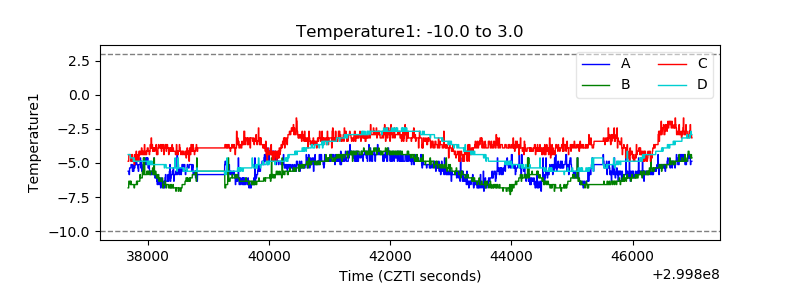 |
| Veto HV Monitor | 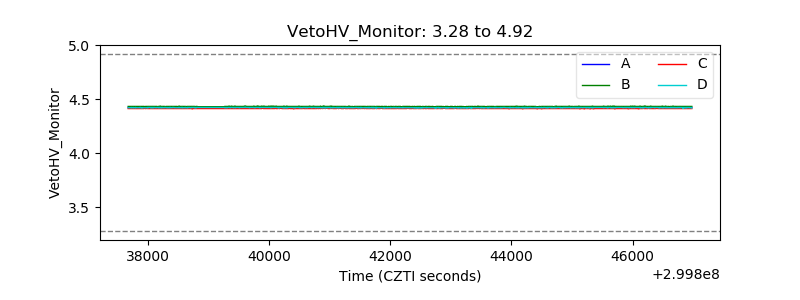 |
| Veto LLD | 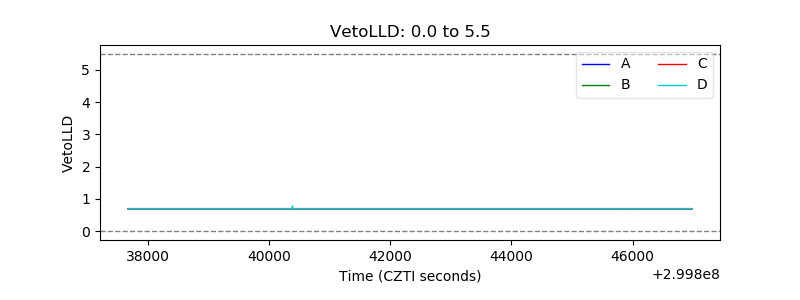 |
| Alpha Counter | 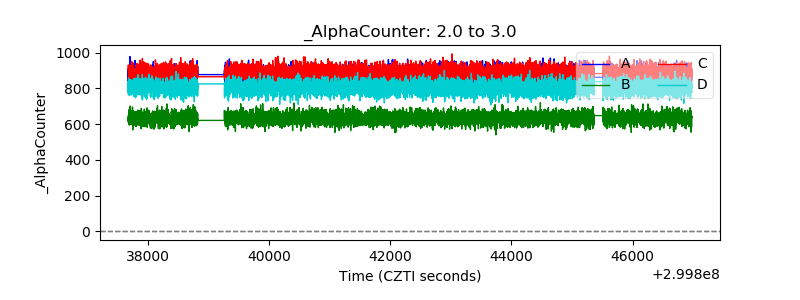 |
| _CPM_Rate | 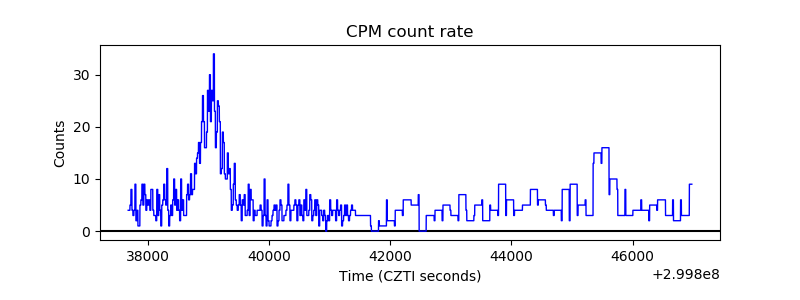 |
| CZT Counter | 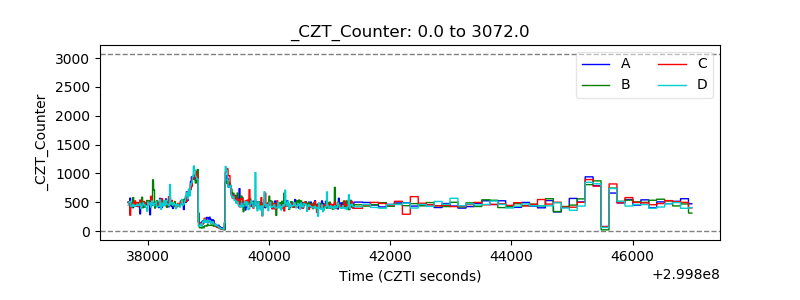 |
| +2.5 Volts monitor | 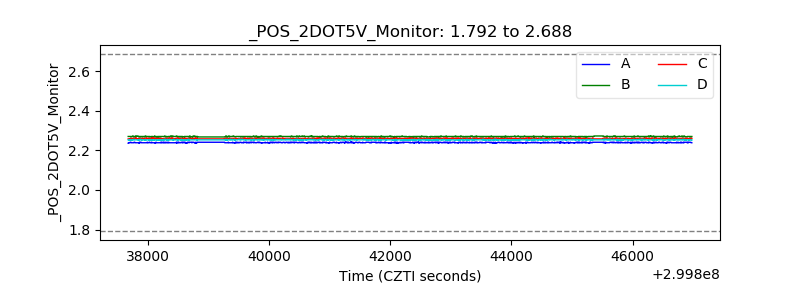 |
| +5 Volts monitor | 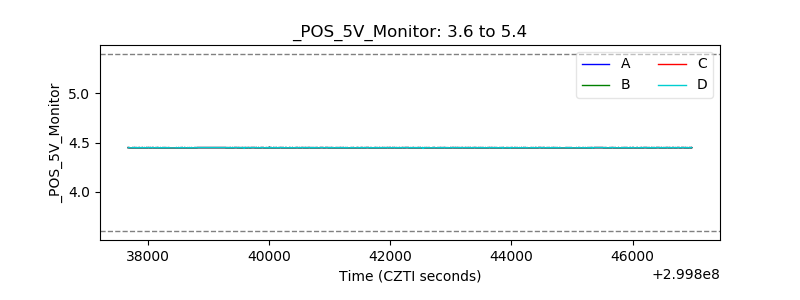 |
| _ROLL_ROT | 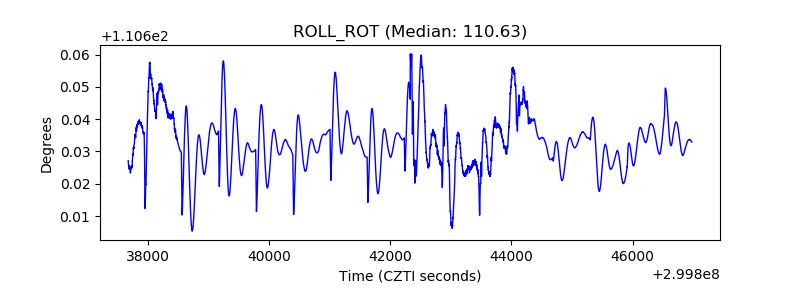 |
| _Roll_DEC | 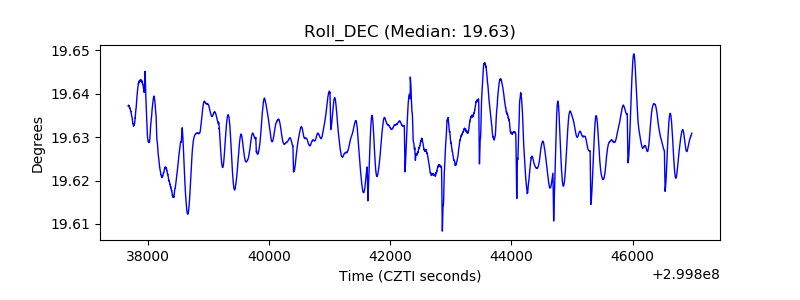 |
| _Roll_RA | 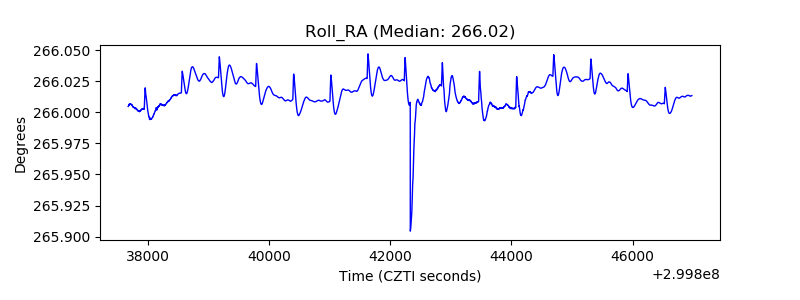 |
| Veto Counter | 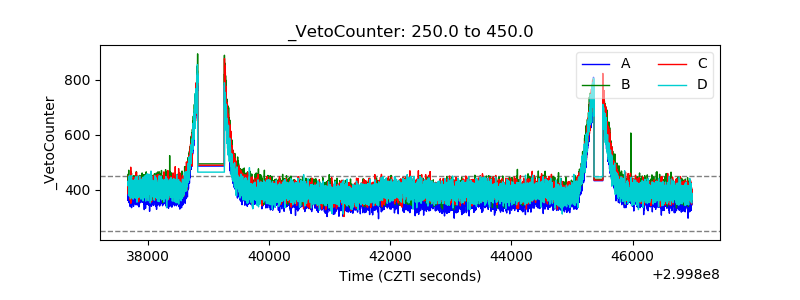 |