| Param | Original file | Final file |
|---|---|---|
| Filename | modeM0/AS1A05_163T01_9000003010_20346cztM0_level2.evt | modeM0/AS1A05_163T01_9000003010_20346cztM0_level2_quad_clean.evt |
| Size (bytes) | 448,168,320 | 99,092,160 |
| Size | 427.4 MB | 94.5 MB |
| Events in quadrant A | 3,167,602 | 637,650 |
| Events in quadrant B | 3,260,105 | 648,850 |
| Events in quadrant C | 3,236,178 | 632,225 |
| Events in quadrant D | 3,459,114 | 620,940 |
| Mode SS | |||
|---|---|---|---|
| Quadrant | BADHDUFLAG | Total packets | Discarded packets |
| A | 0 | 134 | 0 |
| B | 0 | 134 | 0 |
| C | 0 | 134 | 0 |
| D | 0 | 134 | 0 |
| Mode M0 | |||
|---|---|---|---|
| Quadrant | BADHDUFLAG | Total packets | Discarded packets |
| A | 0 | 13800 | 2 |
| B | 0 | 14033 | 2 |
| C | 0 | 13932 | 3 |
| D | 0 | 14818 | 2 |
| Mode M9 | |||
|---|---|---|---|
| Quadrant | BADHDUFLAG | Total packets | Discarded packets |
| A | 0 | 13 | 0 |
| B | 0 | 14 | 0 |
| C | 0 | 14 | 0 |
| D | 0 | 14 | 0 |
| Quadrant | Total seconds | Saturated seconds | Saturation percentage |
|---|---|---|---|
| A | 6619 | 41 | 0.619429% |
| B | 6619 | 65 | 0.982021% |
| C | 6618 | 110 | 1.662134% |
| D | 6618 | 74 | 1.118163% |
Noise dominated data is calculated using 1-second bins in cleaned event files. If a bin has >2000 counts, and if more than 50% of those come from <1% of pixels, then it is considered to be noise-dominated and hence unusable.
| Quadrant | # 1 sec bins | Bins with >0 counts | Bins with >2000 counts | High rate bins dominated by noise | Noise dominated (total time) | Noise dominated (detector-on time) | Marked lightcurve |
|---|---|---|---|---|---|---|---|
| A | 7614 | 6620 | 0 | 0 | 0.00% | 0.00% | 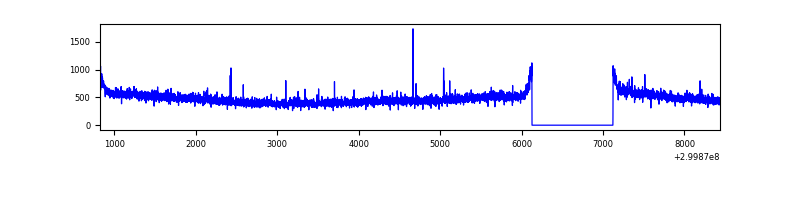 |
| B | 7614 | 6620 | 5 | 5 | 0.07% | 0.08% | 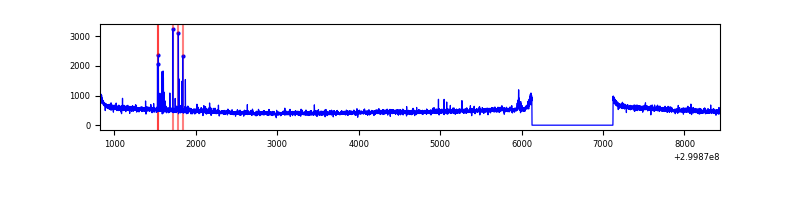 |
| C | 7613 | 6619 | 0 | 0 | 0.00% | 0.00% | 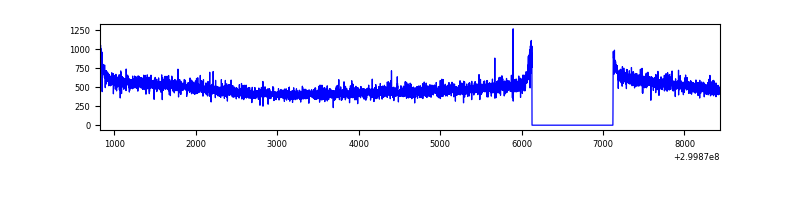 |
| D | 7613 | 6619 | 41 | 41 | 0.54% | 0.62% | 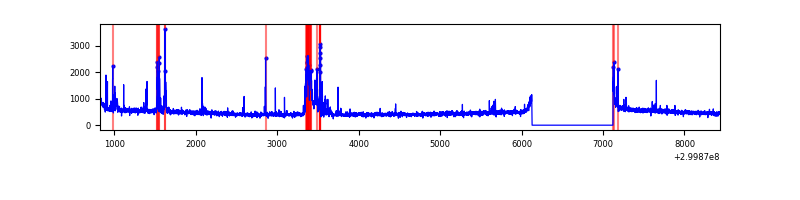 |
Top three noisy pixels from each quadrant. If the there are fewer than three noisy pixels in the level2.evt file, extra rows are filled as -1
| Pixel properties | Quadrant properties | ||||||
|---|---|---|---|---|---|---|---|
| Quadrant | DetID | PixID | Counts | Sigma | Mean | Median | Sigma |
| A | 6 | 16 | 9585 | 53.29 | 817 | 801 | 164.8 |
| A | 13 | 170 | 7592 | 41.2 | 817 | 801 | 164.8 |
| A | 13 | 254 | 7227 | 38.98 | 817 | 801 | 164.8 |
| B | 4 | 80 | 28202 | 176.31 | 813 | 793 | 155.5 |
| B | 0 | 214 | 24024 | 149.43 | 813 | 793 | 155.5 |
| B | 12 | 111 | 19344 | 119.33 | 813 | 793 | 155.5 |
| C | 14 | 238 | 122911 | 650.96 | 797 | 803 | 187.6 |
| C | 13 | 61 | 5375 | 24.37 | 797 | 803 | 187.6 |
| C | 5 | 255 | 2328 | 8.13 | 797 | 803 | 187.6 |
| D | 7 | 238 | 304383 | 1556.89 | 807 | 784 | 195.0 |
| D | 1 | 52 | 72989 | 370.28 | 807 | 784 | 195.0 |
| D | 2 | 234 | 29126 | 145.34 | 807 | 784 | 195.0 |
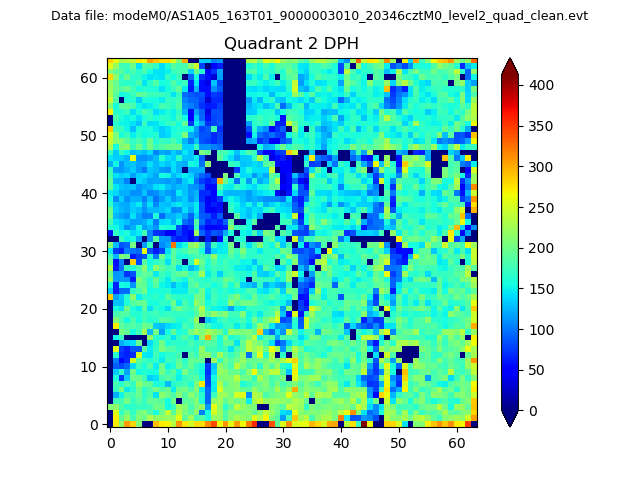
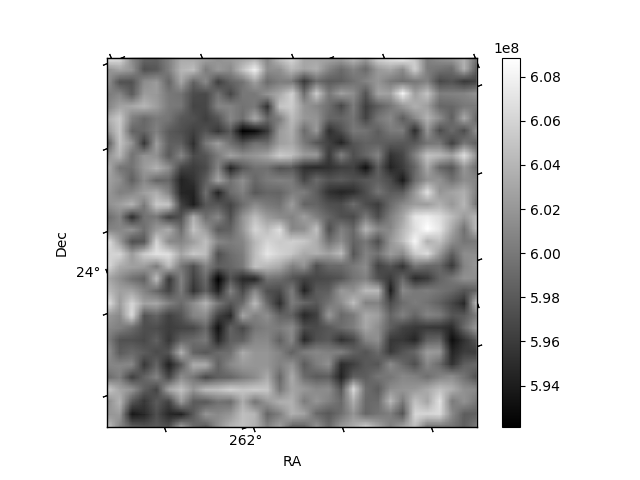
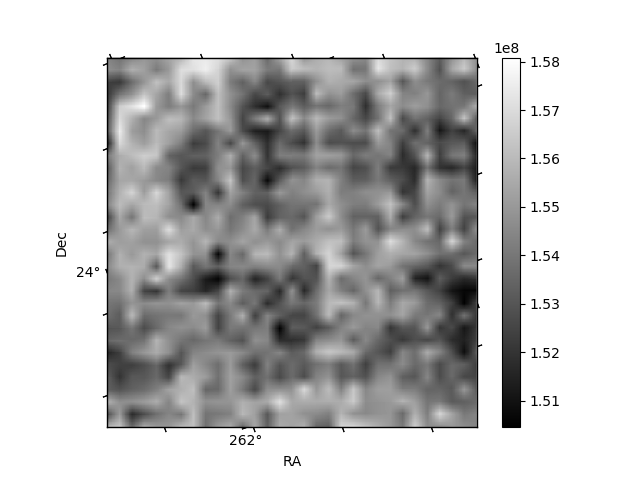
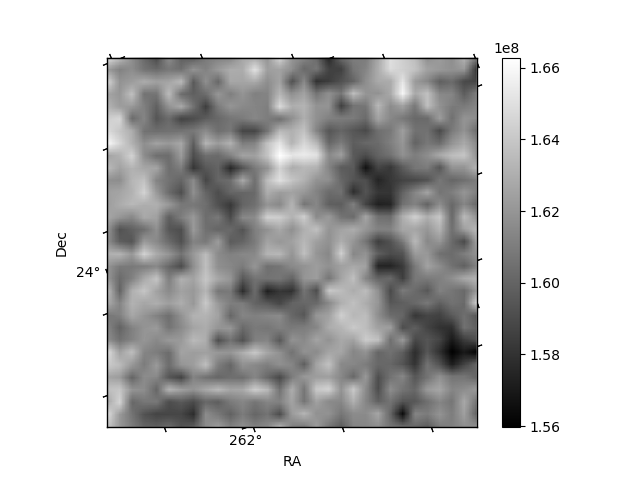
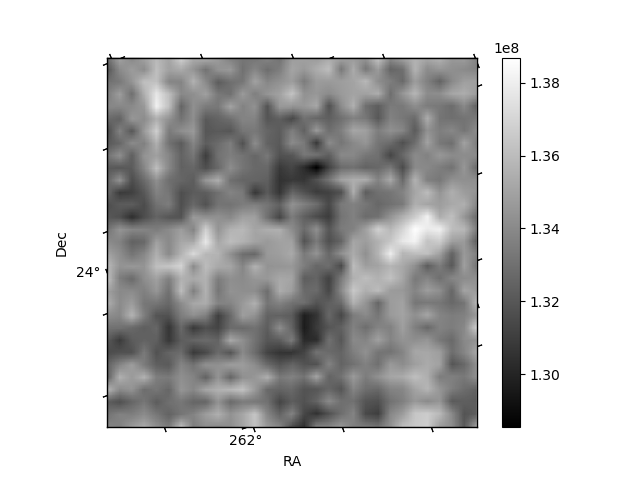
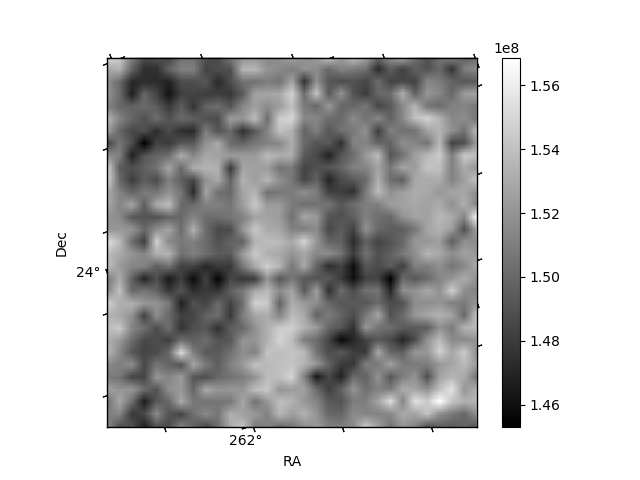
Histogram calculated using DETX and DETY for each event in the final _common_clean file
| Quadrant A | 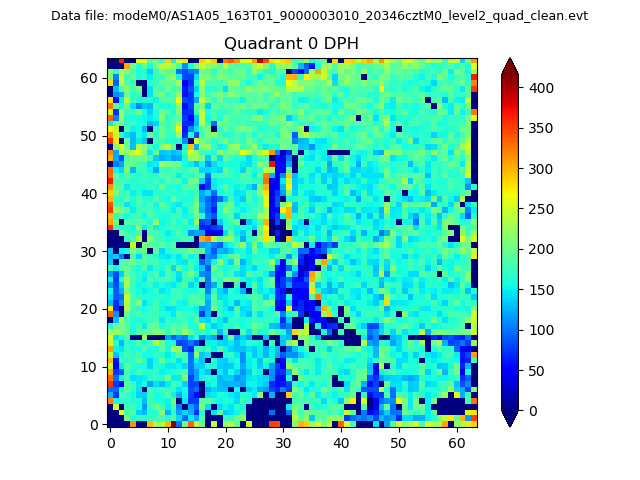 |
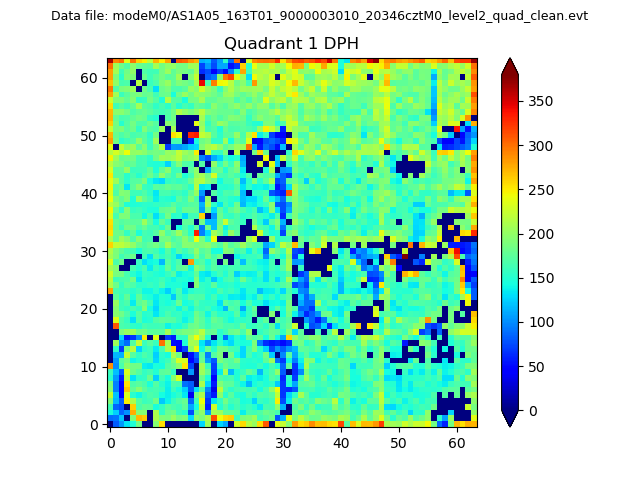 |
Quadrant B |
|---|---|---|---|
| Quadrant D | 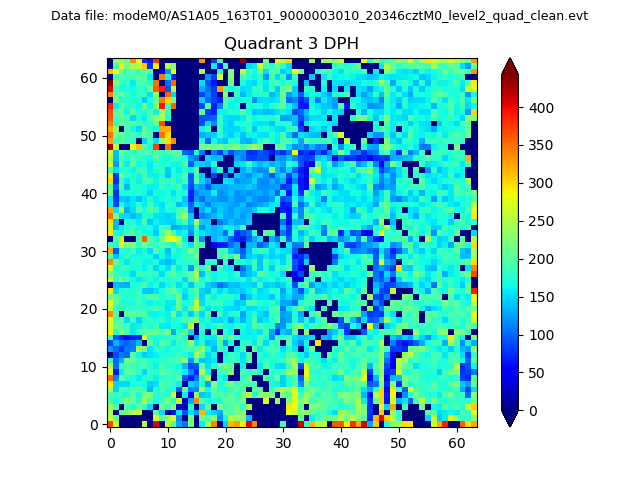 |
 |
Quadrant C |
| Plot type | Count rate plots | Images |
|---|---|---|
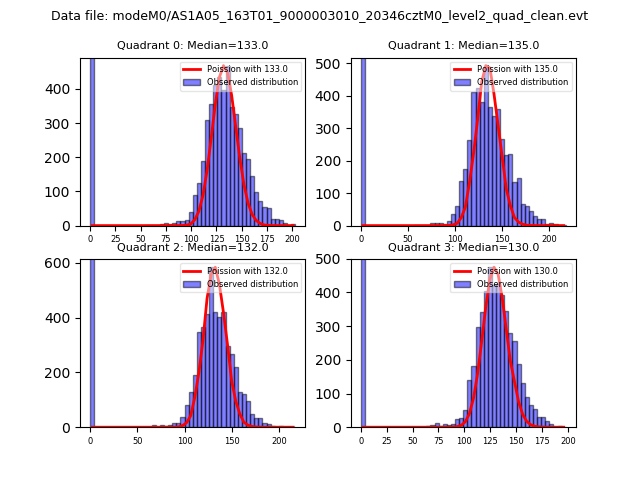
| Comparison with Poisson distribution Blue bars denote a histogram of data divided into 1 sec bins. Red curve is a Poisson curve with rate = median count rate of data. |
 |
 |
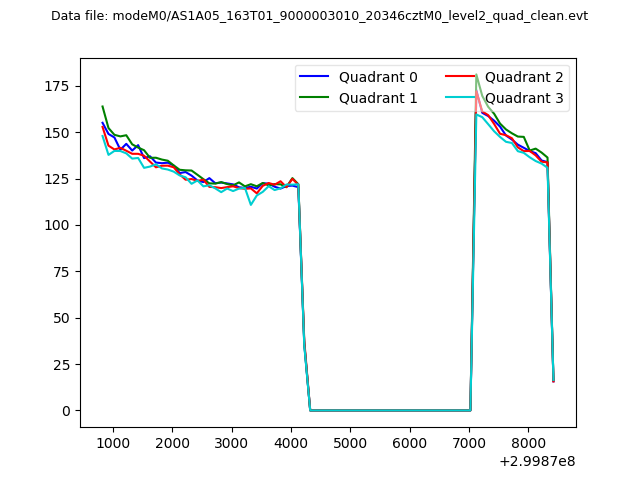
| Quadrant-wise count rates Data is divided into 100 sec bins |
 |
|
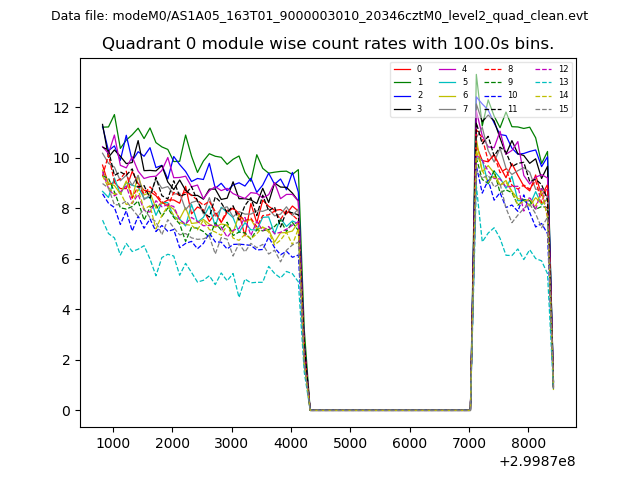
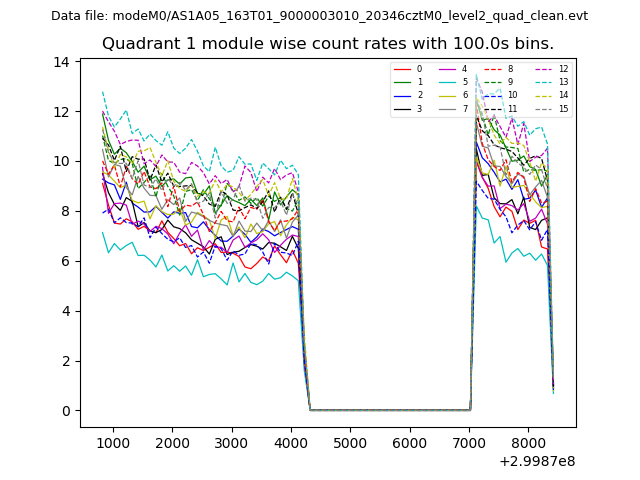
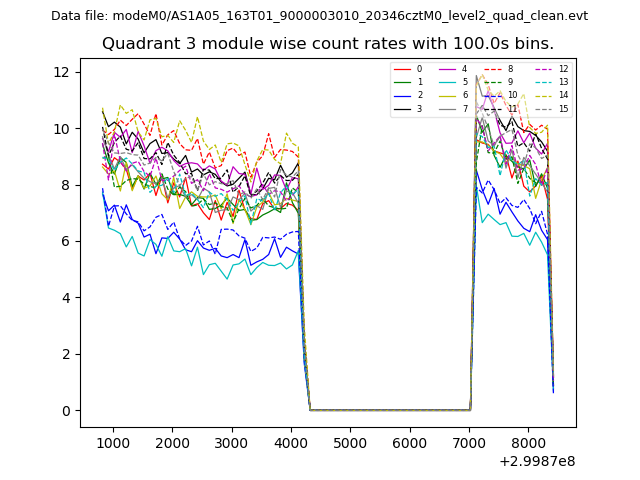
| Module-wise count rates for Quadrant A Data is divided into 100 sec bins |
 |
 |
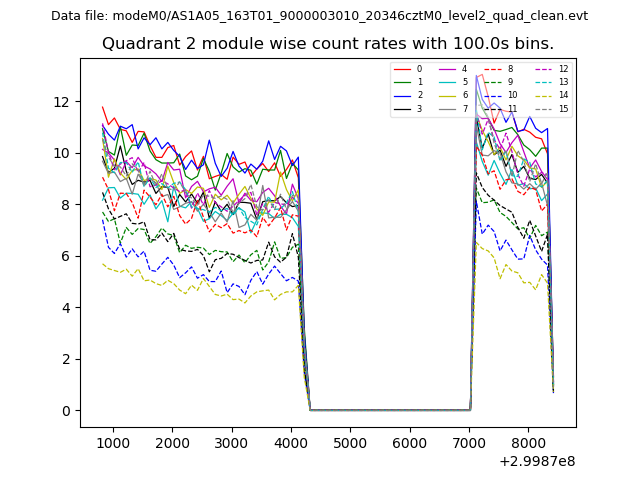
| Module-wise count rates for Quadrant B Data is divided into 100 sec bins |
 |
 |
| Module-wise count rates for Quadrant C Data is divided into 100 sec bins |
 |
 |
| Module-wise count rates for Quadrant D Data is divided into 100 sec bins |
 |
 |
| Parameter | Plot |
|---|---|
| CZT HV Monitor | 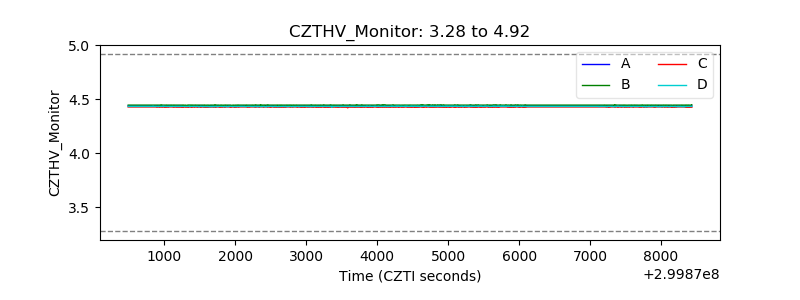 |
| D_VDD | 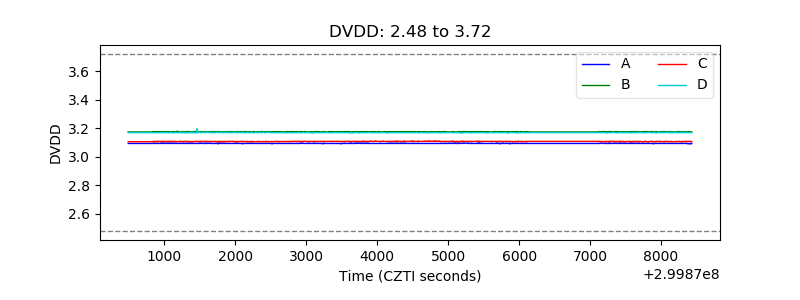 |
| Temperature 1 | 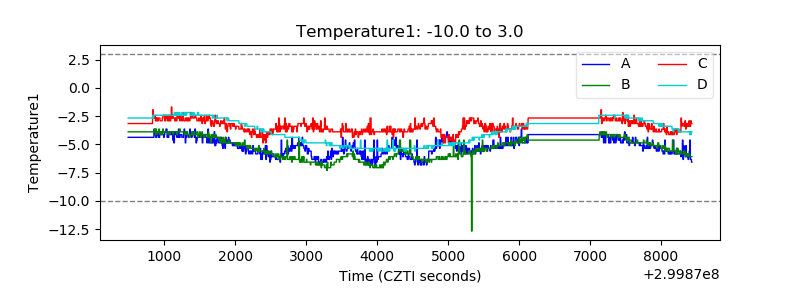 |
| Veto HV Monitor | 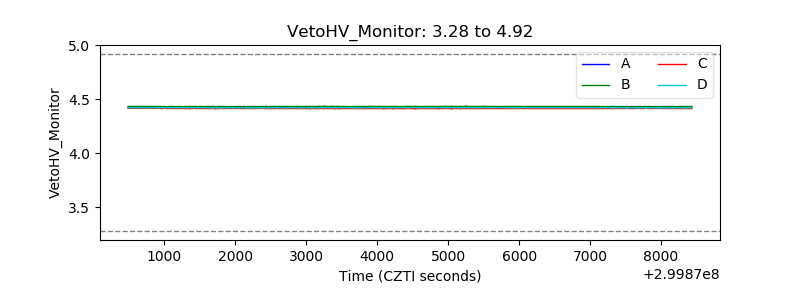 |
| Veto LLD | 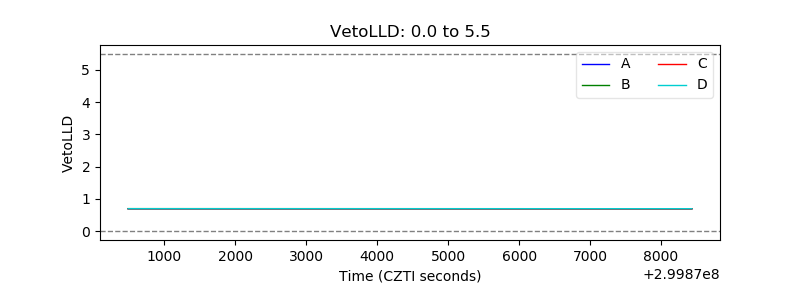 |
| Alpha Counter | 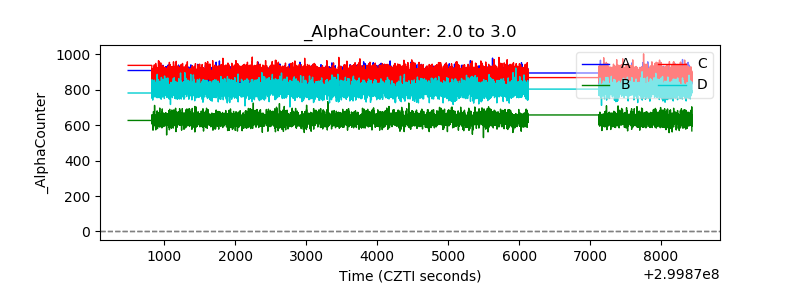 |
| _CPM_Rate | 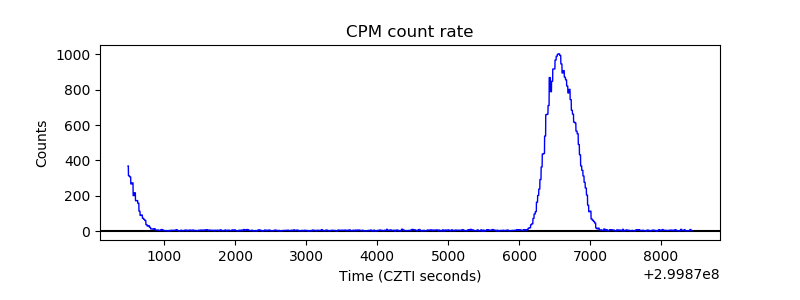 |
| CZT Counter | 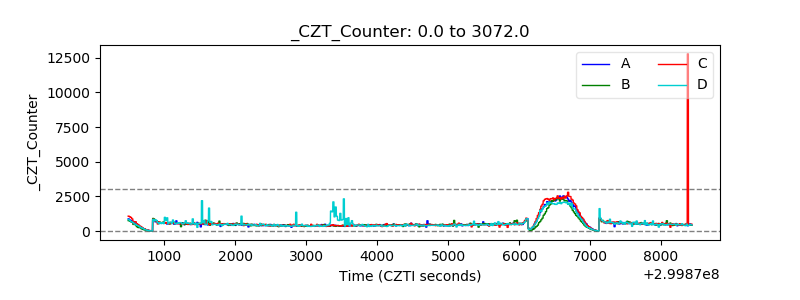 |
| +2.5 Volts monitor |  |
| +5 Volts monitor |  |
| _ROLL_ROT | 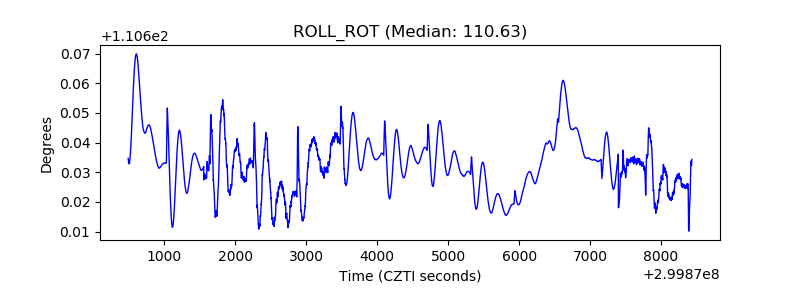 |
| _Roll_DEC | 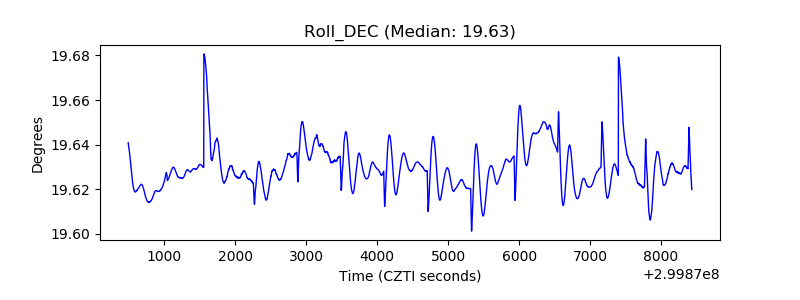 |
| _Roll_RA | 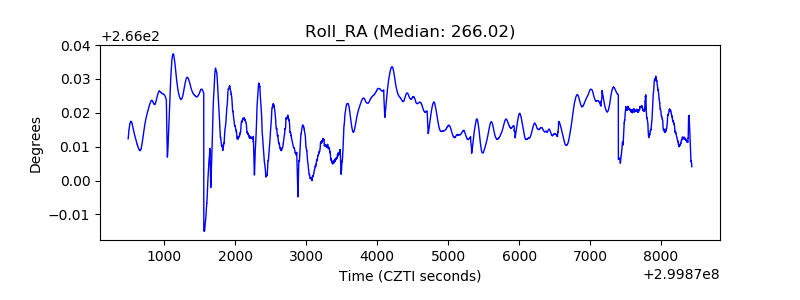 |
| Veto Counter | 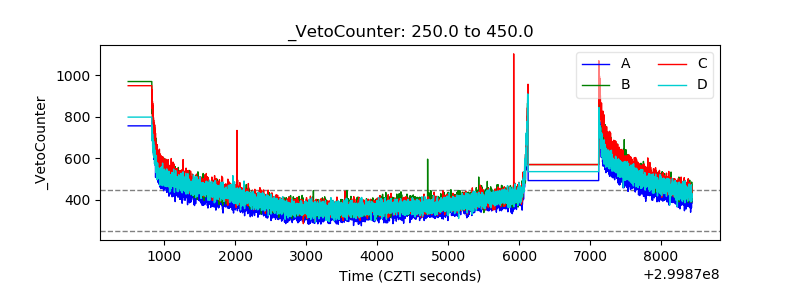 |