| Param | Original file | Final file |
|---|---|---|
| Filename | modeM0/AS1A05_163T01_9000003010_20348cztM0_level2.evt | modeM0/AS1A05_163T01_9000003010_20348cztM0_level2_quad_clean.evt |
| Size (bytes) | 443,154,240 | 95,431,680 |
| Size | 422.6 MB | 91.0 MB |
| Events in quadrant A | 3,122,607 | 610,550 |
| Events in quadrant B | 3,206,902 | 626,347 |
| Events in quadrant C | 3,231,560 | 607,932 |
| Events in quadrant D | 3,420,330 | 594,259 |
| Mode SS | |||
|---|---|---|---|
| Quadrant | BADHDUFLAG | Total packets | Discarded packets |
| A | 0 | 130 | 0 |
| B | 0 | 130 | 0 |
| C | 0 | 130 | 0 |
| D | 0 | 130 | 0 |
| Mode M0 | |||
|---|---|---|---|
| Quadrant | BADHDUFLAG | Total packets | Discarded packets |
| A | 0 | 13571 | 2 |
| B | 0 | 13704 | 2 |
| C | 0 | 13892 | 2 |
| D | 0 | 14667 | 2 |
| Mode M9 | |||
|---|---|---|---|
| Quadrant | BADHDUFLAG | Total packets | Discarded packets |
| A | 0 | 18 | 0 |
| B | 0 | 19 | 0 |
| C | 0 | 19 | 0 |
| D | 0 | 19 | 0 |
| Quadrant | Total seconds | Saturated seconds | Saturation percentage |
|---|---|---|---|
| A | 6472 | 34 | 0.525340% |
| B | 6471 | 47 | 0.726317% |
| C | 6471 | 75 | 1.159017% |
| D | 6471 | 75 | 1.159017% |
Noise dominated data is calculated using 1-second bins in cleaned event files. If a bin has >2000 counts, and if more than 50% of those come from <1% of pixels, then it is considered to be noise-dominated and hence unusable.
| Quadrant | # 1 sec bins | Bins with >0 counts | Bins with >2000 counts | High rate bins dominated by noise | Noise dominated (total time) | Noise dominated (detector-on time) | Marked lightcurve |
|---|---|---|---|---|---|---|---|
| A | 7622 | 6473 | 0 | 0 | 0.00% | 0.00% | 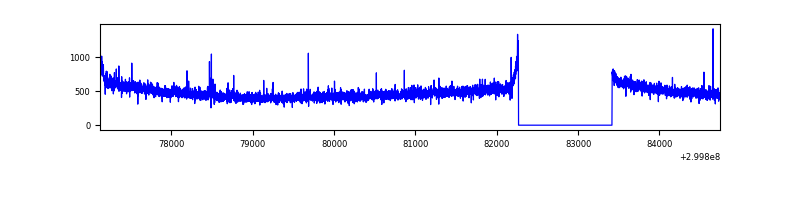 |
| B | 7621 | 6472 | 0 | 0 | 0.00% | 0.00% | 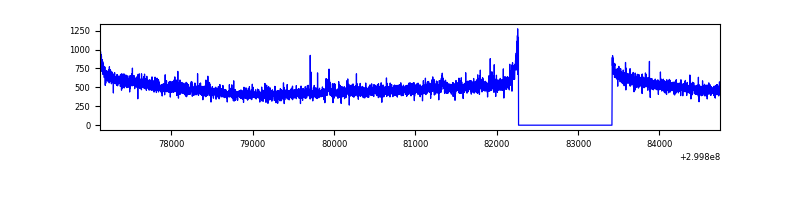 |
| C | 7621 | 6472 | 1 | 1 | 0.01% | 0.02% | 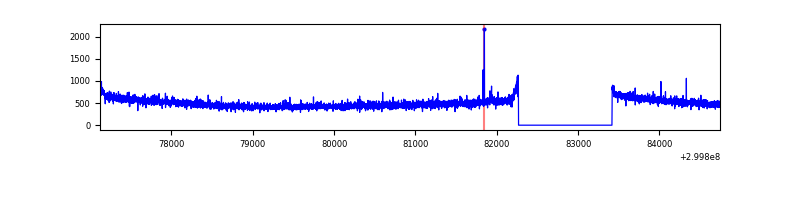 |
| D | 7621 | 6472 | 64 | 64 | 0.84% | 0.99% | 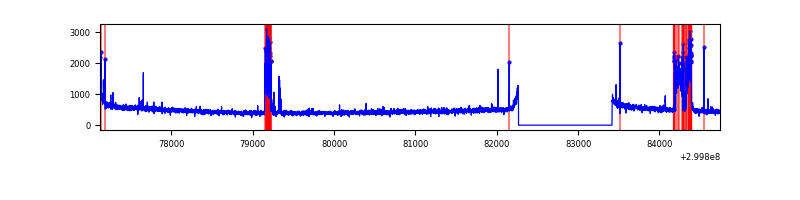 |
Top three noisy pixels from each quadrant. If the there are fewer than three noisy pixels in the level2.evt file, extra rows are filled as -1
| Pixel properties | Quadrant properties | ||||||
|---|---|---|---|---|---|---|---|
| Quadrant | DetID | PixID | Counts | Sigma | Mean | Median | Sigma |
| A | 6 | 16 | 14155 | 82.7 | 806 | 788 | 161.6 |
| A | 13 | 254 | 7602 | 42.16 | 806 | 788 | 161.6 |
| A | 0 | 226 | 6661 | 36.33 | 806 | 788 | 161.6 |
| B | 0 | 198 | 32789 | 209.07 | 805 | 784 | 153.1 |
| B | 12 | 111 | 18721 | 117.17 | 805 | 784 | 153.1 |
| B | 11 | 111 | 16990 | 105.86 | 805 | 784 | 153.1 |
| C | 14 | 238 | 123991 | 665.56 | 788 | 796 | 185.1 |
| C | 3 | 9 | 21958 | 114.33 | 788 | 796 | 185.1 |
| C | 8 | 128 | 5439 | 25.08 | 788 | 796 | 185.1 |
| D | 7 | 238 | 382335 | 1967.21 | 794 | 770 | 194.0 |
| D | 2 | 234 | 26657 | 133.46 | 794 | 770 | 194.0 |
| D | 13 | 138 | 10429 | 49.8 | 794 | 770 | 194.0 |
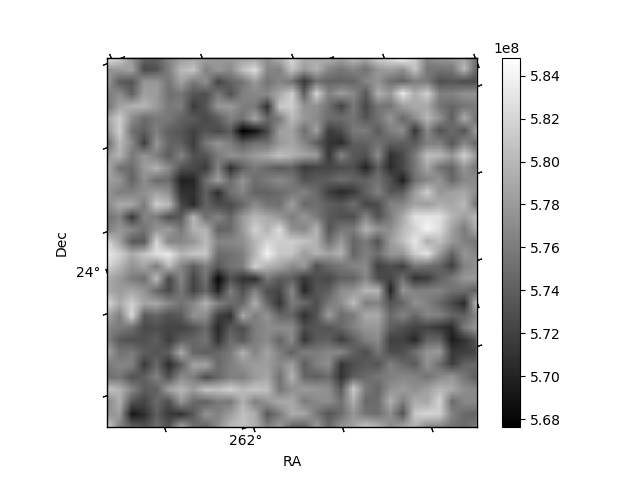
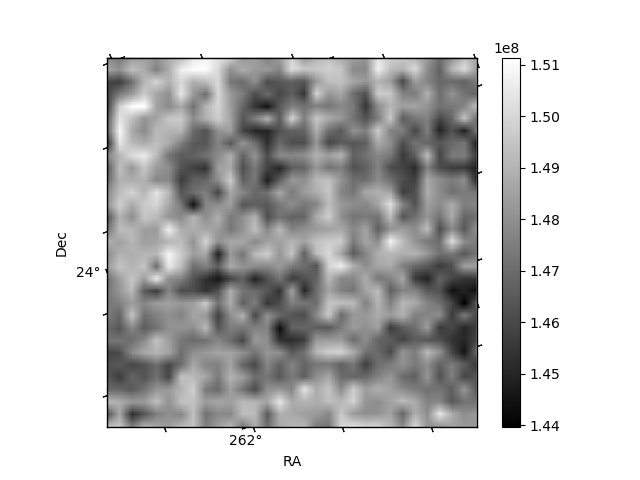
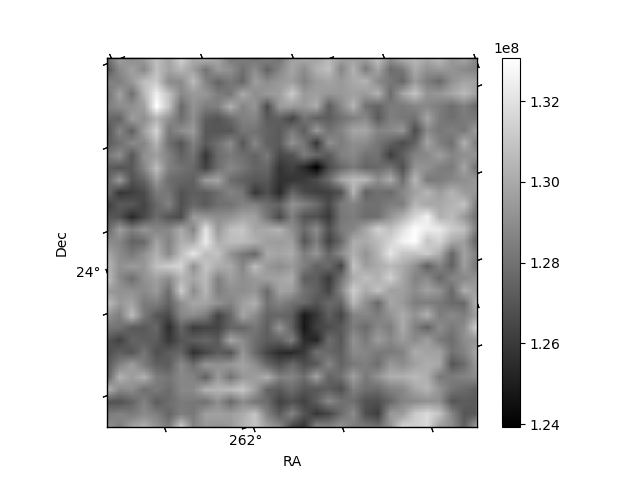
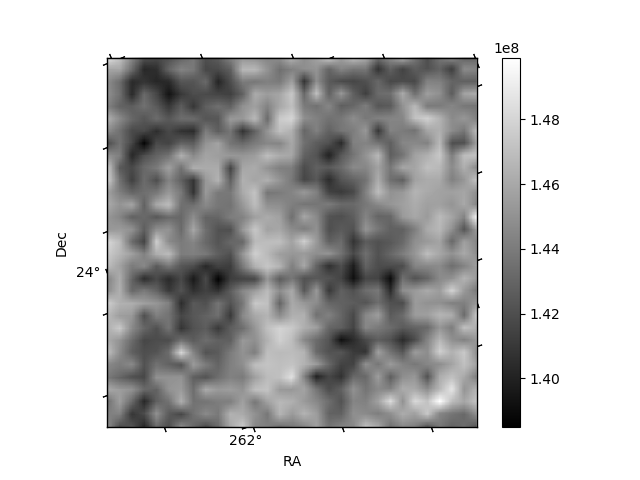
Histogram calculated using DETX and DETY for each event in the final _common_clean file
| Quadrant A | 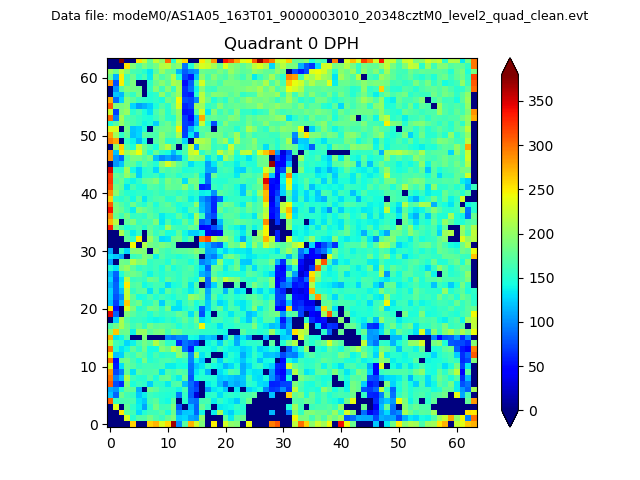 |
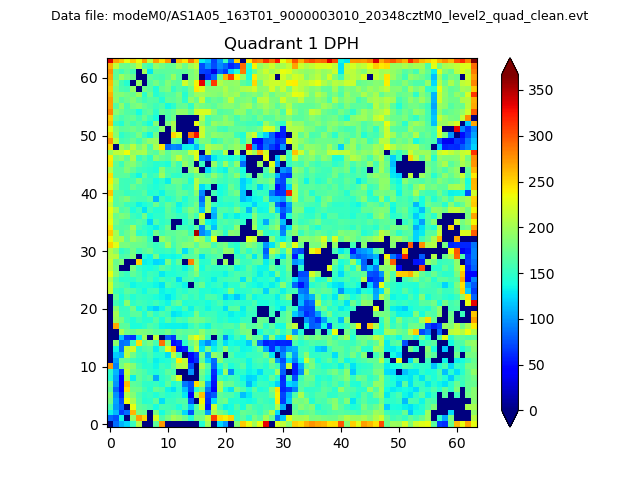 |
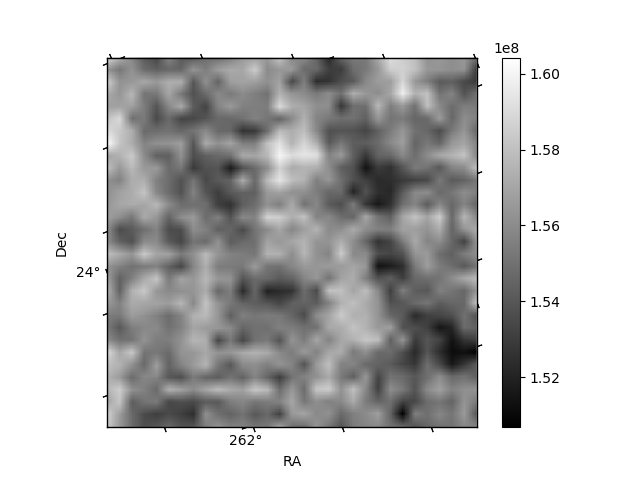
Quadrant B |
|---|---|---|---|
| Quadrant D | 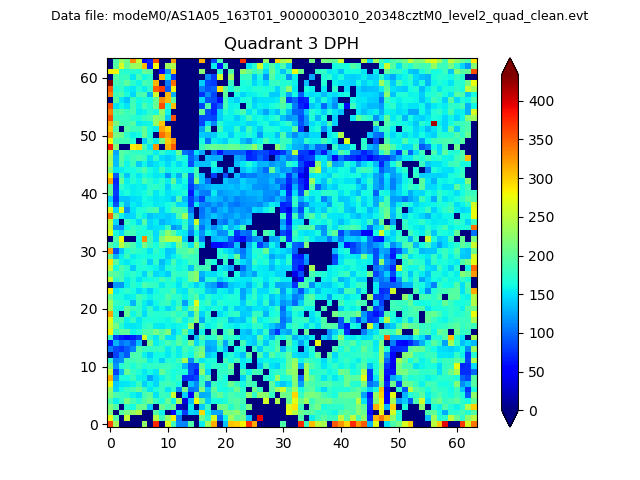 |
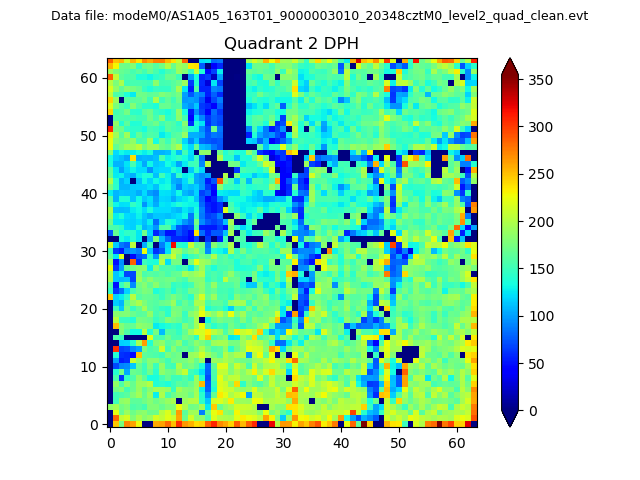 |
Quadrant C |
| Plot type | Count rate plots | Images |
|---|---|---|
| Comparison with Poisson distribution Blue bars denote a histogram of data divided into 1 sec bins. Red curve is a Poisson curve with rate = median count rate of data. |
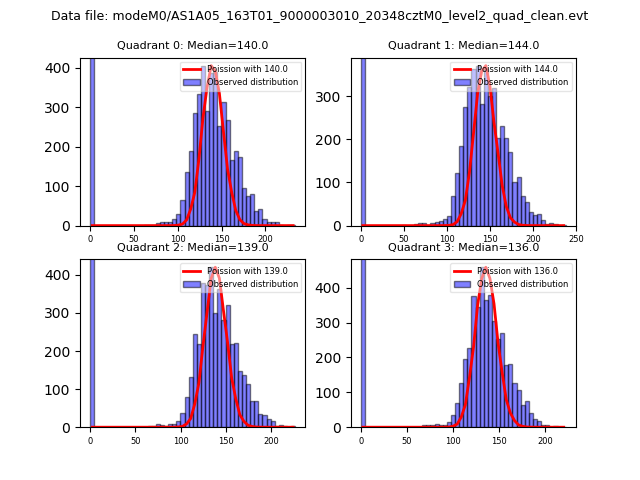 |
 |
| Quadrant-wise count rates Data is divided into 100 sec bins |
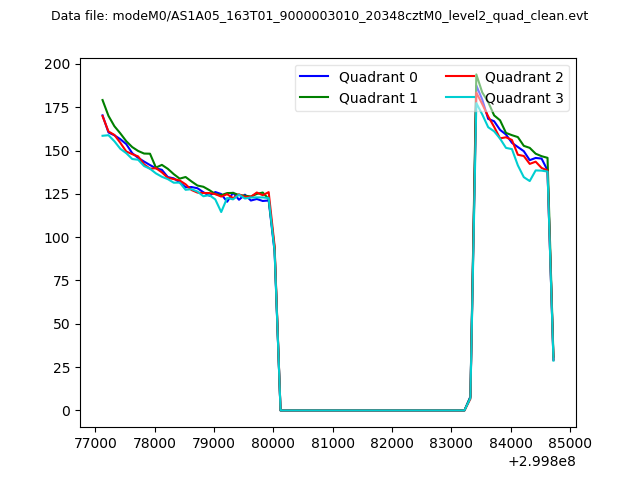 |
|
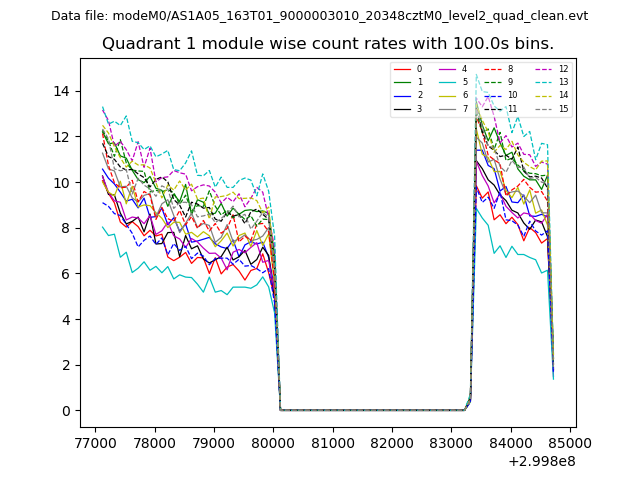
| Module-wise count rates for Quadrant A Data is divided into 100 sec bins |
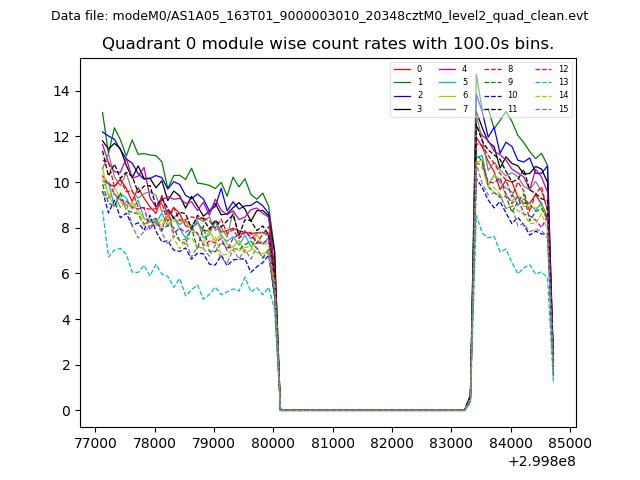 |
 |
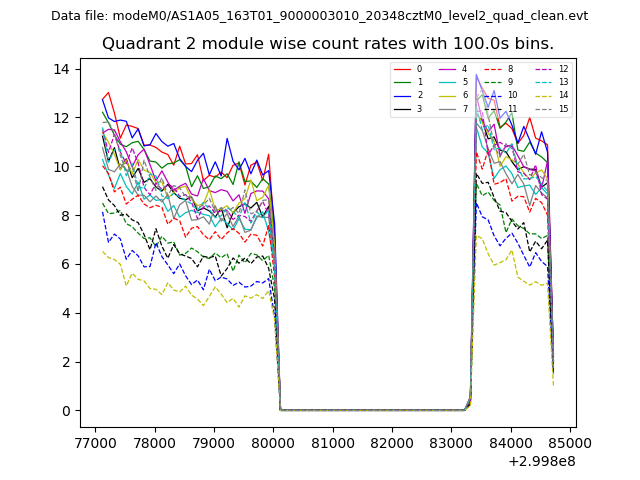
| Module-wise count rates for Quadrant B Data is divided into 100 sec bins |
 |
 |
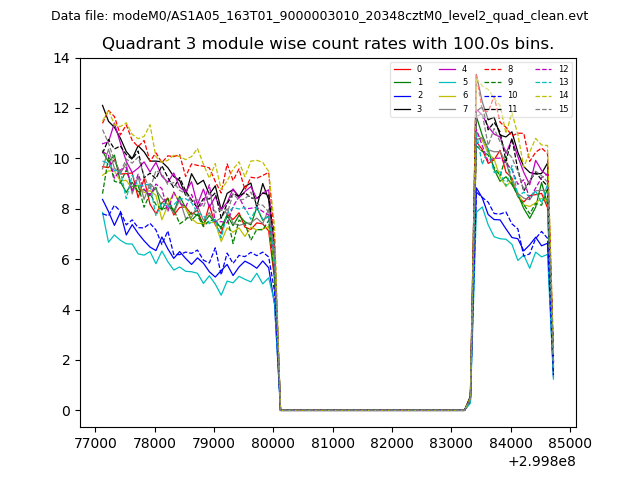
| Module-wise count rates for Quadrant C Data is divided into 100 sec bins |
 |
 |
| Module-wise count rates for Quadrant D Data is divided into 100 sec bins |
 |
 |
| Parameter | Plot |
|---|---|
| CZT HV Monitor | 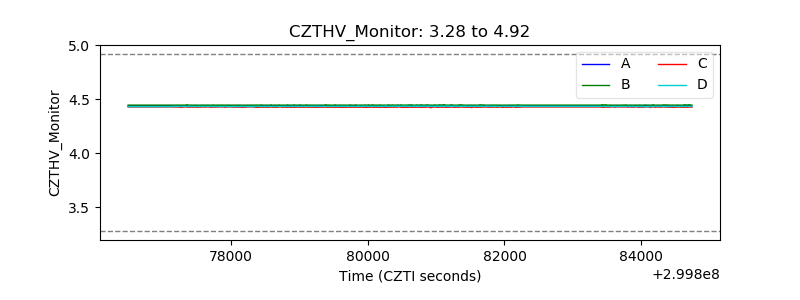 |
| D_VDD | 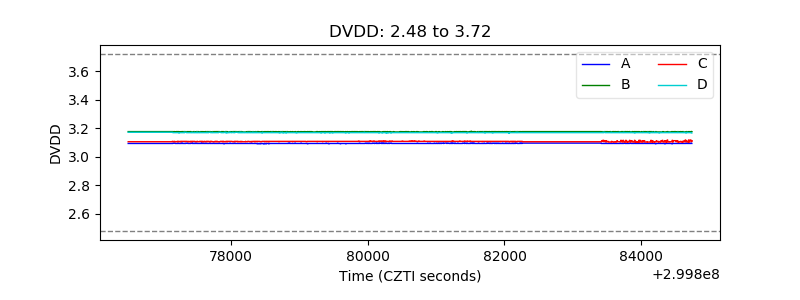 |
| Temperature 1 | 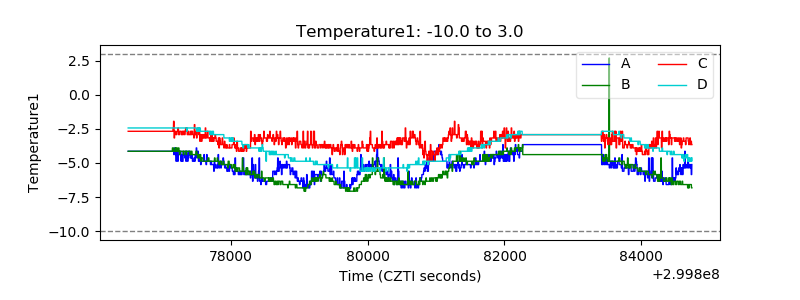 |
| Veto HV Monitor | 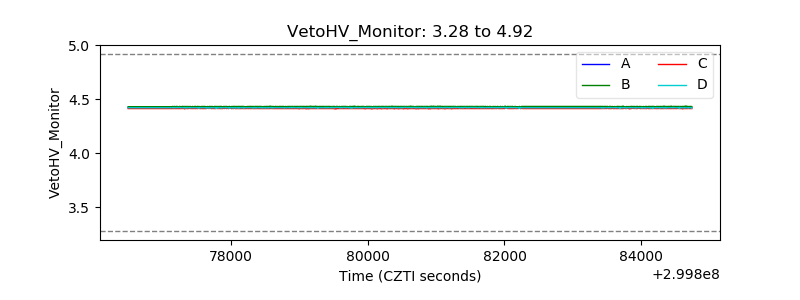 |
| Veto LLD | 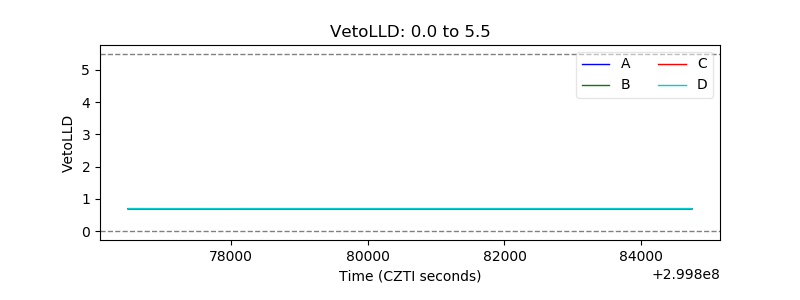 |
| Alpha Counter | 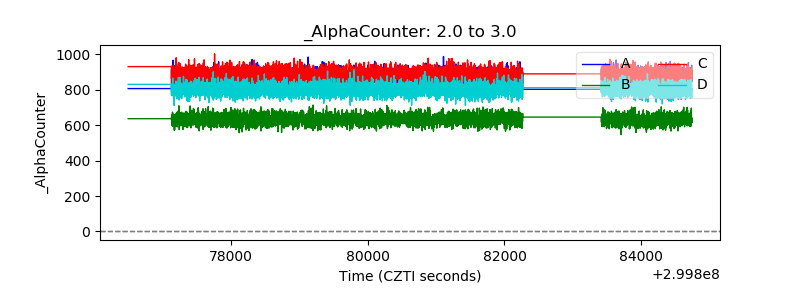 |
| _CPM_Rate | 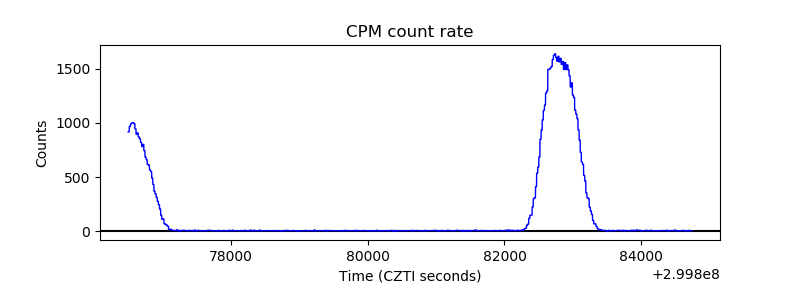 |
| CZT Counter | 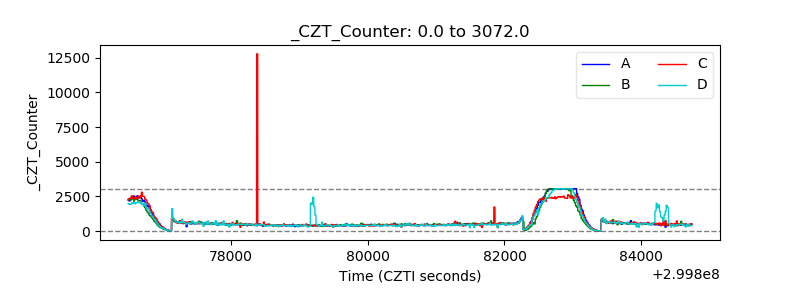 |
| +2.5 Volts monitor | 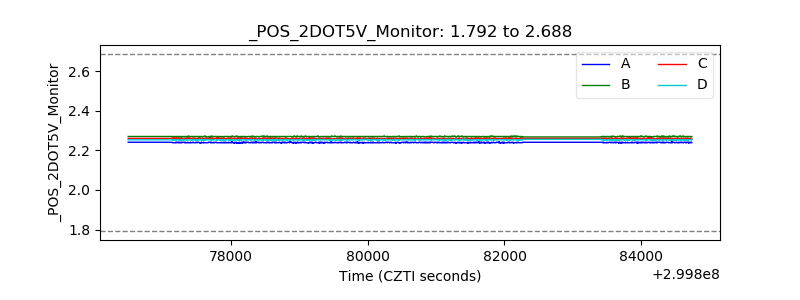 |
| +5 Volts monitor | 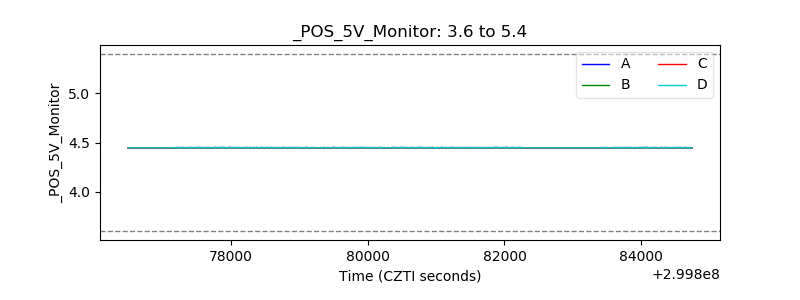 |
| _ROLL_ROT | 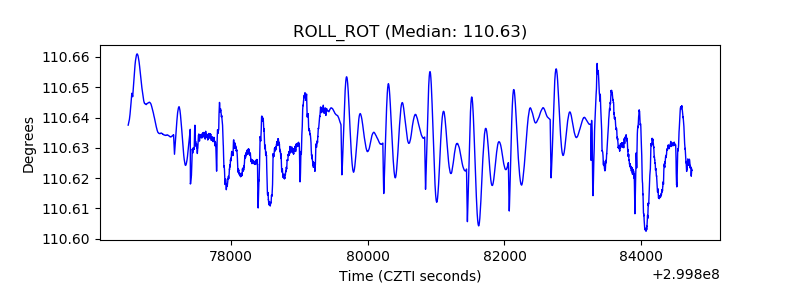 |
| _Roll_DEC | 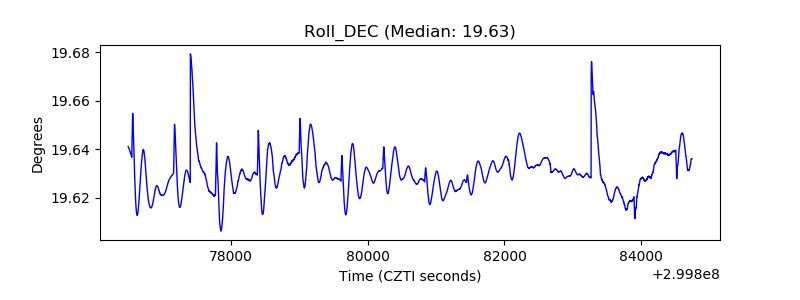 |
| _Roll_RA | 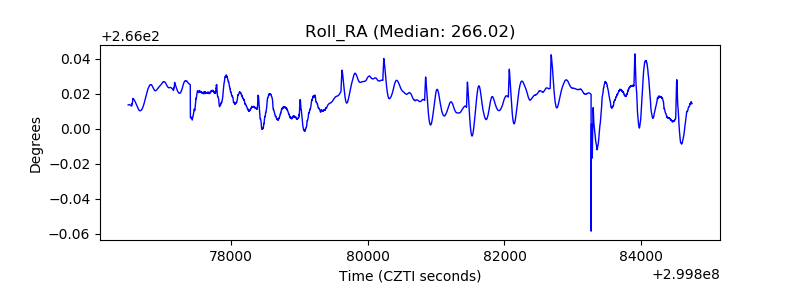 |
| Veto Counter | 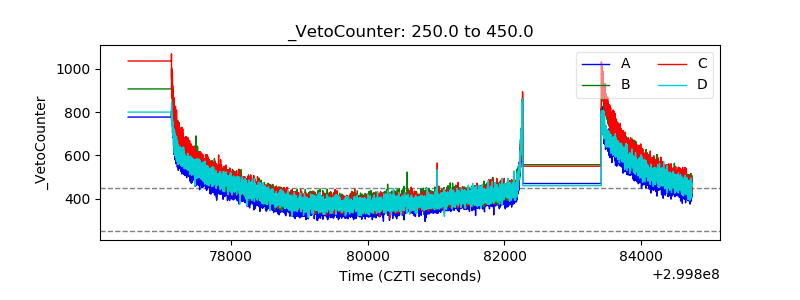 |