| Param | Original file | Final file |
|---|---|---|
| Filename | modeM0/AS1A05_163T01_9000003010_20351cztM0_level2.evt | modeM0/AS1A05_163T01_9000003010_20351cztM0_level2_quad_clean.evt |
| Size (bytes) | 436,075,200 | 94,881,600 |
| Size | 415.9 MB | 90.5 MB |
| Events in quadrant A | 3,115,311 | 620,144 |
| Events in quadrant B | 3,230,660 | 639,592 |
| Events in quadrant C | 3,142,601 | 602,206 |
| Events in quadrant D | 3,301,161 | 583,231 |
| Mode SS | |||
|---|---|---|---|
| Quadrant | BADHDUFLAG | Total packets | Discarded packets |
| A | 0 | 124 | 0 |
| B | 0 | 124 | 0 |
| C | 0 | 124 | 0 |
| D | 0 | 124 | 0 |
| Mode M0 | |||
|---|---|---|---|
| Quadrant | BADHDUFLAG | Total packets | Discarded packets |
| A | 0 | 12899 | 2 |
| B | 0 | 13176 | 2 |
| C | 0 | 13009 | 2 |
| D | 0 | 13850 | 2 |
| Mode M9 | |||
|---|---|---|---|
| Quadrant | BADHDUFLAG | Total packets | Discarded packets |
| A | 0 | 26 | 0 |
| B | 0 | 27 | 0 |
| C | 0 | 27 | 0 |
| D | 0 | 27 | 0 |
| Quadrant | Total seconds | Saturated seconds | Saturation percentage |
|---|---|---|---|
| A | 6138 | 16 | 0.260671% |
| B | 6138 | 38 | 0.619094% |
| C | 6137 | 50 | 0.814730% |
| D | 6137 | 50 | 0.814730% |
Noise dominated data is calculated using 1-second bins in cleaned event files. If a bin has >2000 counts, and if more than 50% of those come from <1% of pixels, then it is considered to be noise-dominated and hence unusable.
| Quadrant | # 1 sec bins | Bins with >0 counts | Bins with >2000 counts | High rate bins dominated by noise | Noise dominated (total time) | Noise dominated (detector-on time) | Marked lightcurve |
|---|---|---|---|---|---|---|---|
| A | 7523 | 6139 | 0 | 0 | 0.00% | 0.00% | 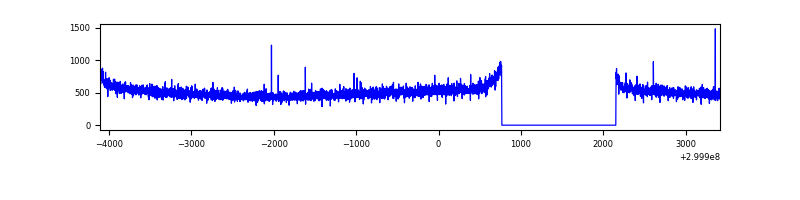 |
| B | 7523 | 6139 | 8 | 8 | 0.11% | 0.13% | 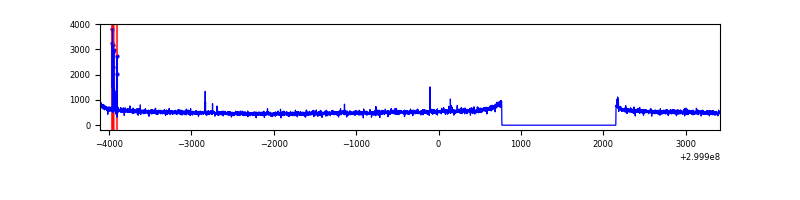 |
| C | 7522 | 6138 | 0 | 0 | 0.00% | 0.00% | 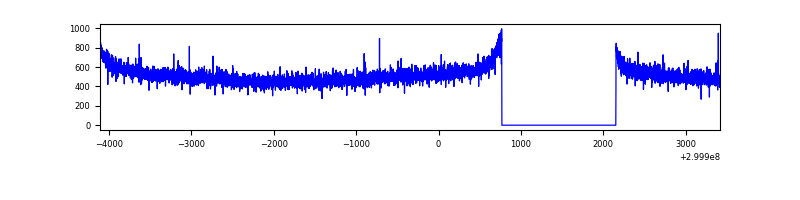 |
| D | 7522 | 6138 | 52 | 52 | 0.69% | 0.85% | 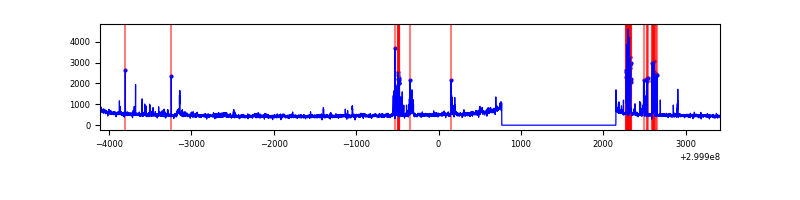 |
Top three noisy pixels from each quadrant. If the there are fewer than three noisy pixels in the level2.evt file, extra rows are filled as -1
| Pixel properties | Quadrant properties | ||||||
|---|---|---|---|---|---|---|---|
| Quadrant | DetID | PixID | Counts | Sigma | Mean | Median | Sigma |
| A | 0 | 226 | 6807 | 37.14 | 808 | 793 | 161.9 |
| A | 13 | 254 | 6626 | 36.02 | 808 | 793 | 161.9 |
| A | 3 | 137 | 6259 | 33.75 | 808 | 793 | 161.9 |
| B | 0 | 85 | 36547 | 236.84 | 808 | 789 | 151.0 |
| B | 12 | 111 | 18239 | 115.58 | 808 | 789 | 151.0 |
| B | 0 | 214 | 17703 | 112.03 | 808 | 789 | 151.0 |
| C | 14 | 238 | 122827 | 682.03 | 772 | 781 | 178.9 |
| C | 1 | 16 | 5443 | 26.05 | 772 | 781 | 178.9 |
| C | 13 | 61 | 5403 | 25.83 | 772 | 781 | 178.9 |
| D | 1 | 52 | 365592 | 1960.03 | 773 | 752 | 186.1 |
| D | 2 | 234 | 21051 | 109.05 | 773 | 752 | 186.1 |
| D | 2 | 184 | 16180 | 82.88 | 773 | 752 | 186.1 |
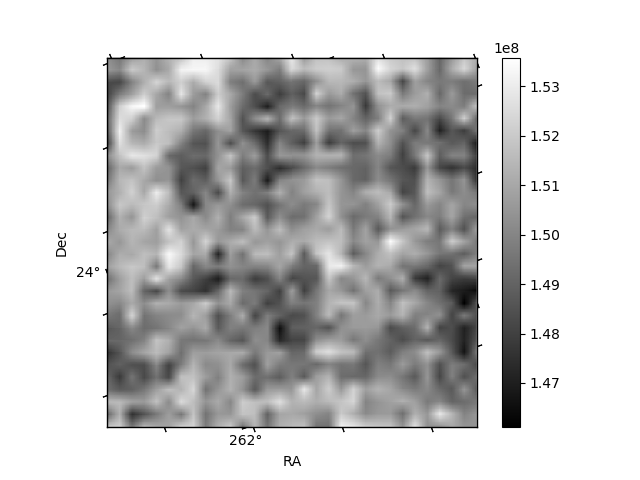
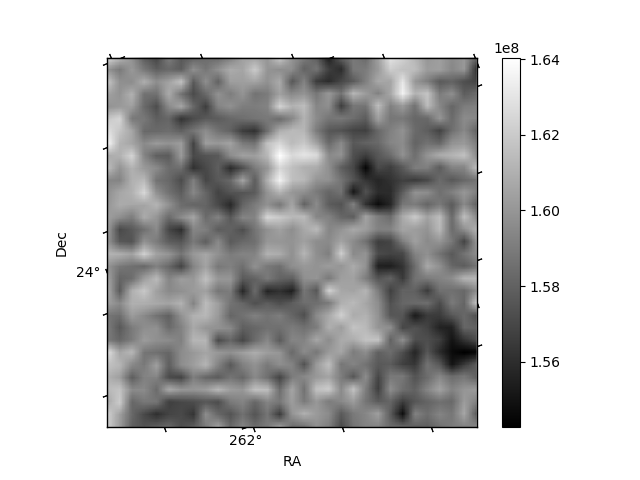
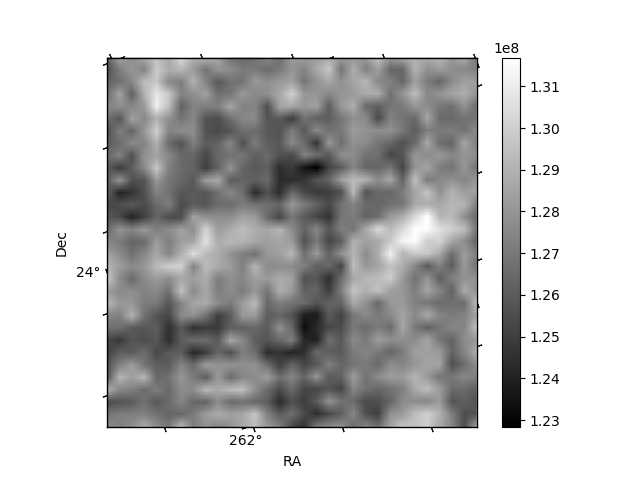
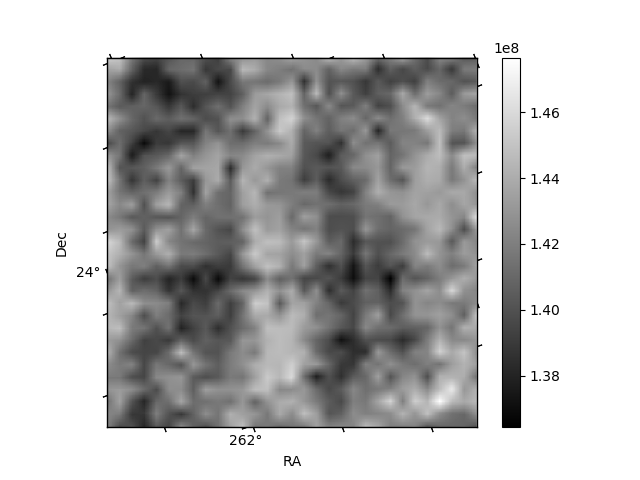
Histogram calculated using DETX and DETY for each event in the final _common_clean file
| Quadrant A | 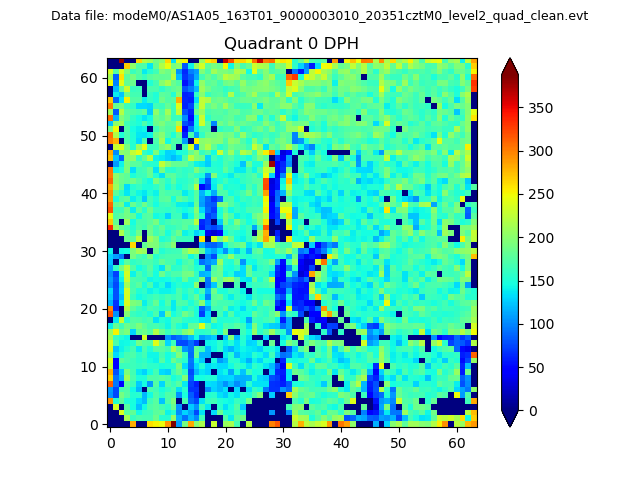 |
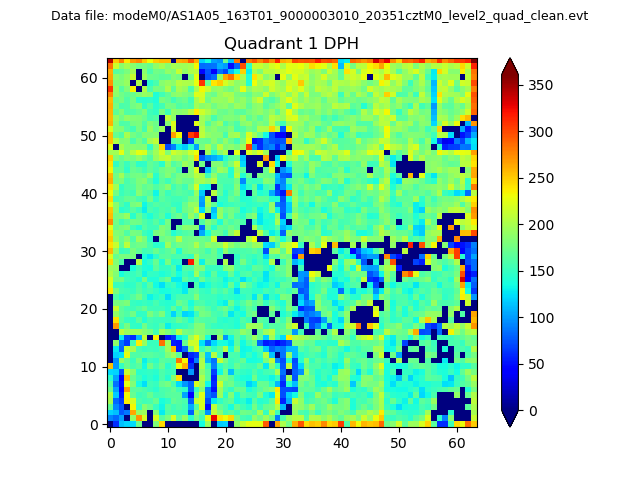 |
Quadrant B |
|---|---|---|---|
| Quadrant D | 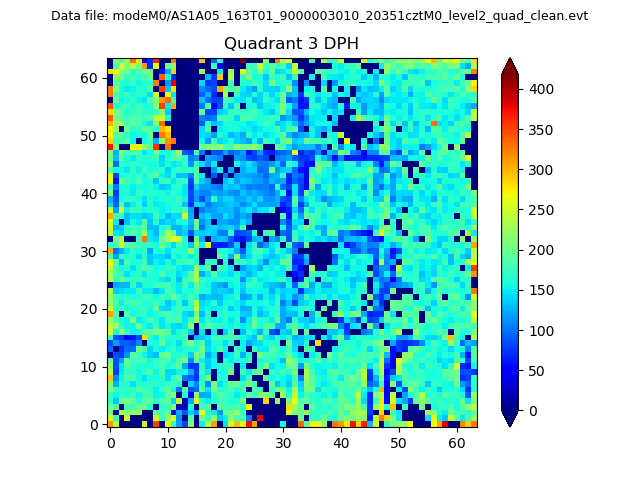 |
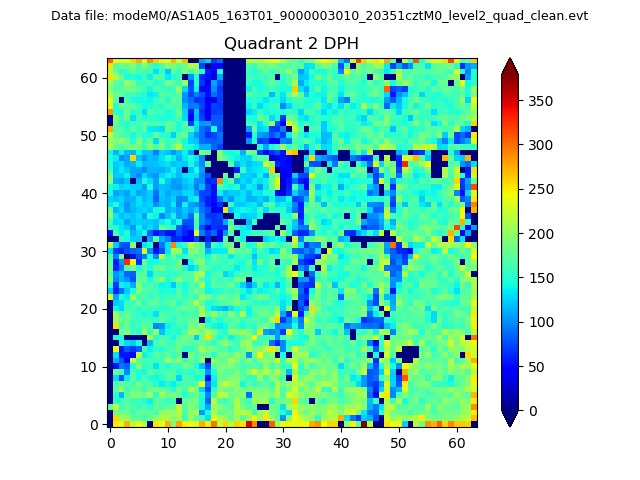 |
Quadrant C |
| Plot type | Count rate plots | Images |
|---|---|---|
| Comparison with Poisson distribution Blue bars denote a histogram of data divided into 1 sec bins. Red curve is a Poisson curve with rate = median count rate of data. |
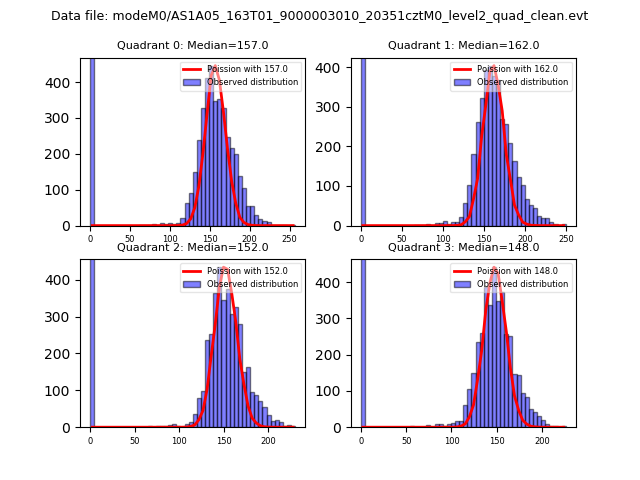 |
 |
| Quadrant-wise count rates Data is divided into 100 sec bins |
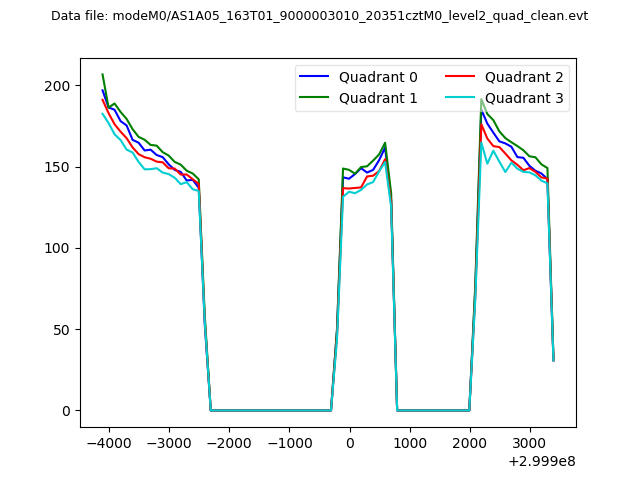 |
|
| Module-wise count rates for Quadrant A Data is divided into 100 sec bins |
 |
 |
| Module-wise count rates for Quadrant B Data is divided into 100 sec bins |
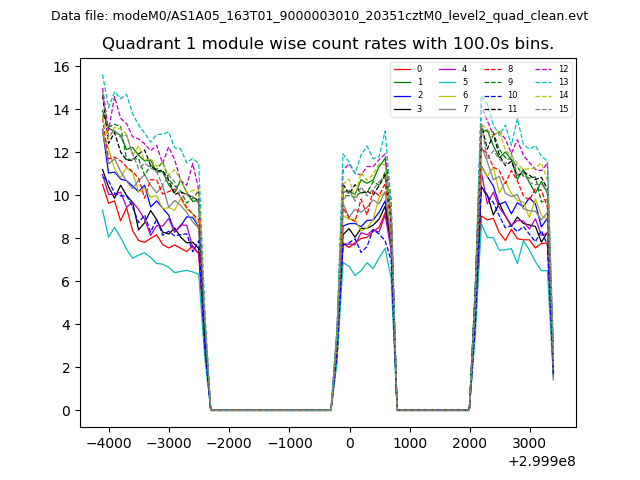 |
 |
| Module-wise count rates for Quadrant C Data is divided into 100 sec bins |
 |
 |
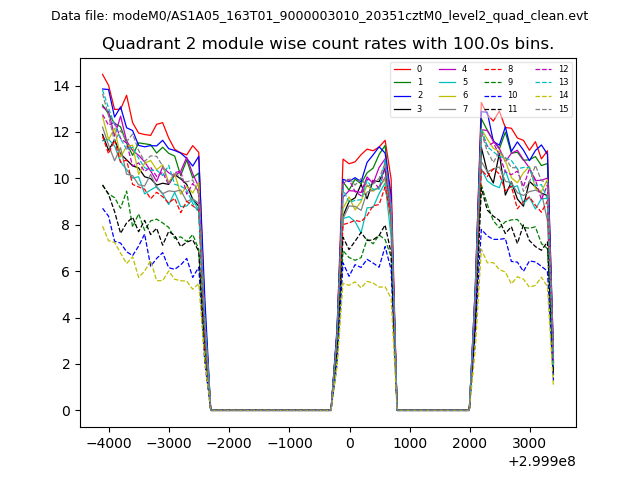
| Module-wise count rates for Quadrant D Data is divided into 100 sec bins |
 |
 |
| Parameter | Plot |
|---|---|
| CZT HV Monitor | 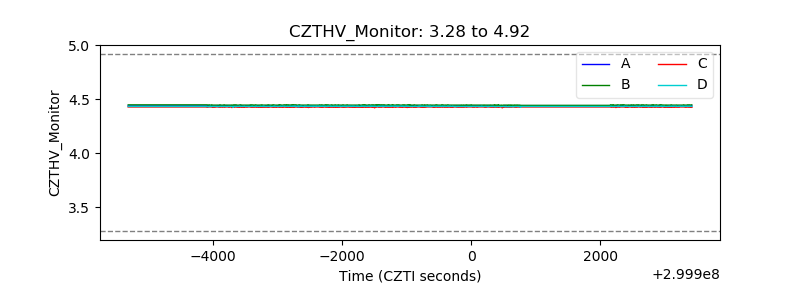 |
| D_VDD | 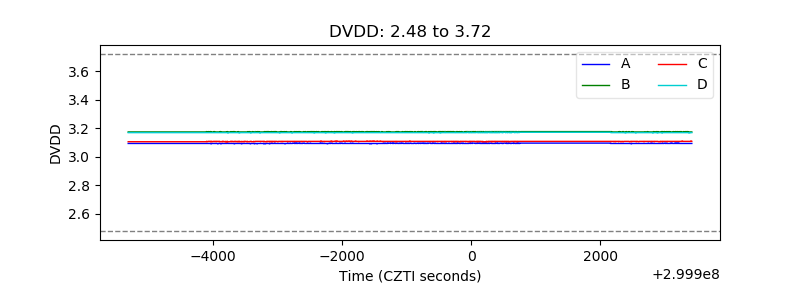 |
| Temperature 1 | 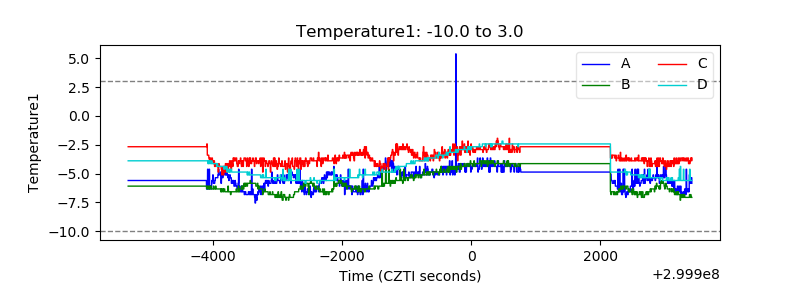 |
| Veto HV Monitor | 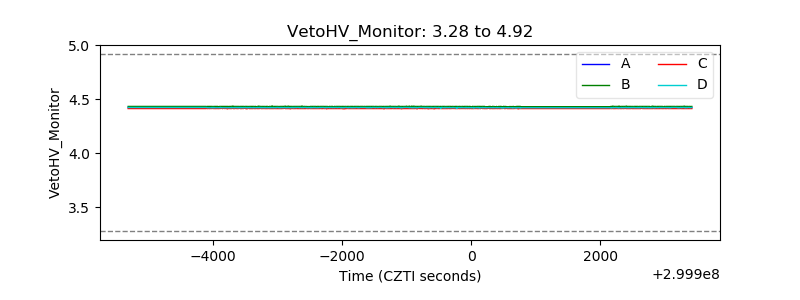 |
| Veto LLD | 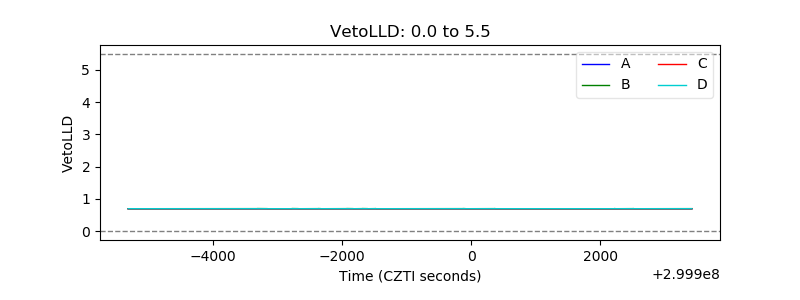 |
| Alpha Counter | 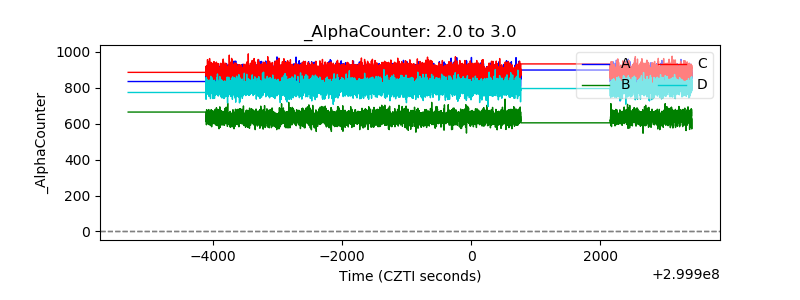 |
| _CPM_Rate | 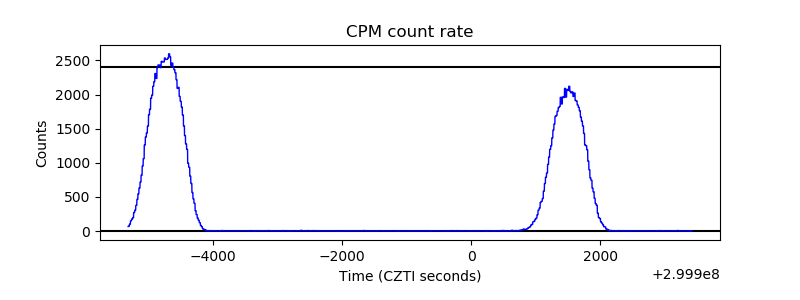 |
| CZT Counter |  |
| +2.5 Volts monitor |  |
| +5 Volts monitor | 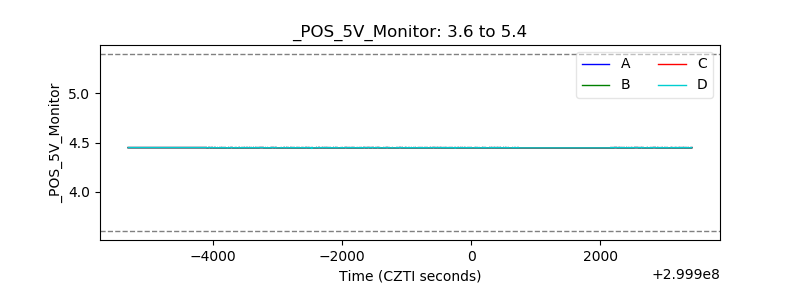 |
| _ROLL_ROT |  |
| _Roll_DEC |  |
| _Roll_RA |  |
| Veto Counter |  |