| Param | Original file | Final file |
|---|---|---|
| Filename | modeM0/AS1A05_163T01_9000003010_20353cztM0_level2.evt | modeM0/AS1A05_163T01_9000003010_20353cztM0_level2_quad_clean.evt |
| Size (bytes) | 457,404,480 | 83,816,640 |
| Size | 436.2 MB | 79.9 MB |
| Events in quadrant A | 3,269,186 | 527,333 |
| Events in quadrant B | 3,319,867 | 536,756 |
| Events in quadrant C | 3,287,925 | 510,437 |
| Events in quadrant D | 3,528,283 | 504,635 |
| Mode SS | |||
|---|---|---|---|
| Quadrant | BADHDUFLAG | Total packets | Discarded packets |
| A | 0 | 136 | 0 |
| B | 0 | 136 | 0 |
| C | 0 | 136 | 0 |
| D | 0 | 136 | 0 |
| Mode M0 | |||
|---|---|---|---|
| Quadrant | BADHDUFLAG | Total packets | Discarded packets |
| A | 0 | 13740 | 3 |
| B | 0 | 13751 | 2 |
| C | 0 | 13750 | 2 |
| D | 0 | 14818 | 2 |
| Mode M9 | |||
|---|---|---|---|
| Quadrant | BADHDUFLAG | Total packets | Discarded packets |
| A | 0 | 24 | 0 |
| B | 0 | 24 | 0 |
| C | 0 | 24 | 0 |
| D | 0 | 24 | 0 |
| Quadrant | Total seconds | Saturated seconds | Saturation percentage |
|---|---|---|---|
| A | 6579 | 46 | 0.699194% |
| B | 6580 | 80 | 1.215805% |
| C | 6580 | 96 | 1.458967% |
| D | 6580 | 53 | 0.805471% |
Noise dominated data is calculated using 1-second bins in cleaned event files. If a bin has >2000 counts, and if more than 50% of those come from <1% of pixels, then it is considered to be noise-dominated and hence unusable.
| Quadrant | # 1 sec bins | Bins with >0 counts | Bins with >2000 counts | High rate bins dominated by noise | Noise dominated (total time) | Noise dominated (detector-on time) | Marked lightcurve |
|---|---|---|---|---|---|---|---|
| A | 8979 | 6581 | 0 | 0 | 0.00% | 0.00% | 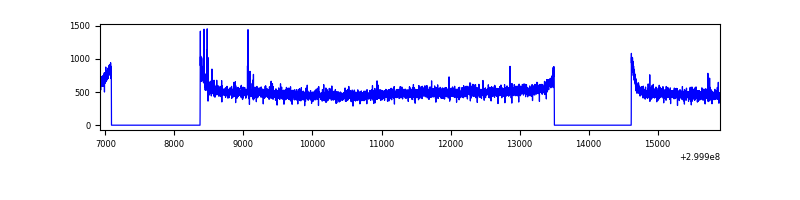 |
| B | 8980 | 6582 | 0 | 0 | 0.00% | 0.00% | 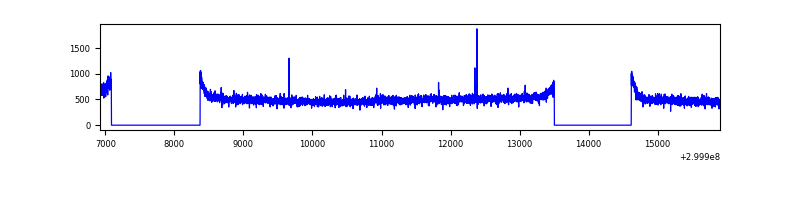 |
| C | 8980 | 6582 | 0 | 0 | 0.00% | 0.00% | 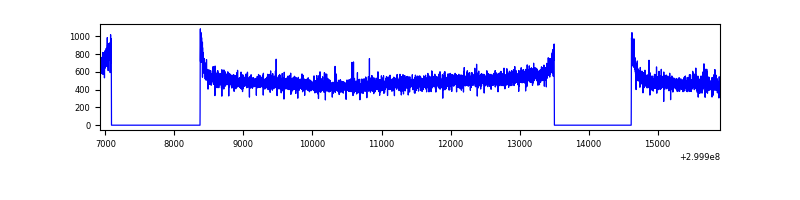 |
| D | 8980 | 6582 | 26 | 26 | 0.29% | 0.40% | 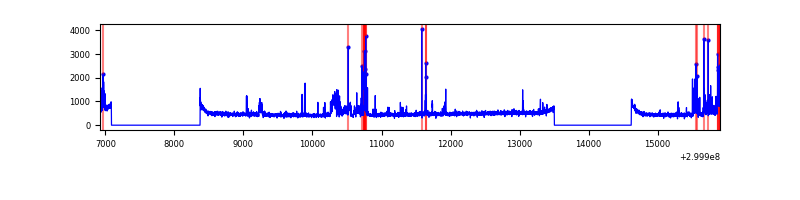 |
Top three noisy pixels from each quadrant. If the there are fewer than three noisy pixels in the level2.evt file, extra rows are filled as -1
| Pixel properties | Quadrant properties | ||||||
|---|---|---|---|---|---|---|---|
| Quadrant | DetID | PixID | Counts | Sigma | Mean | Median | Sigma |
| A | 12 | 96 | 15605 | 86.68 | 844 | 828 | 170.5 |
| A | 0 | 226 | 7374 | 38.4 | 844 | 828 | 170.5 |
| A | 13 | 254 | 7246 | 37.65 | 844 | 828 | 170.5 |
| B | 12 | 111 | 20345 | 121.03 | 840 | 820 | 161.3 |
| B | 11 | 111 | 18009 | 106.55 | 840 | 820 | 161.3 |
| B | 0 | 214 | 17757 | 104.99 | 840 | 820 | 161.3 |
| C | 14 | 238 | 126044 | 668.61 | 803 | 809 | 187.3 |
| C | 7 | 247 | 12089 | 60.22 | 803 | 809 | 187.3 |
| C | 7 | 220 | 11210 | 55.53 | 803 | 809 | 187.3 |
| D | 11 | 176 | 219127 | 1107.06 | 814 | 791 | 197.2 |
| D | 7 | 238 | 144266 | 727.48 | 814 | 791 | 197.2 |
| D | 1 | 52 | 68473 | 343.18 | 814 | 791 | 197.2 |
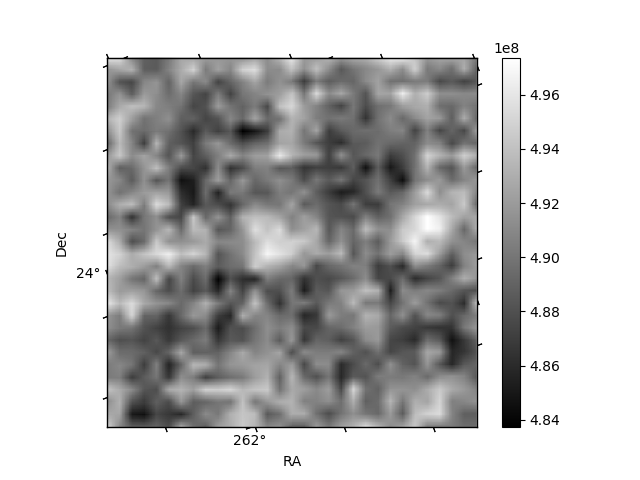
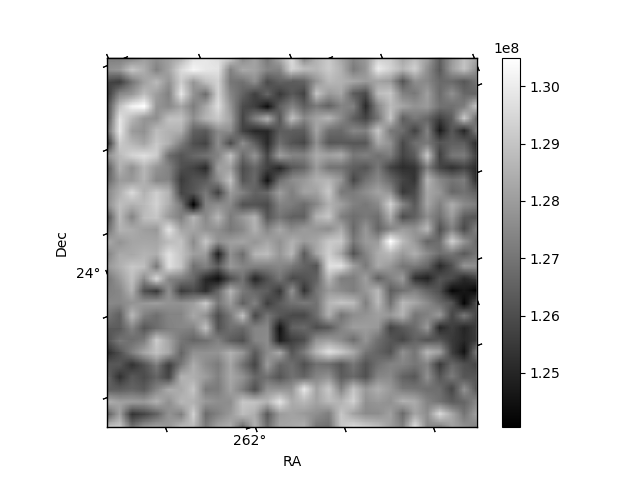
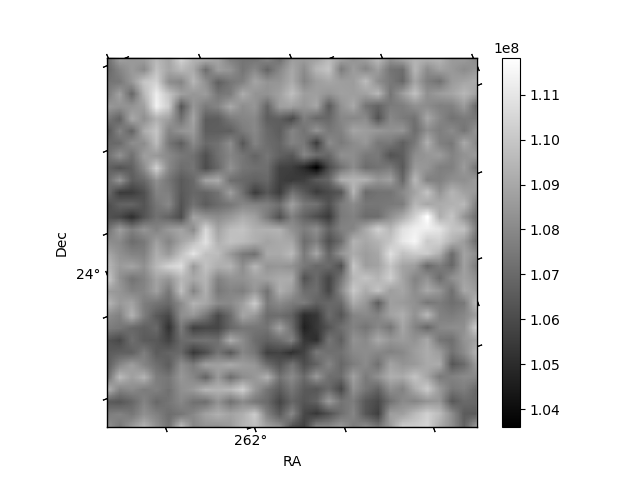
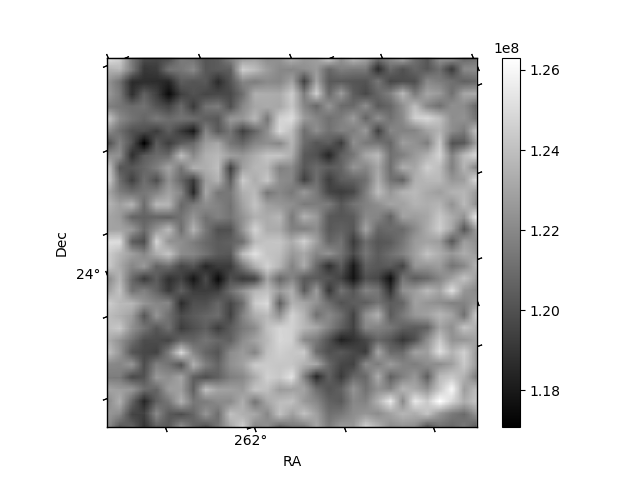
Histogram calculated using DETX and DETY for each event in the final _common_clean file
| Quadrant A | 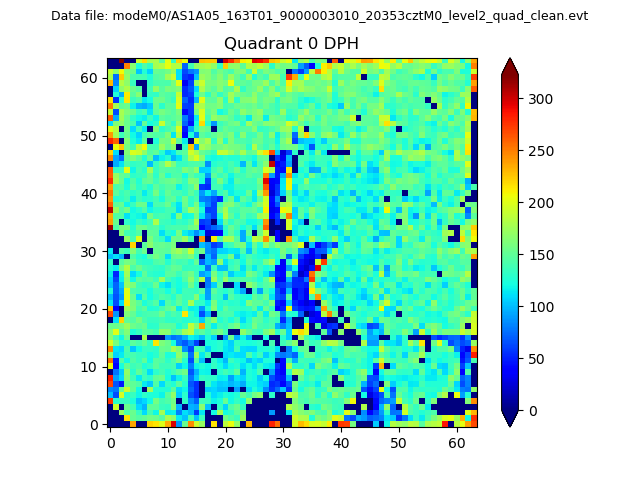 |
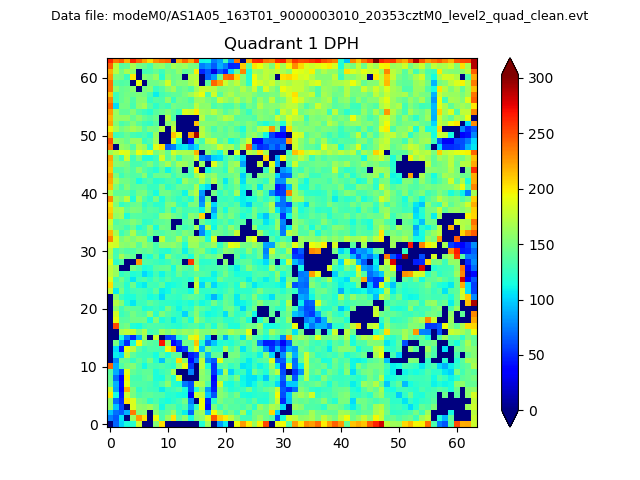 |
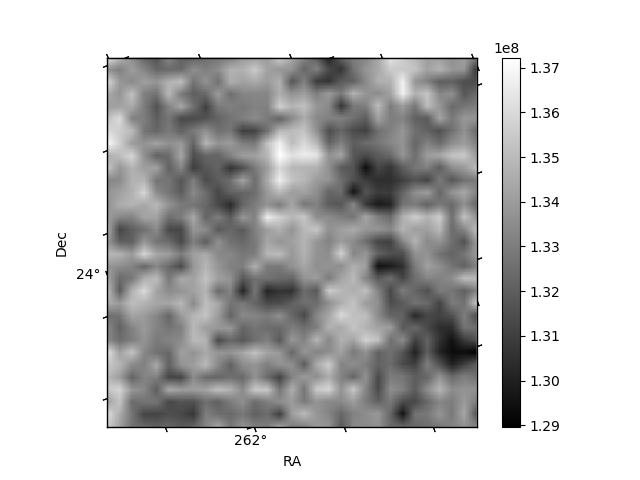
Quadrant B |
|---|---|---|---|
| Quadrant D | 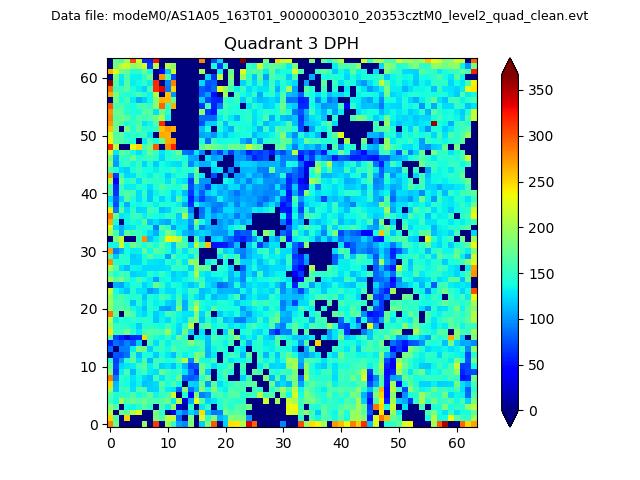 |
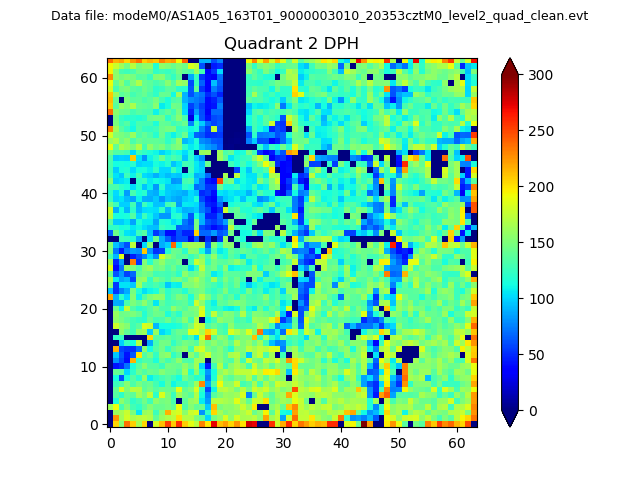 |
Quadrant C |
| Plot type | Count rate plots | Images |
|---|---|---|
| Comparison with Poisson distribution Blue bars denote a histogram of data divided into 1 sec bins. Red curve is a Poisson curve with rate = median count rate of data. |
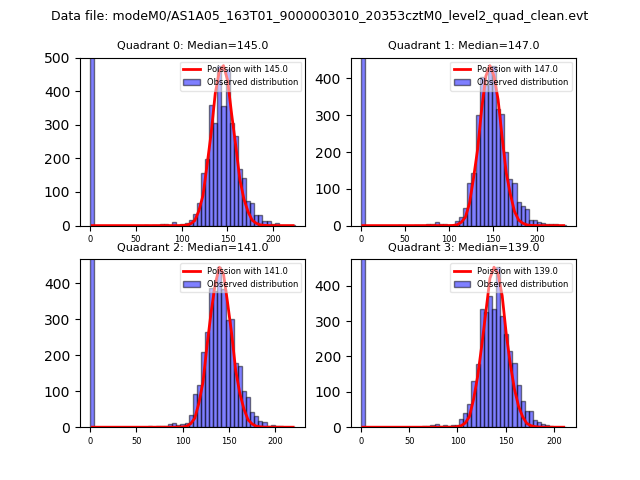 |
 |
| Quadrant-wise count rates Data is divided into 100 sec bins |
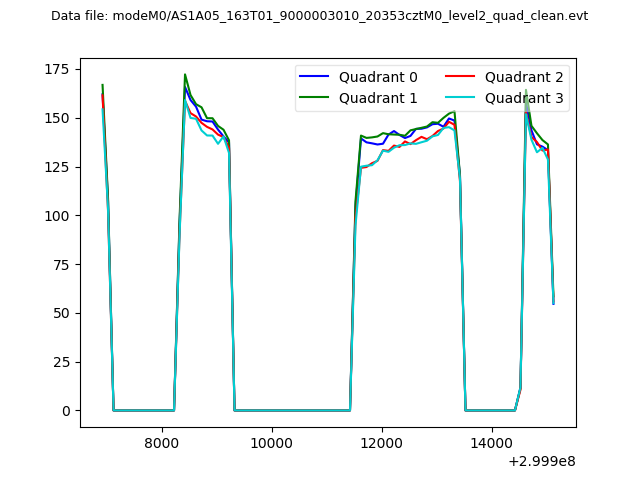 |
|
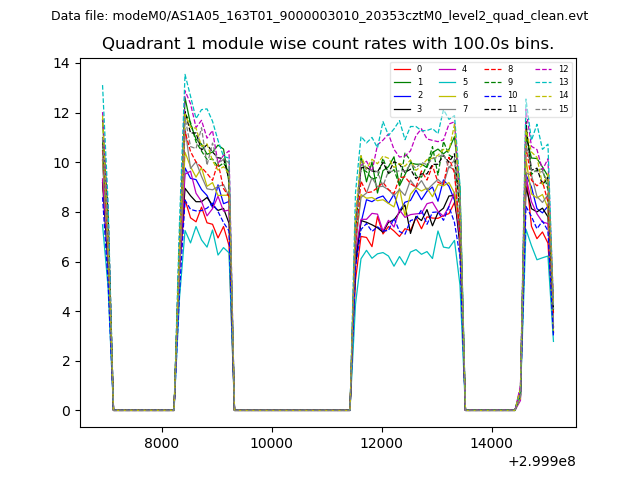
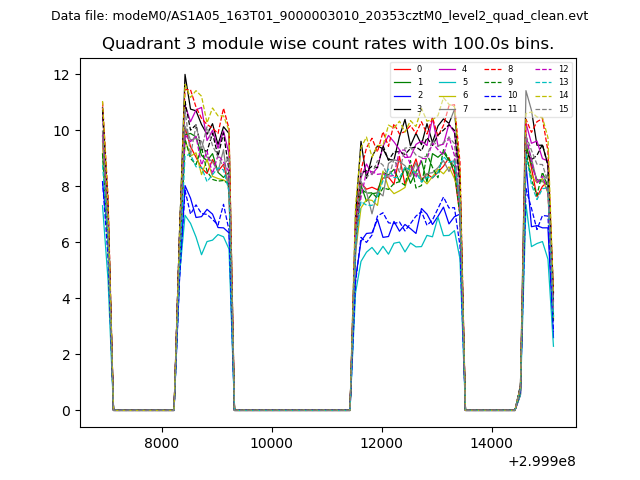
| Module-wise count rates for Quadrant A Data is divided into 100 sec bins |
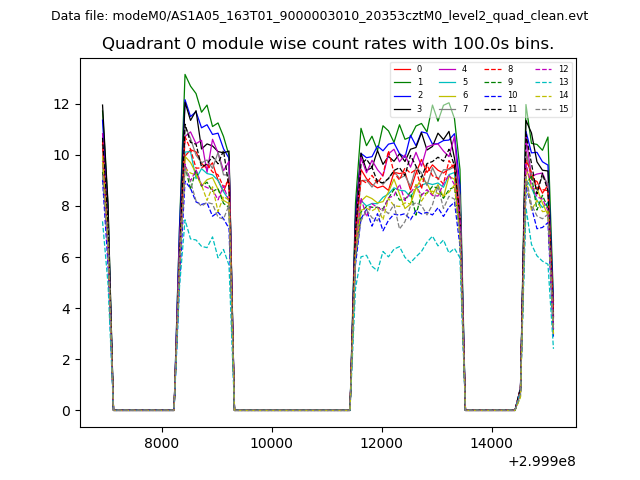 |
 |
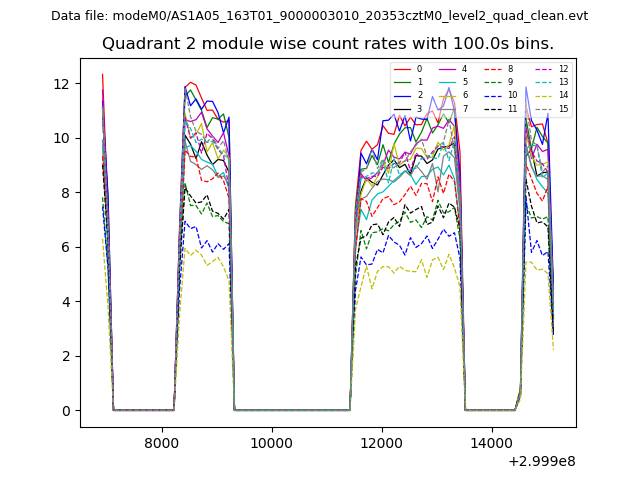
| Module-wise count rates for Quadrant B Data is divided into 100 sec bins |
 |
 |
| Module-wise count rates for Quadrant C Data is divided into 100 sec bins |
 |
 |
| Module-wise count rates for Quadrant D Data is divided into 100 sec bins |
 |
 |
| Parameter | Plot |
|---|---|
| CZT HV Monitor | 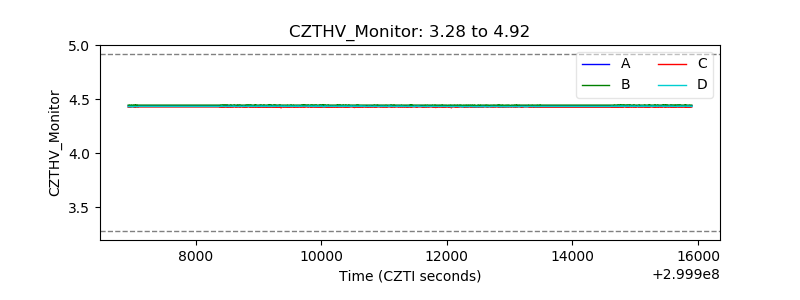 |
| D_VDD | 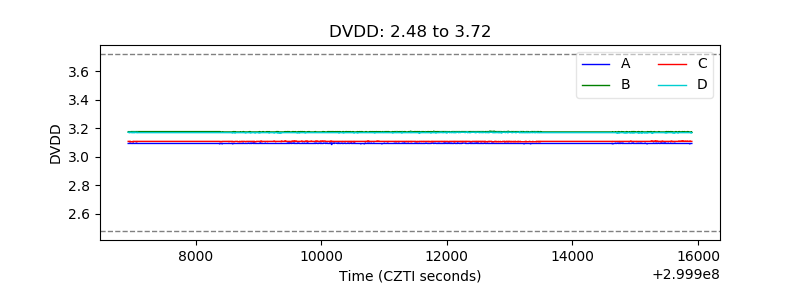 |
| Temperature 1 | 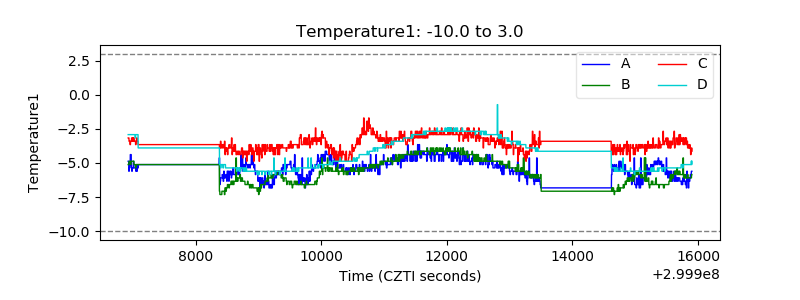 |
| Veto HV Monitor | 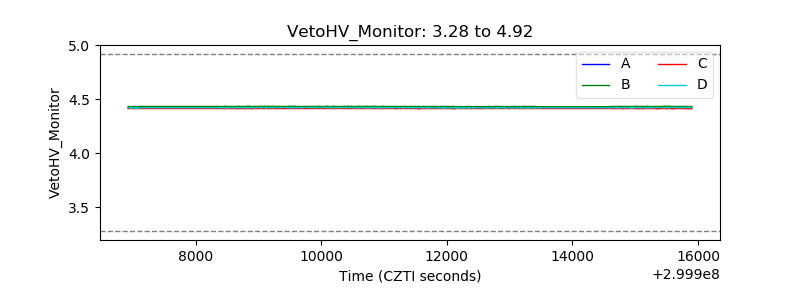 |
| Veto LLD | 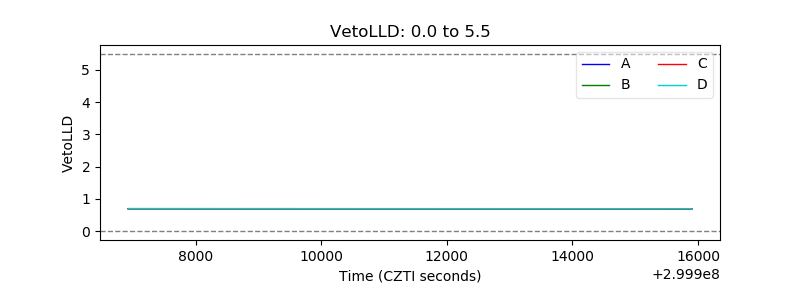 |
| Alpha Counter | 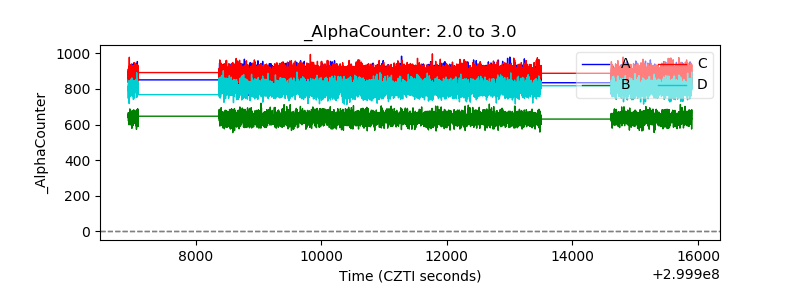 |
| _CPM_Rate | 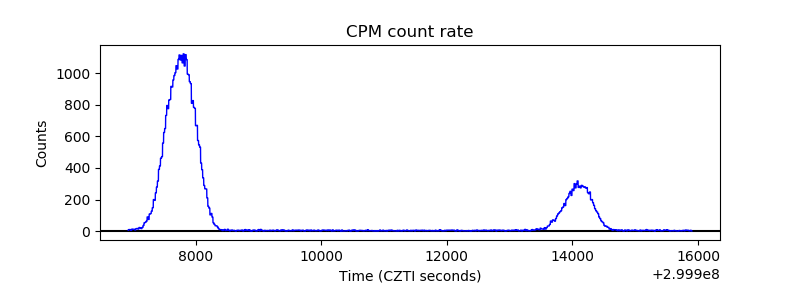 |
| CZT Counter | 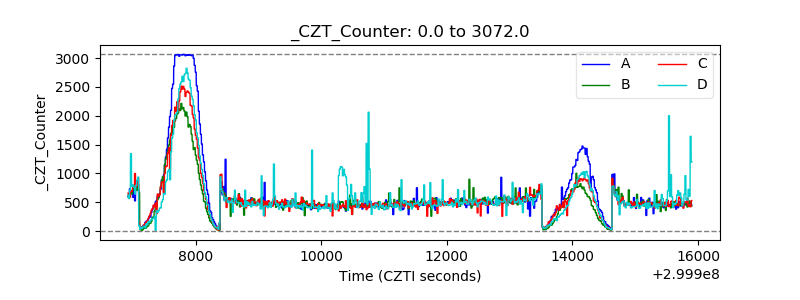 |
| +2.5 Volts monitor |  |
| +5 Volts monitor | 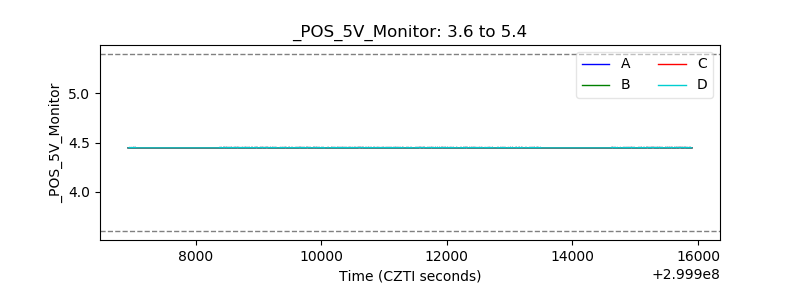 |
| _ROLL_ROT | 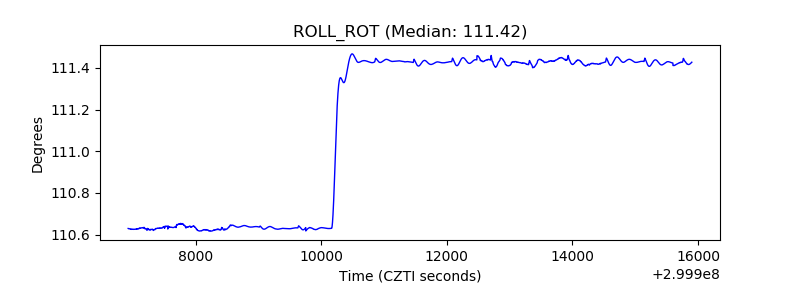 |
| _Roll_DEC | 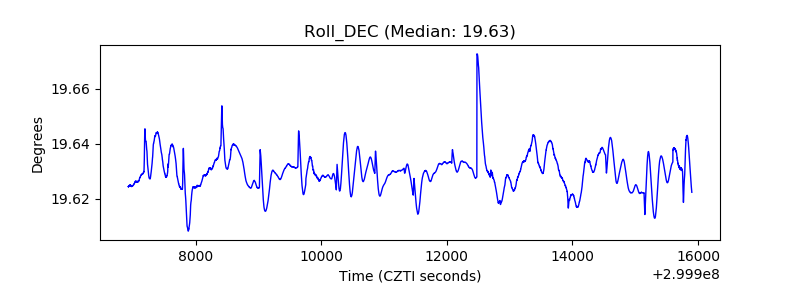 |
| _Roll_RA | 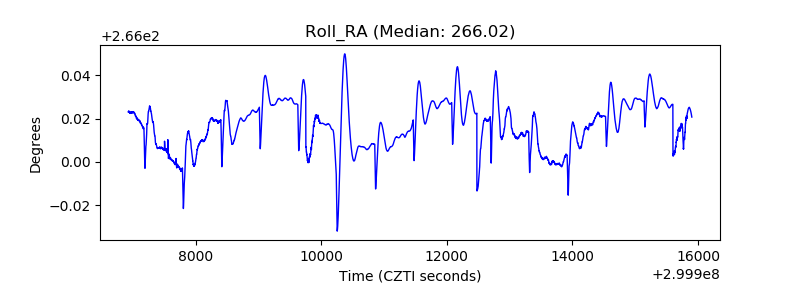 |
| Veto Counter | 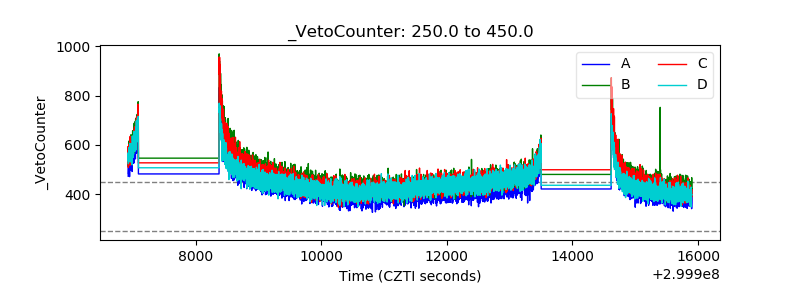 |