| Param | Original file | Final file |
|---|---|---|
| Filename | modeM0/AS1A05_163T01_9000003010_20355cztM0_level2.evt | modeM0/AS1A05_163T01_9000003010_20355cztM0_level2_quad_clean.evt |
| Size (bytes) | 494,288,640 | 80,392,320 |
| Size | 471.4 MB | 76.7 MB |
| Events in quadrant A | 3,525,937 | 484,983 |
| Events in quadrant B | 3,580,686 | 491,428 |
| Events in quadrant C | 3,560,708 | 474,261 |
| Events in quadrant D | 3,801,385 | 470,788 |
| Mode SS | |||
|---|---|---|---|
| Quadrant | BADHDUFLAG | Total packets | Discarded packets |
| A | 0 | 150 | 0 |
| B | 0 | 150 | 0 |
| C | 0 | 150 | 0 |
| D | 0 | 150 | 0 |
| Mode M0 | |||
|---|---|---|---|
| Quadrant | BADHDUFLAG | Total packets | Discarded packets |
| A | 0 | 15289 | 3 |
| B | 0 | 15307 | 2 |
| C | 0 | 15304 | 2 |
| D | 0 | 16342 | 2 |
| Mode M9 | |||
|---|---|---|---|
| Quadrant | BADHDUFLAG | Total packets | Discarded packets |
| A | 0 | 10 | 0 |
| B | 0 | 10 | 0 |
| C | 0 | 10 | 0 |
| D | 0 | 10 | 0 |
| Quadrant | Total seconds | Saturated seconds | Saturation percentage |
|---|---|---|---|
| A | 7371 | 191 | 2.591236% |
| B | 7372 | 216 | 2.930005% |
| C | 7372 | 187 | 2.536625% |
| D | 7372 | 160 | 2.170374% |
Noise dominated data is calculated using 1-second bins in cleaned event files. If a bin has >2000 counts, and if more than 50% of those come from <1% of pixels, then it is considered to be noise-dominated and hence unusable.
| Quadrant | # 1 sec bins | Bins with >0 counts | Bins with >2000 counts | High rate bins dominated by noise | Noise dominated (total time) | Noise dominated (detector-on time) | Marked lightcurve |
|---|---|---|---|---|---|---|---|
| A | 8336 | 7373 | 0 | 0 | 0.00% | 0.00% | 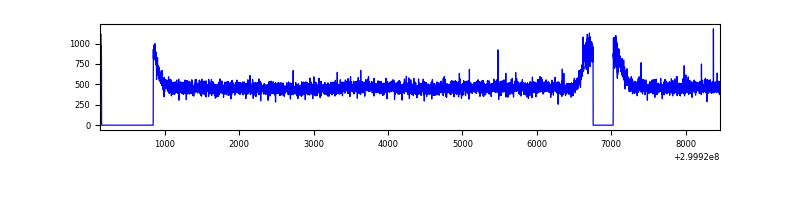 |
| B | 8337 | 7374 | 0 | 0 | 0.00% | 0.00% | 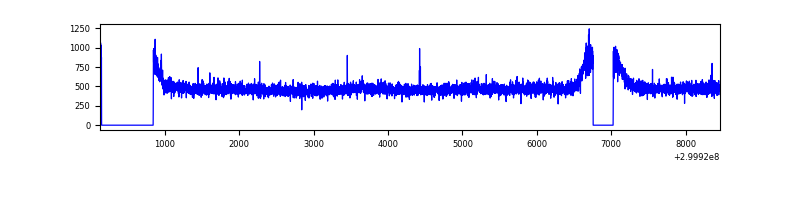 |
| C | 8337 | 7374 | 0 | 0 | 0.00% | 0.00% | 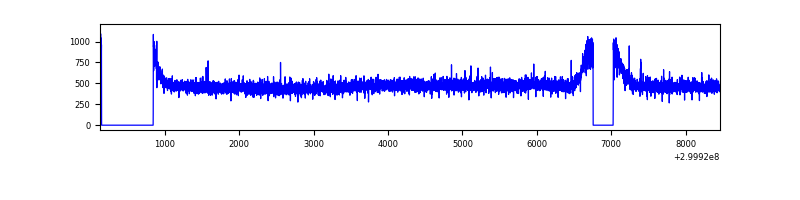 |
| D | 8337 | 7374 | 30 | 30 | 0.36% | 0.41% | 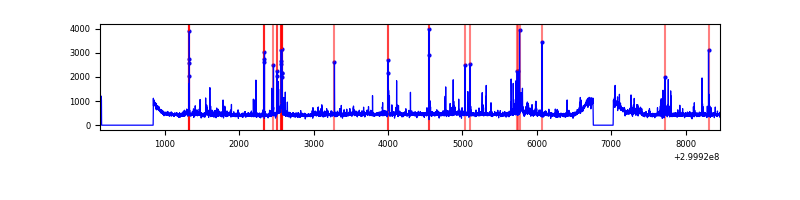 |
Top three noisy pixels from each quadrant. If the there are fewer than three noisy pixels in the level2.evt file, extra rows are filled as -1
| Pixel properties | Quadrant properties | ||||||
|---|---|---|---|---|---|---|---|
| Quadrant | DetID | PixID | Counts | Sigma | Mean | Median | Sigma |
| A | 3 | 137 | 8134 | 38.98 | 915 | 894 | 185.7 |
| A | 0 | 226 | 7903 | 37.73 | 915 | 894 | 185.7 |
| A | 13 | 254 | 7685 | 36.56 | 915 | 894 | 185.7 |
| B | 12 | 111 | 22735 | 122.38 | 908 | 882 | 178.6 |
| B | 11 | 111 | 20242 | 108.42 | 908 | 882 | 178.6 |
| B | 14 | 111 | 18543 | 98.91 | 908 | 882 | 178.6 |
| C | 14 | 238 | 134045 | 642.07 | 876 | 880 | 207.4 |
| C | 7 | 220 | 7517 | 32.0 | 876 | 880 | 207.4 |
| C | 3 | 233 | 6634 | 27.74 | 876 | 880 | 207.4 |
| D | 1 | 52 | 210076 | 952.28 | 893 | 865 | 219.7 |
| D | 7 | 238 | 104593 | 472.14 | 893 | 865 | 219.7 |
| D | 11 | 176 | 99486 | 448.9 | 893 | 865 | 219.7 |
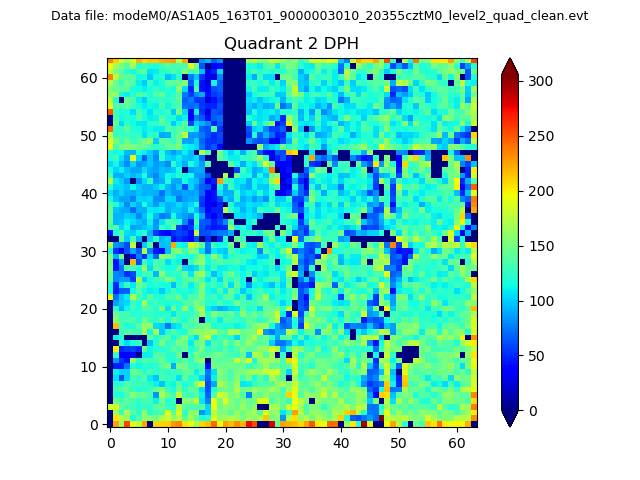
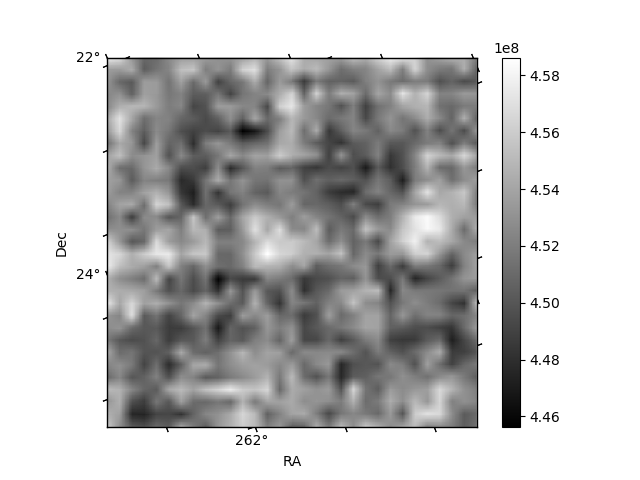
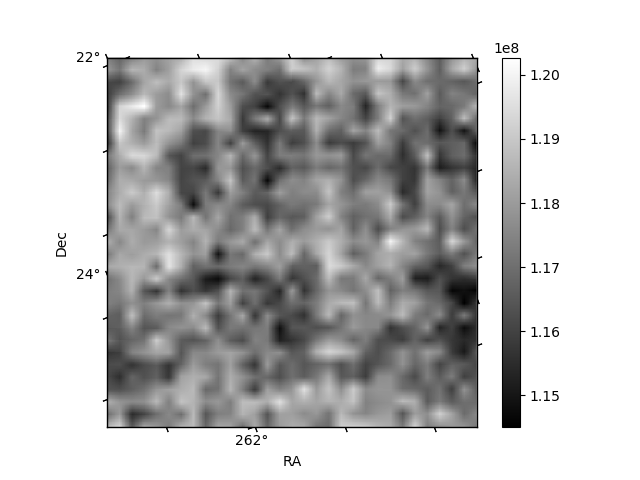
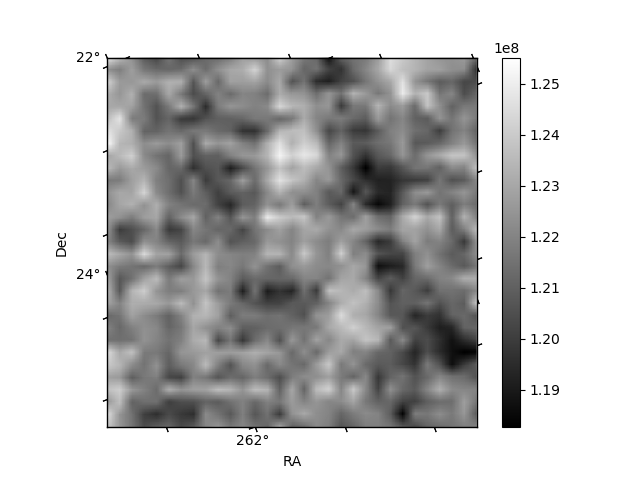
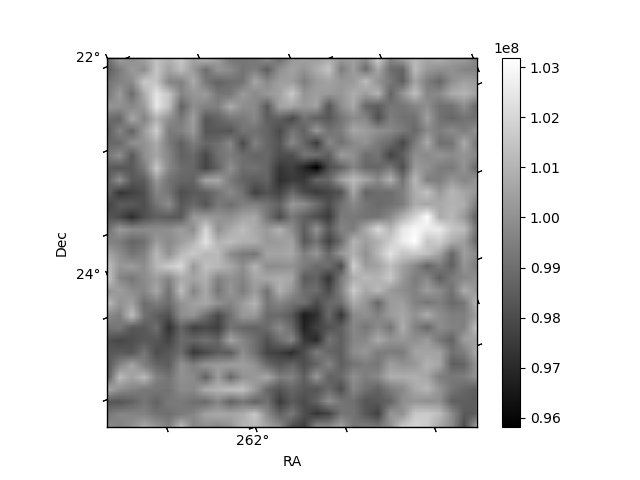
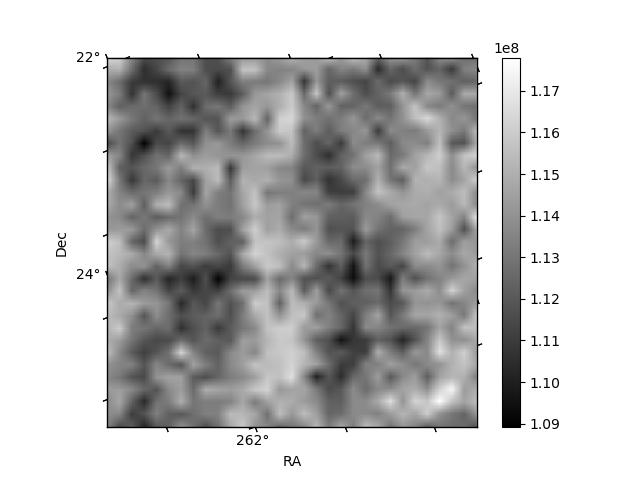
Histogram calculated using DETX and DETY for each event in the final _common_clean file
| Quadrant A | 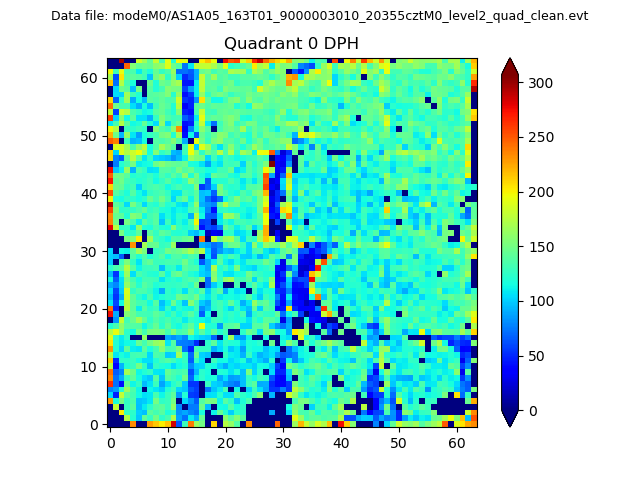 |
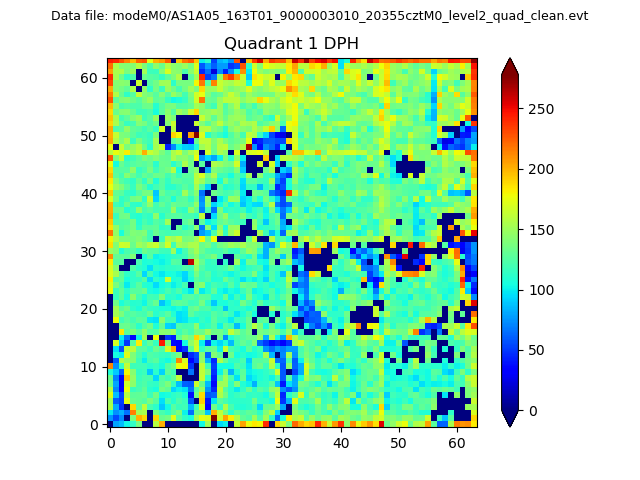 |
Quadrant B |
|---|---|---|---|
| Quadrant D | 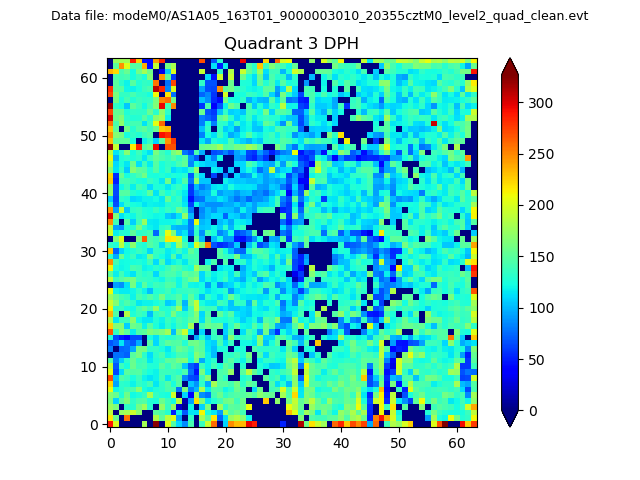 |
 |
Quadrant C |
| Plot type | Count rate plots | Images |
|---|---|---|
| Comparison with Poisson distribution Blue bars denote a histogram of data divided into 1 sec bins. Red curve is a Poisson curve with rate = median count rate of data. |
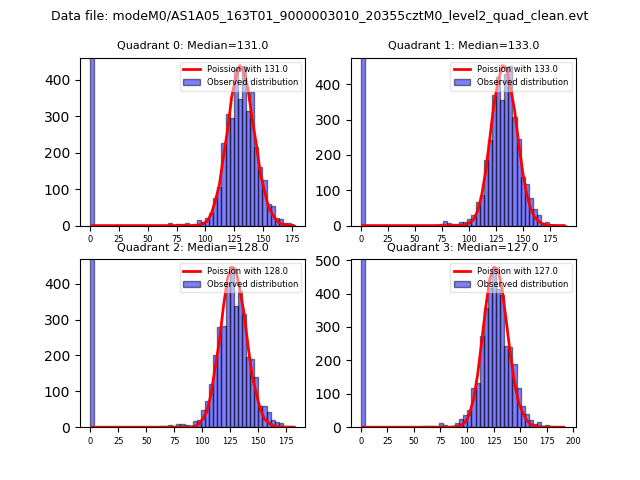 |
 |
| Quadrant-wise count rates Data is divided into 100 sec bins |
 |
|
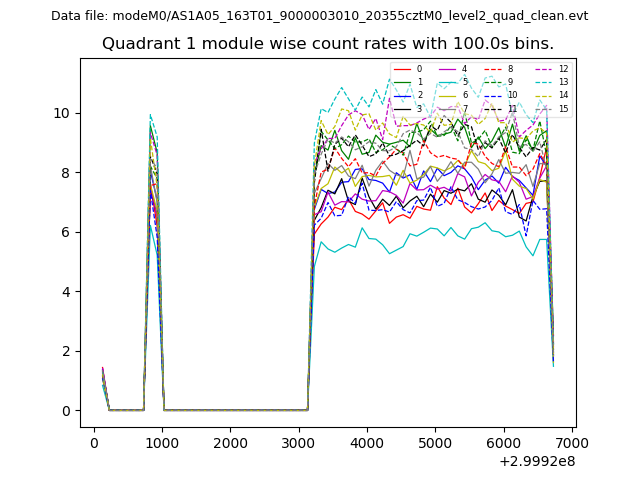
| Module-wise count rates for Quadrant A Data is divided into 100 sec bins |
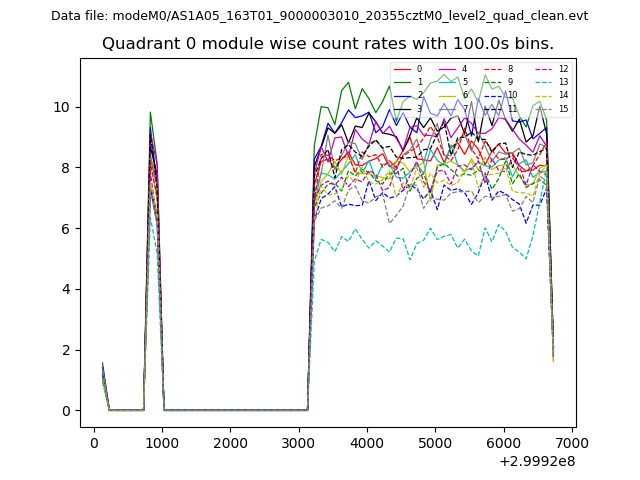 |
 |
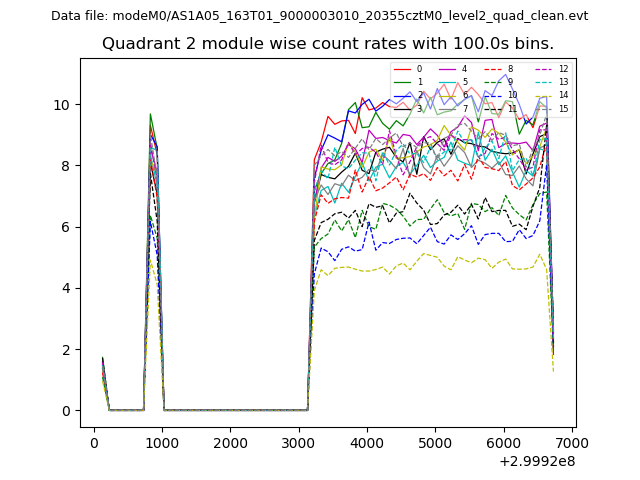
| Module-wise count rates for Quadrant B Data is divided into 100 sec bins |
 |
 |
| Module-wise count rates for Quadrant C Data is divided into 100 sec bins |
 |
 |
| Module-wise count rates for Quadrant D Data is divided into 100 sec bins |
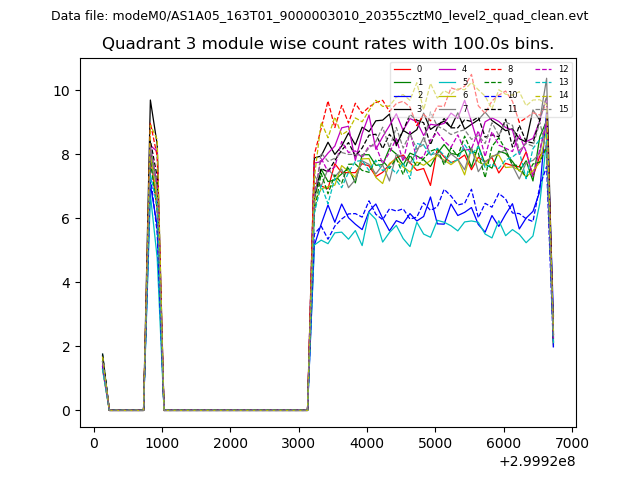 |
 |
| Parameter | Plot |
|---|---|
| CZT HV Monitor | 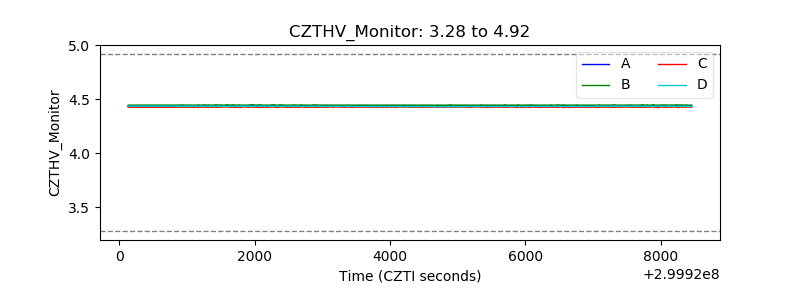 |
| D_VDD | 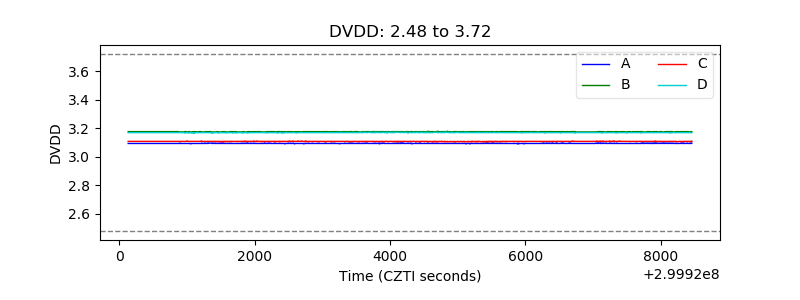 |
| Temperature 1 | 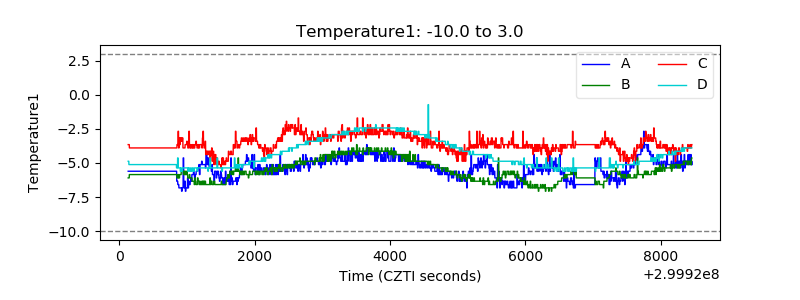 |
| Veto HV Monitor | 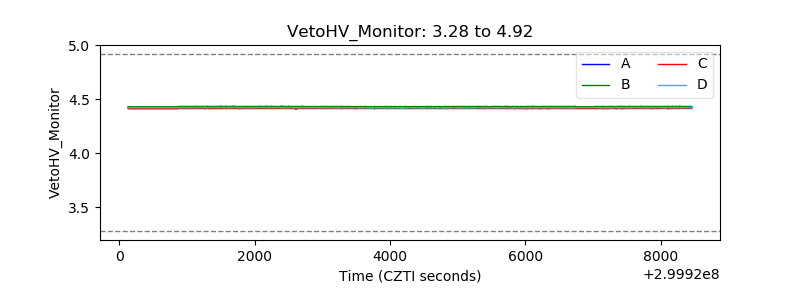 |
| Veto LLD | 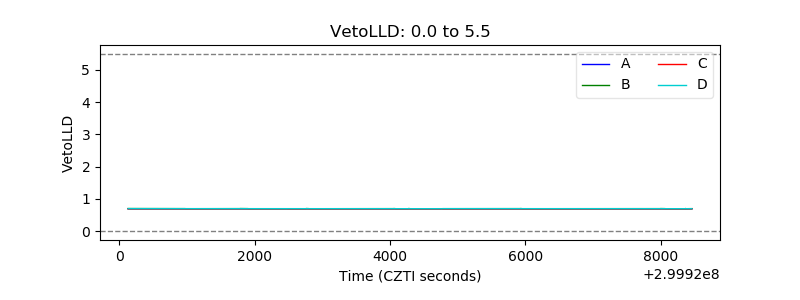 |
| Alpha Counter |  |
| _CPM_Rate |  |
| CZT Counter | 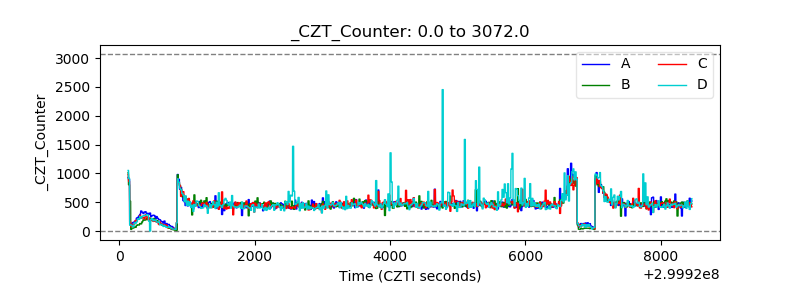 |
| +2.5 Volts monitor |  |
| +5 Volts monitor |  |
| _ROLL_ROT | 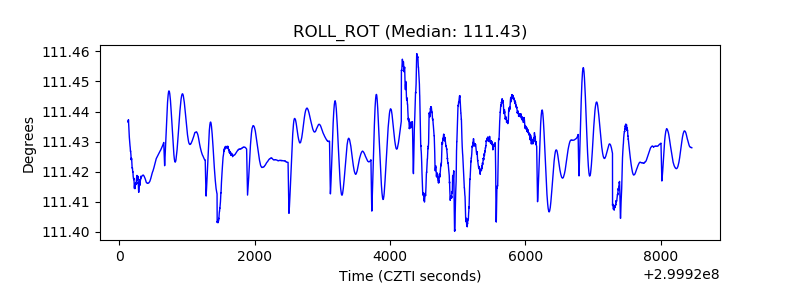 |
| _Roll_DEC | 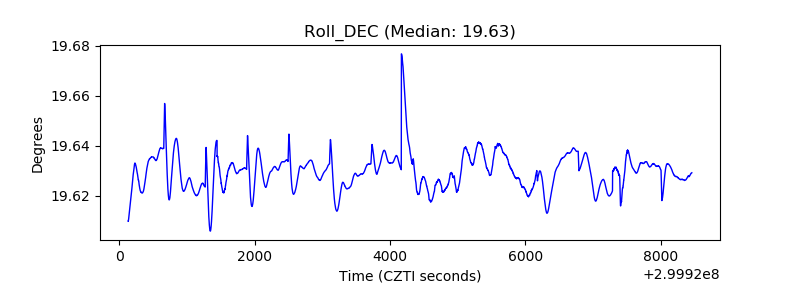 |
| _Roll_RA | 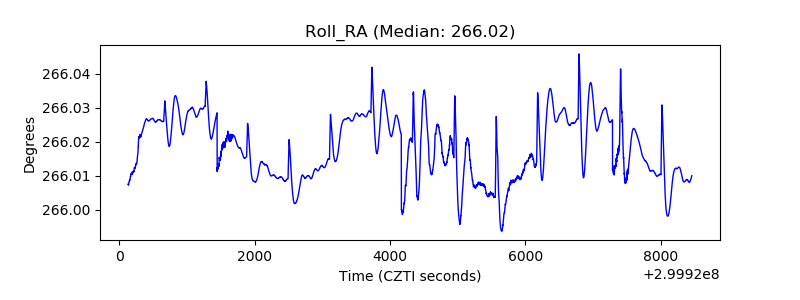 |
| Veto Counter | 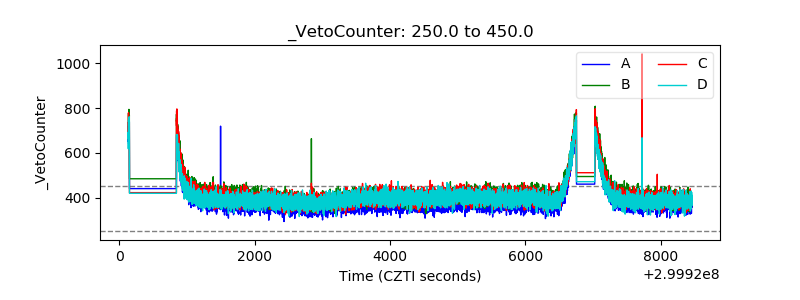 |